Article
J. Braz. Chem. Soc., Vol. 24, No. 9, 1385-1395, 2013. Printed in Brazil - ©2013 Sociedade Brasileira de Química 0103 - 5053 $6.00+0.00
A
*e-mail: [email protected]
Quantification of Pharmaceuticals and Personal Care Product Residues in
Surface and Drinking Water Samples by SPE and LC-ESI-MS/MS
Maria Angelis K. Silveira, Sergiane S. Caldas, Juliana R. Guilherme, Fabiane P. Costa, Bruno de S. Guimarães, Maristela B. R. Cerqueira,
Bruno M. Soares and Ednei G. Primel*
Laboratório de Análises de Compostos Orgânicos e Metais, Escola de Química e Alimentos, Universidade Federal do Rio Grande, Av. Itália, km 8, 96201-900 Rio Grande-RS, Brazil
Atualmente as nações industrializadas se deparam com um novo problema, a contaminação das águas por contaminantes emergentes, entre eles fármacos e produtos de cuidado pessoal (PPCPs). Neste trabalho, um método analítico empregando extração em fase sólida (SPE) e cromatografia líquida com fonte de ionização eletrospray acoplada com espectrometria de massas em série foi desenvolvido e validado para a determinação de nimesulida, amitriptilina, enalapril, glibenclamida, haloperidol e metilparabeno em amostras de água. O estudo da SPE envolveu a utilização de um planejamento fatorial fracionado 2v
5-1 para a seleção das variáveis que afetam o procedimento de
extração. Os limites de detecção variaram de 0,01 a 0,2 µg L-1 e os de quantificação de 0,05 a
1,0 µg L-1. Obteve-se uma boa linearidade (coeficiente de determinação, r > 0,99) para todos os
compostos. As recuperações variaram entre 65 e 120% com valores de desvio padrão relativo (RSD) menores que 20%. O método foi aplicado para a determinação de PPCPs em amostras de água superficial e potável durante 3 meses. Os níveis de PPCPs detectados foram da ordem de µg L-1.
Currently, industrialized nations have faced a new problem, the contamination of water by emerging contaminants, such as pharmaceuticals and personal care products (PPCPs). A method based on solid-phase extraction (SPE) and liquid chromatography with electrospray ionization source tandem mass spectrometry was developed and validated for the determination of nimesulide, amitriptyline, enalapril, glibenclamide, haloperidol and methylparaben in water samples. In the study of SPE, a 2v
5-1 fractional factorial design was used as a tool for the selection of the
most significant variables in the extraction efficiency of the analytes under study. The limits of detection and quantification ranged from 0.01 to 0.2 µg L-1 and 0.05 to 1.0 µg L-1, respectively.
Good linearity was obtained by a correlation coefficient (r) > 0.99 for all compounds. Recoveries ranged from 65 and 120% with relative standard deviation (RSD) lower than 20%. The method was applied to the determination of PPCPs in samples of surface and drinking water for three months. PPCPs were detected at µg L-1 levels.
Keywords: SPE, pharmaceuticals, personal care products, LC-ESI-MS/MS, matrix effect
Introduction
Pharmaceuticals and personal care products (PPCPs) are a group of emerging, potentially hazardous contaminants, which have, to date, received limited attention, although interest in this area has increased considerably and the need for further investigation in this field has been emphasized
by different research groups.1-5 Pharmaceuticals have been
recognized as emerging contaminants in the environment mainly due to their growing consumption, improper
disposal of unused or expired drugs and inefficiency of
wastewater treatment plants to remove them entirely.6-8
Some PPCPs are capable of bioconcentration and many of those under investigation are biologically active compounds. Some are suspected of, or are recognized as being endocrine disruptors, which can potentially affect
the environment and human health.1 In 2012, the Strategic
issue. It highlights the potential adverse effects of endocrine disruptors on human health and the environment and calls the attention to the need to protect vulnerable humans and
ecosystems.9Additionally, they are continuously introduced
into the environment; therefore, even compounds of low persistence might cause adverse effects to human and
aquatic life.1,2 Another important issue is the synergic
effect of different PPCPs on aquatic life, through their non-targeted action combined with many other biologically
active compounds found in the environment.10,11 After their
excretion, they can be found in the environment in their parent forms, as metabolites or as transformation products
which are generated during the wastewater treatment.12
Pharmaceutical and personal care products, in several forms, such as antidepressant (amitriptyline), a n t i d i a b e t i c ( g l i b e n c l a m i d e ) , a n t i p s y c h o t i c (haloperidol), antihypertension (enalapril), non-steroidal anti-inflammatory (nimesulide) and also preservative compounds (methylparaben), have been found in water samples. Amitriptyline is a widely used tricyclic antidepressant, which has been used in many health treatments to treat depression, anxiety and chronic pain
syndromes.13 Glibenclamide is an antidiabetic drug
which belongs to the sulfonylurea class of medications. It is a second generation oral sulfonylurea antidiabetic agent widely used for the treatment of type II diabetes
mellitus and gestational diabetes mellitus.14 Haloperidol,
which belongs to the butyrophenone group of drugs, is as an antipsychotic drug. It is still one of the most widely used drug in the treatment of schizophrenic and other
psychiatric disorders.15 Enalapril is used in the treatment of
hypertension and some types of chronic heart failure. Recent reports by the World Health Organization (WHO) state that high blood pressure is the primary or secondary cause of
50% of all cardiovascular diseases worldwide,16 evidence of
high consumption of hypertensive drugs, such as enalapril. Nimesulide, a non-steroidal anti-inflammatory drug has
antipyretic and analgesic properties.17 Methyl parabens is a
preservative which is widely used in cosmetic products and pharmaceuticals due to its bactericidal and anti-fungicidal properties. It was also used in food and beverage
processing. It belongs to the esters of p-hydroxybenzoic
acid and may be an endocrine disruptor.18
PPCPs enter the aquatic environment mainly through treated (or raw) sewage from domestic households and hospitals, waste effluents from manufacturing processes and runoff. Another important reason why the drug residues reach natural surface waters is the insufficient removal of
these compounds at wastewater treatment plants.8,19
Due to the growing concern regarding the presence, fate and effects on the environment and humans, there is
need for fast and sensitive multi-residue methods for the
determination of levels of PPCPs in the environment.20
These compounds are found in water samples at a low
concentration,21 requiring sample preparation techniques
that enable the extraction and preconcentration of the analytes and sensitive determination techniques. The classical liquid-liquid extraction has been largely replaced in laboratories by solid-phase extraction (SPE). SPE has been employed for the extraction of PPCPs from waters,
but, because the extraction efficiency is compound
dependent and is affected by several variables, such as the type of the sorbent, sample pH, polarity of the elution
solvent and the elution volume, it needs to be optimized.22
Optimal conditions of extraction can be obtained by the classical method called one-variable-at-a-time, but statistical tools, such as the fractional experimental design, have been recognized to be effective mathematical statistical methods for the evaluation of the effect of the variables and have helped to determine optimal conditions
with desirable responses.23
Regarding determination techniques, liquid chromatography tandem mass spectrometry (LC-MS/MS) has become the analytical technique of choice for the determination of polar environmental pollutants due to its
selectivity and sensitivity.24,25 The number of works about
the determination of PPCPs in water samples has grown
in the world,8,22 and in Brazil, there have been few studies
which investigate the presence of these contaminants in
drinking and surface water.20,26-28 The aim of this study was
to optimize SPE for the determination of amitriptyline, glibenclamide, enalapril, haloperidol, methylparaben and nimesulide in water samples. In the SPE study, a screening of five parameter settings via a fractional factorial design was carried out to find the most significant parameters in the extraction of these compounds. The method was validated with the following parameters: linearity and linear range, limit of detection (LOD) and of quantification (LOQ), precision (intra-day and inter-day), accuracy (recovery), matrix effect and process efficiency. After optimization and validation, the multiresidue method, which uses SPE and LC-MS/MS, was applied to verify the presence of PPCPs in surface and drinking water samples collected in the South region of Brazil.
To the best of our knowledge, in this region, the analysis of the selected PPCPs had never been carried out. Besides, this study emphasizes the importance of the determination of PPCPs in water samples since few countries have included the maximum residue limits (MRL) for these contaminants in their legislation. In Brazil, Law
No. 2914 from December 12th, 2011, which deals with the
monitoring of water quality for human consumption and
its potability standards, does not include MRL for PPCPs.29
Experimental
Reagents and chemicals
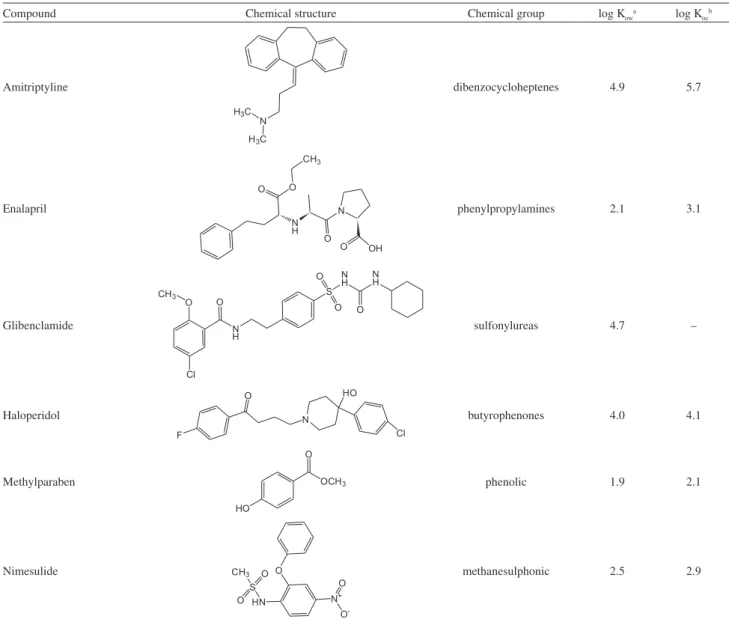
High purity (> 99%) analytical standards of amitriptyline (antidepressant), enalapril (antihypertensive and diuretic), glibenclamide (hypoglicemiant and antidiabetic), haloperidol (antipsychotic), methylparaben (preservative) and nimesulide (anti-inflammatory) were provided by Fiocruz (Fundação Oswaldo Cruz, Rio de Janeiro, RJ, Brazil). The chemical structure and physicochemical properties of the compounds under analysis are shown in Table 1.
Individual standard solutions were prepared in methanol
at the concentration of 1000 µg mL−1. The working standard
solutions were prepared at 100 µg mL−1 by mixing the
appropriate amounts of individual standard solutions and by diluting them with methanol. All solutions were
preserved at −18 ºC. All solvents were of HPLC grade,
manufactured by Mallinckrodt (Phillipsburg, NJ, USA) and all the other reagents were of analytical grade. Ultrapure
water was obtained by Direct Q UV3® water purification
system (Millipore, Bedford, MA, USA). SPE extraction
tubes were Chromabond C18 EC (octadecyl modified
silica phase) (Macherey-Nagel, Düren, Germany) and Strata-X (copolymer of styrene divinylbenzene with modified surface, with an average particle size of 33 µm) Phenomenex (Torrance, CA, USA).
Table 1. Chemical structure and physicochemical properties of PPCPs30,31
Compound Chemical structure Chemical group log Kowa log Kocb
Amitriptyline dibenzocycloheptenes 4.9 5.7
Enalapril phenylpropylamines 2.1 3.1
Glibenclamide sulfonylureas 4.7 –
Haloperidol butyrophenones 4.0 4.1
Methylparaben phenolic 1.9 2.1
Nimesulide methanesulphonic 2.5 2.9
alog K
Instrument
Analyses were performed by a Waters Alliance 2695 Separations Module HPLC, equipped with a quaternary pump, an automatic injector and a thermostatted column compartment (Waters, Milford, MA, USA). The chromatographic separation was performed by a
Waters XTerra® MS C
18 (3.0 × 50 mm i.d., 3.5 µm film
thickness) column (Milford, MA, USA). The mobile phase components were (A) ultra-pure water with 0.01% formic acid (HCOOH) and (B) pure methanol, with elution in gradient mode at a scheduled flow, resulting in a 10 min run time. The injection volume was 10 µL.
A Micromass Quattro micro API (triple quadrupole) mass spectrometer equipped with a Z-spray electrospray (ESI) ionization source was used. Drying gas, as well as nebulizing gas, was nitrogen generated from pressurized air in a NG-7 nitrogen generator (Aquilo, Etten-Leur, NL).
The nebulizing gas flow was set to 50 L h-1 and the gas flow
desolvation to 550 L h-1. For operation in the MS-MS mode,
collision gas was Argon 5.0 (White Martins, Rio de Janeiro,
Brazil) with pressure of 3.5 × 10⁻³ mbar in the collision
cell. The optimized values were: capillary voltages, 4.5 kV; extractor voltage, 2 V; source temperature, 100 ºC; desolvation temperature, 400 ºC; and multiplier, 650 V.
The optimization of the MS-MS conditions, the choice of the ionization mode, the identification of the precursor/ parent and product ions and the selection of the cone and collision voltages, favorable factors for the analysis of the target analytes, were performed by direct infusion of
each standard solution in the concentration of 1 µg mL-1.
Analytical instrument control, data acquisition and treatment were performed by software MassLynx, version 4.1 (Micromass, Manchester, UK). After the optimization of the collision cell energy of the triple quadrupole, two different transitions (precursor ion-product ion) were selected for each compound, one for quantification and one for qualification, and these ions were monitored in time-scheduled multiple reaction monitoring (MRM) conditions.
Screening of the SPE variables
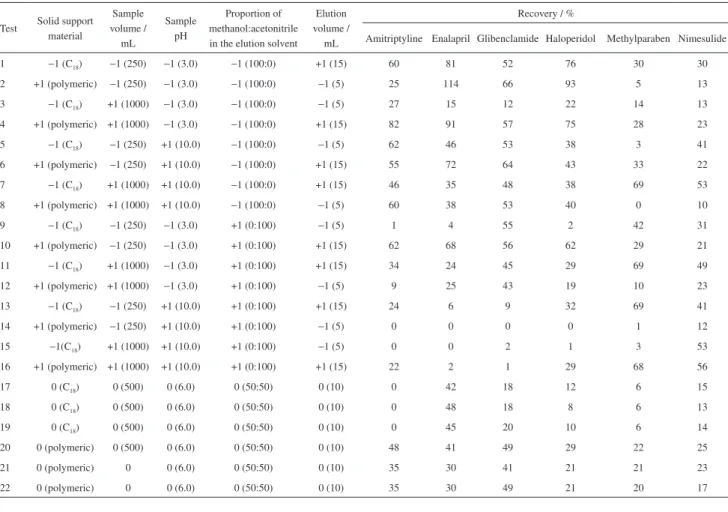
The influence of important SPE variables such as sample volume (250 to 1000 mL), sample pH (3 to 10), proportion of methanol:acetonitrile in the elution solvent (0 to 100%), solid support type (polymeric or C18) and elution volume (5 to 15 mL) were evaluated at two levels, according to
Table 2, using a 2v
5-1 fractional factorial design, with 16
treatments and 6 central points, generating 22 experiments. The variations of experiment were evaluated using the central points. The main effects of each parameter on the
extraction recovery were evaluated with 90% of confidence level. After choosing the extraction conditions from of effect analysis, an experiment to evaluate the influence of the acidification and alkalization of the eluting solvent
was carried out. Pure methanol, methanol with 0.5% (v v-1)
formic acid and methanol with 5% (v v-1) ammonium
hydroxide (NH4OH) were investigated in this step.
Sample preparation
The samples were pre-concentrated and extracted by SPE tubes containing 200 mg polymeric sorbent (Strata-X). Volumes of 250 mL drinking water samples at pH 3.0, acidified by the addition of phosphoric acid, were fortified by adding an established volume of stock solution of the mixture of PPCPs under study. Before sample application, the SPE column was conditioned by passing consecutively through 3 mL methanol, 3 mL purified water and 3 mL purified water acidified (pH 3.0) with phosphoric acid 1:1
(v v-1). The samples were well mixed and passed through the
SPE tubes at 3 mL min-1. After that, the tubes were eluted
with 5 mL of 5% formic acid in methanol. The resulting methanol extracts were directly analyzed by LC-MS/MS.
Recovery, process efficiency and matrix effect assessment
The matrix effect evaluation was carried out according
to Matuszewski et al.32 The method quantitatively assesses
matrix effects by comparing the response of an analyte in neat solution with the response of the analyte spiked into a blank matrix sample that has been submitted to the sample preparation process. In this way, quantitative effects on ion suppression or enhancement experienced by all analytes in the sample can be measured.
(1)
(2)
(3)
Limits of quantification and of detection, linearity and precision
LOD was defined as the lowest concentration of the analytical process that could reliably differentiate a signal-to-noise ratio value. LOD and LOQ of the method for each analyte were obtained considering 3 and 10 times the ratio of signal to baseline (noise), respectively. LOQ was established as the lowest concentration level that was fully validated (based on a solution which contains the mix of pharmaceuticals and personal care products standards). The lowest concentration in each compound was evaluated and could be detected and quantified with reliability.
The analytical curves and the linearity of the detector response for the test compounds were evaluated by
injecting, in triplicate, at least five concentration values of the standard solutions prepared in methanol and analyzed by using a least-square regression. Satisfactory linearity was assumed when the determination coefficient (r) was higher than 0.99 for all compounds.
Precision (relative standard deviation, RSD) was evaluated by analyzing drinking water samples spiked at five concentration levels, at least, including LOQ and the highest level of the analytical curve. All experiments were
performed in triplicate and injected three times (n = 9).
Statistical analysis
For the statistical analysis performed in the fractional factorial design, at a 90% level of confidence, a Statistica 8.0 Portable software was used.
The other statistical calculations, such as the one-way analysis of variance (ANOVA), were performed by GraphPad InStat (GraphPad InStat Software Inc., version 3.00, 1997) software. The differences among the groups were compared by one way analysis of variance and a Tukey’s test was applied. For the ANOVA analyses, a
Table 2. 2v5-1 Experimental matrix of fractional factorial design and recovery responses
Test Solid support material
Sample volume /
mL
Sample pH
Proportion of methanol:acetonitrile in the elution solvent
Elution volume / mL
Recovery / %
Amitriptyline Enalapril Glibenclamide Haloperidol Methylparaben Nimesulide
1 −1 (C18) −1 (250) −1 (3.0) −1 (100:0) +1 (15) 60 81 52 76 30 30
2 +1 (polymeric) −1 (250) −1 (3.0) −1 (100:0) −1 (5) 25 114 66 93 5 13
3 −1 (C18) +1 (1000) −1 (3.0) −1 (100:0) −1 (5) 27 15 12 22 14 13
4 +1 (polymeric) +1 (1000) −1 (3.0) −1 (100:0) +1 (15) 82 91 57 75 28 23
5 −1 (C18) −1 (250) +1 (10.0) −1 (100:0) −1 (5) 62 46 53 38 3 41
6 +1 (polymeric) −1 (250) +1 (10.0) −1 (100:0) +1 (15) 55 72 64 43 33 22
7 −1 (C18) +1 (1000) +1 (10.0) −1 (100:0) +1 (15) 46 35 48 38 69 53
8 +1 (polymeric) +1 (1000) +1 (10.0) −1 (100:0) −1 (5) 60 38 53 40 0 10
9 −1 (C18) −1 (250) −1 (3.0) +1 (0:100) −1 (5) 1 4 55 2 42 31
10 +1 (polymeric) −1 (250) −1 (3.0) +1 (0:100) +1 (15) 62 68 56 62 29 21
11 −1 (C18) +1 (1000) −1 (3.0) +1 (0:100) +1 (15) 34 24 45 29 69 49
12 +1 (polymeric) +1 (1000) −1 (3.0) +1 (0:100) −1 (5) 9 25 43 19 10 23
13 −1 (C18) −1 (250) +1 (10.0) +1 (0:100) +1 (15) 24 6 9 32 69 41
14 +1 (polymeric) −1 (250) +1 (10.0) +1 (0:100) −1 (5) 0 0 0 0 1 12
15 −1(C18) +1 (1000) +1 (10.0) +1 (0:100) −1 (5) 0 0 2 1 3 53
16 +1 (polymeric) +1 (1000) +1 (10.0) +1 (0:100) +1 (15) 22 2 1 29 68 56
17 0 (C18) 0 (500) 0 (6.0) 0 (50:50) 0 (10) 0 42 18 12 6 15
18 0 (C18) 0 (500) 0 (6.0) 0 (50:50) 0 (10) 0 48 18 8 6 13
19 0 (C18) 0 (500) 0 (6.0) 0 (50:50) 0 (10) 0 45 20 10 6 14
20 0 (polymeric) 0 (500) 0 (6.0) 0 (50:50) 0 (10) 48 41 49 29 22 25
21 0 (polymeric) 0 0 (6.0) 0 (50:50) 0 (10) 35 30 41 21 21 23
95% significance level was adopted for all comparisons (p < 0.05).
Environmental sample analysis
After optimization and validation, the method was applied to real samples to evaluate its applicability.
Samples were collected in two different cities in the South of Brazil, where basic sanitation does not reach half of the population.
Sampling was carried out monthly at Corsan Reservatory, the water treatment station in Rio Grande and Morro Redondo cities, from November 2011 to January 2012. Two different samples were collected: a surface water sample, collected at the entrance of the treatment station and a drinking water sample, collected after the water treatment, in the output of the station.
Results and Discussion
LC-MS/MS optimization parameters
Considering the compounds under study, amitriptyline, enalapril, glibenclamide and haloperidol showed
preferential ionization in the positive mode [M + H]+,
whereas methylparaben and nimesulide showed more
efficient ionization in the negative mode [M − H]−. The
results of the LC-MS/MS optimization are shown in Table 3.
Solid-phase extraction
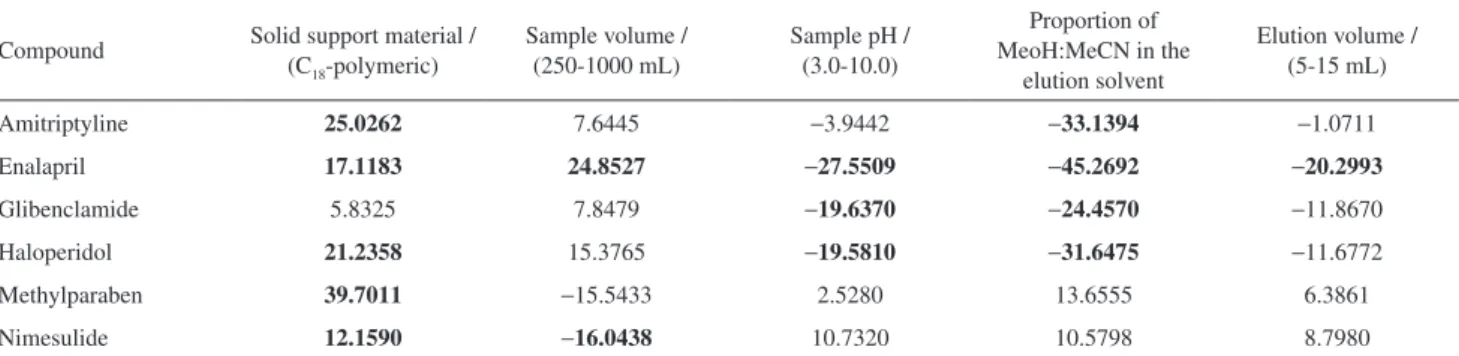
The application of the fractional factorial design enabled to evaluate the effects of five parameters on the extraction of the analytes under study to be known. The results are shown in Table 4. The highlighted parameters are
statistically significant (p < 0.10) at 90% confidence level.
The fractional factorial design employed in this study was used as a tool which aimed at knowing the behavior of
each compound in relation to the parameters which affect SPE extraction recoveries.
The same parameters showed different effects on each compound. The extraction recovery of the compound
amitriptyline, which is a weak organic base33 with nonpolar
characteristics, was significantly affected by the solid support material and the proportion of methanol in the eluting solvent. The increase in the proportion of methanol
in the elution solvent (−1 to +1) led to a decrease in the
extraction recovery. Furthermore, the polymeric solid support showed a positive effect (25%) in the extraction, confirming the fact that a polymeric sorbent material is
suitable for compounds which have different polarities.34
For enalapril, an acid compound, the response, in terms of extraction recovery, was affected by all parameters. An increase in the extraction recovery was observed when the volume of the sample increased and when the polymeric solid support was used, whereas high pH, high concentration of methanol in the elution solvent and high volume of elution solvent led to a decrease in the extraction recovery. During the development of a multi-residue method for the
Table 4. The effects of the variables on the extraction of the compounds under study
Compound Solid support material / (C18-polymeric)
Sample volume / (250-1000 mL)
Sample pH / (3.0-10.0)
Proportion of MeoH:MeCN in the
elution solvent
Elution volume / (5-15 mL)
Amitriptyline 25.0262 7.6445 −3.9442 −33.1394 −1.0711
Enalapril 17.1183 24.8527 −27.5509 −45.2692 −20.2993
Glibenclamide 5.8325 7.8479 −19.6370 −24.4570 −11.8670
Haloperidol 21.2358 15.3765 −19.5810 −31.6475 −11.6772
Methylparaben 39.7011 −15.5433 2.5280 13.6555 6.3861
Nimesulide 12.1590 −16.0438 10.7320 10.5798 8.7980
Table 3. Results of the optimized parameters for the compounds analyzed by LC-ESI-MS/MS (Dwell time: 0.3 s)
Compound Transition /
m/z
Collision energy / eV
Cone
voltage / V tR / min
Amitriptyline 278.3 > 104.9b 15 35 4.13
278.3 > 233.3 15 35
Enalapril 377.2 > 117.1b 58 45 4.01
377.2 > 234.2 24 45
Glibenclamide 494 > 169b 38 30 4.79
494 > 369 18 30
Haloperidol 376 > 165b 25 35 4.01
376 > 123 25 35
Methyilparabena 151 > 91.6b 20 35 4.11
151 > 135.9 15 35
Nimesulidea 307 > 229b 20 33 4.57
307 > 198.1 30 15
aElectrospray ionization source in negative mode; btransitions used for
determination of 25 acidic/neutral pharmaceuticals and personal care products in surface water, it was used an acid pH, indicating that the acid pH of the solution is required in order to ionize basic compounds and neutralize acidic
compounds.19 In some cases, the sample pH adjustment
is necessary to stabilize and increase their retention in
the solid phase.34 In other study, it was concluded that,
since enalapril is an acidic compound, the sample pH is a key factor for extraction. The optimal pH value to extract
enalapril in that study was 3.35
Glibenclamide is highly nonpolar36and a weak acid
(pKa equal to 5.3).
37The results showed that the response in
terms of extraction recovery was affected by the pH and the proportion of methanol in the elution solvent. An increase in the sample pH and in the proportion of methanol in the solvent leads to a decrease in the recoveries.
The sample pH, proportion of methanol in the elution solvent and the solid support material of the variables showed effect on the extraction recoveries of haloperidol. An increase in the pH and the use of a polymeric solid support material led to high recoveries, whereas the increase in the proportion of methanol in the elution solvent showed
a reduction (−31.6%) in the extraction recovery.
Nimesulide is a weak acid38 and its extraction recoveries
were affected by the sample volume and the solid support material. An increase in the sample volume reduced the extraction recovery, while the polymeric solid support material showed an increase in the extraction recovery.
As shown in Table 4, the polymeric solid support showed a positive effect for most compounds, in agreement
with other studies.20,39,40 The choice of sorbent is a key
point in the solid-phase extraction because it can affect the performance of the method, such as selectivity,
affinity and capacity.41 The compounds in this study have
different physicochemical properties, varying from acidic to basic and from high to low polarity. It makes the choice of the most appropriate SPE sorbent more difficult. The Strata-X SPE cartridge has a surface-modified styrene skeleton with a pyrrolidone group, whose retention mechanisms are hydrophobic, hydrogen-bonding and aromatic. This sorbent is used for the reversed-phase
extraction of acidic, basic and neutral compounds.41
The sample volume was shown to be an important variable because it is percolated through the solid phase without loss of analytes and the appropriate volume is a factor that may lead to the loss of compounds due
to leaching of the sample solvent itself.42 In thisstudy,
the volume of the sample showed different effects on nimesulide and enalapril. A positive effect for enalapril and a negative effect for nimesulide were found while, for other compounds, the effect was not significant. Therefore, to
avoid losses of analyte at the time of extraction, 250 mL were selected as the sample volume.
The pH of the sample proved to be an important variable for all compounds and showed different responses. The negative effect on glibenclamide, enalapril and haloperidol
is in agreement with Gracia-Lor et al.,21 who show that the
compounds of different polarities are significantly affected by the pH of the sample.
The evaluation of the methanol:acetonitrile proportion in the elution solvent showed the advantages of methanol, whereas a negative effect was obtained for most compounds when acetonitrile was used. Since methanol seems to be an efficient solvent for the elution of polar contaminants from different SPE cartridges, it was chosen for elution when
the SPE process was evaluated.21
Regarding the parameter that investigates the optimal volume of the elution solvent, a response with a negative effect for the drug amytriptiline was obtained. Other compounds also showed the same trend.
After the screening of the effect of each variable in SPE, some parameters were fixed, trying to use a condition that showed good recoveries for most of the compounds. Therefore, polymeric solid support, 250 mL sample volume, pH 3 for the sample, 5 mL eluting solvent volume and pure methanol were used in the next experiments.
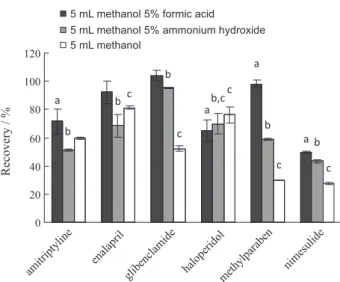
Some studies8,20,43-46 report the use of modifiers in
the elution solvent. Thus, an experiment to assess the influence of the acidification and/or alkalization of the eluting solvent in the recoveries of the compounds was carried out (Figure 1). Three treatments were compared and investigated individually for each compound: 5 mL methanol with 5% formic acid, 5 mL methanol with 5% ammonium hydroxide and 5 mL methanol. Results show that the most appropriate elution solvent for the extraction of most compounds was methanol with 5% formic acid since 4 compounds (amitriptyline, enalapryl, glibenclamide and methylparaben) reached extraction recoveries between 70 and 120%. The results were analyzed by ANOVA (Tukey’s test) in order to establish whether there is significant difference among the means and factors that influence the dependent variable. Figure 1 shows the results of the recovery of each compound and the results of the analysis of variance complemented by the Tukey’s test. Results showed highly significant differences among
the solvents that were used (p < 0.05), indicating that the
has more affinity with the most alkaline pH of solvents. For the simultaneous extraction of all compounds, 5 mL methanol with 5% formic acid was selected as the solvent for elution.
Limits of detection and quantification, analytical curves and linearity
With SPE, the method pre-concentration factor was 50 times, which enabled LODs and LOQs of the method
in water samples to reach µg L-1 levels. The LOQ values
ranged from 0.05 to 1.0 µg L-1.
For the evaluation of the linear range, matrix-matching calibration curves were made. The curves were generated
by linear regression analysis and fitted well (r2 > 0.99).
Depending on the characteristics of each compound, calibration levels responded in different concentration ranges, showing good results. The linear dynamic range
varied from 0.25 to 2.5 µg L-1 for amitriptyline, 0.2 to
5.0 µg L-1 for enalapril, 0.1 to 2.5 µg L-1 for glibenclamide and
haloperidol, 1.0 to 25 µg L-1 for methylparaben and 0.05 to
0.5 µg L-1 for nimesulide. Data are summarized in Table 5.
Accuracy and precision
To examine the accuracy and precision of the method, the curves prepared in set 3 of samples were used for calculations of recoveries (R in %) and RSD. Each level of the curve was prepared in triplicate and the extracts were injected into the chromatographic system in triplicate (n = 9). The results shown in Table 6 indicate that the method provided acceptable recoveries (65-120%). Precision was
evaluated in terms of intra-day (RSD) and RSDs were lower than 20%, demonstrating good precision since values up to 20% are accepted. The inter-day precision was evaluated on LOQ and 5LOQ levels. RSDs were lower than 17%.
Evaluation of the matrix effect
One of the limitations of the LC-MS is the susceptibility
of API interfaces to co-extracted matrix components.43,47
Table 5. Limits of detection (LOD) and of quantification (LOQ), linearity and correlation coefficient
Compound LOD /
(µg L-1)
LOQ / (µg L-1)
Linear range / (µg L-1)
Correlation coefficient (r)
Amitriptyline 0.07 0.25 0.25-2.5 0.999
Enalapril 0.05 0.2 0.2-5.0 0.996
Glibenclamide 0.02 0.1 0.1-2.5 0.999
Haloperidol 0.02 0.1 0.1-2.5 0.996
Methylparaben 0.2 1.0 1.0-25 0.994
Nimesulide 0.01 0.05 0.05-0.5 0.992
Figure 1. Recoveries with different modifiers in the elution solvent. Error bars represent relative standard deviation values. Different letters represent means that differ significantly among the solvents for each compound according to the Tukey’s test (p < 0.05).
Table 6. Recoveries, intra-day and inter-day precisions RSD (relative standard deviation) (n = 9)
Compound Spike level / (µg L-1)
Recovery / %
Intra-day RSD / %
Recovery / %
This matrix effect, defined as the effect of co-eluting residual matrix components on the ionization of the target analyte, typically results in either signal suppression or enhancement. Moreover, interfering matrix components can affect the reproducibility and the accuracy of the procedure under development, leading to biased or
erroneous results.47,48
The method that is generally proposed to compensate the matrix effect is the use of a stable isotopically labeled internal standard which elutes at the same time as the compound does. It is also advisable to use one for each individual compound. In the case of multiresidue methods, such as an environmental analysis, the use of an isotopically labeled internal standard for each compound is difficult and expensive. Therefore, in this study, the matrix-matching calibration was chosen.
I n a g r e e m e n t w i t h t h e s t r a t eg y a p p l i e d b y
Matuszewski et al.,32 matrix effects were evaluated by
comparing the PPCP MS/MS responses of standards prepared in methanol (A) with those measured in a blank water extract spiked with the same analyte amount after extraction (B). Differences observed in the MS/MS response could thus be attributed to the effect of the sample matrix on the ionization efficiency. The ratio (B/A × 100) is defined as the absolute matrix effect (ME).
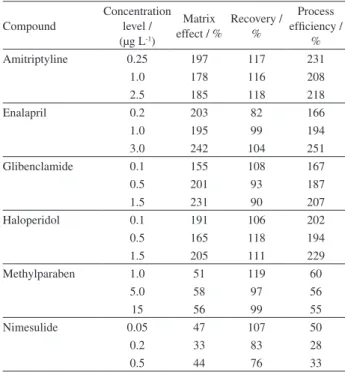
The results of the evaluation of the matrix effect are shown in Table 7. High signal enrichment was observed for methylparaben and nimesulide, and, for the other compounds, suppression was observed.
Process efficiency
Process efficiency is the overall performance characteristic of the method. PE values near 100% generally indicate that both ME and R are near 100% (equation 3).
The ME values often markedly differ from 100%, leading to significant differences between R and PE. It means that these two quantities cannot be used interchangeably. Pre-extraction addition results must be compared to post-extraction addition ones in order to determine recovery. High process efficiency can be observed for most analytes in Table 7. It can be explained due to the high matrix effect that was observed. PE near 100% was found for any compound due to the fact that
all compounds had high or medium matrix effect.49The
results of PE are summarized in Table 7. Comparing PE, it can be seen that only two compounds showed PE less than 60%, whereas the other compounds showed levels well above 100%. In some cases, the enrichment signal can increase the efficiency of the process considerably, such as amitriptyline, enalapril, haloperidol and glibenclamide.
Nimesulide showed low PE (28%) due to its low recovery. However, a significant suppression signal may cause the low efficiency of the process, despite the high recovery, as shown for methylparaben.
Environmental sample analysis
Although the number of works about the determination of PPCPs in water samples has grown in the world, more knowledge about the levels of these compounds in surface and drinking waters is required. In fact, there have been few studies which investigate the presence of these contaminants in drinking and surface water in Brazil.
During the method application, three different classes of compounds were detected in the surface water collected in Rio Grande.
Haloperidol was found in concentrations around
0.1 µg L-1, while methylparaben was detected in
concentrations between 7.6 and 29.8 µg L-1 and nimesulide
in concentration of 0.05 µg L-1.
In the water samples collected in Morro Redondo, only methylparaben was detected. In drinking water, the concentration levels were always lower than LOQ, whereas in surface water, the concentration levels ranged from LOQ
up to 134 µg L-1.
Haloperidol belongs to the butyrophenone series of tranquilizers. It is the most commonly compound used as antipsychotic drug to treat patients with chronic
Table 7. Matrix effect, recoveries and process efficiency of the compounds in three levels of concentration
Compound
Concentration level / (µg L-1)
Matrix effect / %
Recovery / %
Process efficiency /
%
Amitriptyline 0.25 197 117 231
1.0 178 116 208
2.5 185 118 218
Enalapril 0.2 203 82 166
1.0 195 99 194
3.0 242 104 251
Glibenclamide 0.1 155 108 167
0.5 201 93 187
1.5 231 90 207
Haloperidol 0.1 191 106 202
0.5 165 118 194
1.5 205 111 229
Methylparaben 1.0 51 119 60
5.0 58 97 56
15 56 99 55
Nimesulide 0.05 47 107 50
0.2 33 83 28
schizophrenia and is also effective in some cases of
autism.50Some treatments require its continued use and
studies have reported the presence of this contaminant in
the order of 30 ng L-1.19
Nimesulide is a relatively new drug, a non-steroidal anti-inflammatory with analgesic and antipyretic properties. In some places, such as Ireland, this compound was withdrawn from the market. However, 3% gel formulations
have been licensed for use.17 This compound was detected
in a study whose aim was to establish baseline levels of pharmaceuticals in three wastewater treatment plant streams in great Dublin. Nimesulide was detected in effluent streams at concentrations above the ones observed
in corresponding influent samples.17
Methylparabens is a hydroxybenzoic acid antimicrobial used as preservative in cosmetics. In the EUA and Brazil, 0.4% of each paraben and a maximum of 0.8% of total parabens are allowed in cosmetic products. In Japan, a maximum of 1% paraben is allowed. Many of the products, used as preservatives in cosmetics, are possible endocrine disruptors. Methylparaben was detected in a previous study carried out in Morro Redondo. During ten sampling campaigns, methylparaben was detected in concentrations
lower than LOQ.28 In surface water samples in Spain,
methylparaben was detected from 6 to 208 ng L-1,18 and,
in another study, methylparaben was the most frequently detected compound in wastewater samples. It was detected in 100% of the samples, and in average concentrations of
4200 ng L-1 in raw and 25 ng L-1 in treated wastewater. The
detections were attributed to a reflection of its ubiquitous
presence in cosmetic formulations.51
A chromatogram with the chromatographic profile of methylparaben in the surface extract and in a positive surface sample is shown in Figure 2.
Conclusions
The results of this study indicate that the method which uses SPE and LC-MS/MS for the determination of amitriptyline, enalapril, glibenclamide, haloperidol, methylparaben and nimesulide in samples of drinking and surface waters is efficient, precise and accurate. In the development of the method, a fractional factorial design was applied and the effect of five key parameters on the extraction of the compounds was assessed.
Strata-X was chosen as the solid support material, sample pH was adjusted to 3.0 and elution was performed with 5 mL methanol with 5% formic acid. The chromatographic conditions optimized for the determination by LC-MS/MS enabled the identification and quantification of PPCPs which were studied in a 10 min run time.
The results of the method validation were adequate. The analytical curves showed r values higher than 0.99 for the concentration ranges required for the applications. The recovery values in different spiked levels ranged between 65 and 120%, with RSD below 20%. The limits
of detection ranged from 0.01 to 0.2 µg L-1 and the limits
of quantification from 0.05 to 1.0 µg L-1. The method can
be used for monitoring PPCPs in drinking and surface waters. However, quantification should be carried out with the analytical standards prepared in the blank matrix extract.
Results of the method application showed that some compounds used in everyday life have been reaching surface waters in the South of Brazil. Since methylparaben was detected, its presence may indicate that the water sources have been affected by domestic sewage.
Acknowledgments
The authors acknowledge the financial support and fellowships granted by the Brazilian agencies FINEP, CAPES, CNPq, CORSAN and FURG. Part of this study was supported by a grant from the Brazilian Agency FAPERGS/PROCOREDES (process No. 0905342). E.G. Primel received a productivity research fellowship from the Brazilian Agency CNPq (DT 310517/2012-5).
References
1. Daughton, C. G.; Ternes, T. A.; Environ. Health Perspect. 1999,
107, 907.
2. Fent, K.; Weston, A. A.; Caminada, D.; Aquat. Toxicol. 2006,
78, 207.
3. Carlsson, C.; Johansson, A. K.; Alvan, G.; Bergman, K.; Kühler, T.; Sci. Total Environ. 2006, 364, 88.
4. Yu, Y.; Huang, Q.; Wang, Z.; Zhang, K.; Tang, C.; Cui, J.; Feng, J.; Peng, X.; J. Environ. Monit. 2011, 13, 871.
5. Qiao, T.; Yu, Z.; Zhang, X.; Au, D. W. T.; J. Environ. Monit.
2011, 13, 3097.
6. Kasprzyk-Hordern, B.; Dinsdale, R. M.; Guwy, A. J.; Water Res. 2009, 43, 363.
7. Kotchen, M.; Kallaos, J.; Wheeler, K.; Wong, C.; Zahller, M.;
J. Environ. Manage. 2009, 90, 1476.
8. Baker, D. R.; Kasprzyk-Hordern, B.; J. Chromatogr., A 2011,
1218, 1620.
9. http://www.saicm.org, accessed in April 2013.
10. DeLorenzo, M. E.; Fleming, J.; Arch. Environ. Contam. Toxicol.
2008, 54, 203.
11. Schnell, S.; Bols, N. C.; Barata, C.; Porte, C.; Aquat. Toxicol.
2009, 93, 244.
12. Reemtsma, T.; TrAC, Trends Anal. Chem. 2001, 20, 533. 13. Calisto, V.; Esteves, V. I.; Chemosphere 2009, 77, 1257. 14. Li, N.; Deng, Y.; Wang, D.; Qiao, Y.; Li, F.; Talanta 2013, 104,
109.
15. Yasui-Furukori, N.; Inoue, Y.; Chiba, M.; Tateishi, T.;
J. Chromatogr., B: Anal. Technol. Biomed. Life Sci. 2004, 805, 175.
16. El Azizi, G. B.; Ahid, S.; Ghanname, I.; Belaiche, A.; Hassar, M.; Cherrah, Y.; Pharmacoepidem. Dr. S. 2012, 21, 1067. 17. Lacey, C.; Basha, S.; Morrissey, A.; Tobin, J. M.; Environ.
Monitor. Assess. 2012, 184, 1049.
18. Gracia-Lor, E.; Martínez, M.; Sancho, J. V.; Peñuela, G.; Hernández, F.; Talanta 2012, 99, 1011.
19. Kasprzyk-Hordern, B.; Dinsdale, R. M.; Guwy, A. J.; Talanta
2008, 74, 1299.
20. Cardoso, L. V.; Tomasini, D.; Sampaio, M. R. F.; Caldas, S. S.; Kleemann, N.; Primel, E. G.; Gonçalves, F. F.; J. Braz. Chem. Soc. 2011, 22, 1944.
21. Gracia-Lor, E.; Sancho, J. V.; Hernández, F.; J. Chromatogr., A
2010, 1217, 622.
22. Varga, R.; Somogyvári, I.; Eke, Z.; Torkos, K.; Talanta 2011,
83, 1447.
23. Pinzauti, S.; Gratteri, P.; Furlanetto, S.; Mura, P.; Dreassi, E.; Phan-Tan-Luu, R.; J. Pharm. Biomed. Anal. 1996, 14, 881. 24. Kostopoulou, M.; Nikolaou, A.; TrAC, Trends Anal. Chem.
2008, 27, 1023.
25. Wu, J.; Qian, X.; Yang, Z.; Zhang, L.; J. Chromatogr., A 2010,
1217, 1471.
26. Locatelli, M. A. F.; Sodré, F. F.; Jardim, W. F.; Arch. Environ. Contam. Toxicol. 2011, 60, 385.
27. Montagner, C. C.; Jardim, W. F.; J. Braz. Chem. Soc. 2011, 22, 1452.
28. Caldas, S.; Bolzan, C.; Guilherme, J.; Silveira, M.; Escarrone, A.; Primel, E.; Environ. Sci. Pollut. Res. Int. 2013, 20, 5855 29. Ministério da Saúde; Portaria No. 2.914, Dispõe sobre os
Procedimentos de Controle e de Vigilância da Qualidade da
Água para Consumo Humano e seu Padrão de Potabilidade,
de 25 de março de 2004, publicada no Diário Oficial da União, Seção 1, do dia 26 seguinte, Brasil, p. 266 http://bvsms.saude. gov.br/bvs/saudelegis/gm/2011/prt2914_12_12_2011.html, acessed in January 2013.
30. http://www.chemspider.com, accessed in January 2013. 31. http://www.drugbank.ca/, accessed in January 2013.
32. Matuszewski, B.; Constanzer, M.; Chavez-Eng, C.; Anal. Chem.
2003, 75, 3019.
33. Jasińska, A.; Starczewska, B.; J. Pharm. Biomed. Anal. 2003,
31, 795.
34. Caldas, S. S.; Gonçalves, F. F.; Primel, E. G.; Prestes, O. D.; Martins, M. L.; Zanella, R.; Quim. Nova 2011, 34, 1604. 35. Gu, Q.; Chen, X.; Zhong, D.; Wang, Y.; J. Chromatogr., B: Anal.
Technol. Biomed. Life Sci. 2004, 813, 337.
36. Georgita, C.; Albu, F.; David, V.; Medvedovici, A.;
J. Chromatogr., B: Anal. Technol. Biomed. Life Sci. 2007, 854, 211.
37. Nery, C. G. C.; Pires, M. A. S.; Pianetti, G. A.; Vianna-Soares, C. D.; Rev. Bras. Cienc. Farm. 2008, 44, 61.
38. Ruela, A. L. M.; Araújo, M. B.; Pereira, G. R.; Quim. Nova
2009, 32, 165.
39. Lacey, C.; McMahon, G.; Bones, J.; Barron, L.; Morrissey, A.; Tobin, J.; Talanta 2008, 75, 1089.
40. Shao, B.; Chen, D.; Zhang, J.; Wu, Y.; Sun, C.; J. Chromatogr., A
2009, 1216, 8312.
41. Babić, S.; Pavlović, D. M.; Ašperger, D.; Periša, M.; Zrnčić, M.; Horvat, A. J. M.; Kaštelan-Macan, M.; Anal. Bioanal. Chem.
2010, 398, 1185.
42. Fritz, J. S.; Macka, M.; J. Chromatogr., A 2000, 902, 137. 43. Buhrman, D. L.; Price, P. I.; Rudewicz, P. J.; J. Am. Soc. Mass.
Spectrom. 1996, 7, 1099.
44. Balakrishnan, V. K.; Terry, K. A.; Toito, J.; J. Chromatogr., A
2006, 1131, 1.
45. Wick, A.; Fink, G.; Ternes, T. A.; J. Chromatogr., A 2010, 1217, 2088.
46. Wille, K.; Noppe, H.; Verheyden, K.; Vanden Bussche, J.; De Wulf, E.; Van Caeter, P.; Janssen, C. R.; De Brabander, H. F.; Vanhaecke, L.; Anal. Bioanal. Chem. 2010, 397, 1797. 47. King, R.; Bonfiglio, R.; Fernandez-Metzler, C.; Miller-Stein, C.;
Olah, T.; J. Am. Soc. Mass Spectrom. 2000, 11, 942.
48. Mei, H.; Hsieh, Y.; Nardo, C.; Xu, X.; Wang, S.; Ng, K.; Korfmacher, W. A.; Rapid Commun. Mass Spectrom. 2002, 17, 97. 49. Kruve, A.; Kunnapas, A.; Herodes, K.; Leito, I.; J. Chromatogr., A
2008, 1187, 58.
50. Singh, S. S.; Sharma, K.; Anal. Chim. Acta 2005, 551, 159. 51. González-Mariño, I.; Quintana, J. B.; Rodríguez, I.; Cela, R.;
Water Res. 2011, 45, 6770.