Vol.47, n. 6 : pp. 837-841, November 2004
ISSN 1516-8913 Printed in Brazil
BRAZILIAN ARCHIVES OF
BIOLOGY AND TECHNOLOGY
A N I N T E R N A T I O N A L J O U R N A L
Colorimetric Determination of
αααα
and
ββββ
-cyclodextrins and
Studies on Optimization of CGTase Production from
B. firmus
Using Factorial Designs
Ilma Hiroko Higuti
1, Priscila Anunciação da Silva
2, Juliana Papp
2, Vivian Mayumi de
Eiróz Okiyama
2, Edicléia Alves de Andrade
2, Aluizio de Abreu Marcondes
3and Aguinaldo
José do Nascimento
2*1
Departamento de Patologia Básica; 2 Departamento de Bioquímica; 3 Departamento de Química; Setor de Ciências Biológicas; Universidade Federal do Paraná; Curitiba - PR - Brazil
ABSTRACT
Cyclodextrin glycosyltransferase (EC 2.4.1.19, CGTase) production from B. firmus, isolated from soil of Curitiba, PR, was optimized in shake flask using an experimental design approach. The CGTase was produced when the carbon source was starch and β-CD, but when simple sugars such as glucose, galactose, lactose, sucrose, and maltose were used, there was no enzyme production. CGTase production was the same with either organic nitrogen or inorganic nitrogen source. CGTase activity decreased 2-fold when incubation temperature was increased from 28 to 37 °C, and decreased 2.1- fold when the initial pH was lowered from 10.3 to 7.4. The colorimetric determinations of α- and β -CD were analyzed as a non-linear relationship and the equilibrium constant for α -CD/methyl orange and β-CD/phenolphthalein complexes were 7.69 x 10³ L/ mol and 2.33 x 10³ L/ mol, respectively.
Key words: Cyclodextrin glycosyltransferase, Bacillus firmus, cyclodextrins
*
Author for correspondence
INTRODUCTION
Cyclodextrin glycosyltranferase (CGTase EC 2.4.1.19) is a bacterial enzyme that converts starch and other 1,4-linked α-glucans to cyclodextrins (α, β and γ-CDs in varying proportions) (French, 1957; Thoma and Stewart, 1965). They have the ability to form inclusion complexes with organic and inorganic compounds, which have numerous applications in biotechnology, and in the food and pharmaceutical industries (Szejtli, 1986; Pszczola, 1988; Matioli,
selective was described by Lejeune et al. (1989). It involves the formation of an inclusion complex between the α-CD and methyl orange under conditions of low pH and low temperature.
The use of process optimization of various fermentation parameters has been made in attempt to obtain an optimal growth of bacteria and maximum CGTase synthesis (Jamuna et al., 1993; Gawande and Patkar, 1999; Stefanova et al., 1999). In previous works we studied the CGTase production with different sources and concentrations of industrial starch in a basal medium in order to optimize CGTase activity (Higuti et al., 2003b).
We have now analyzed the colorimetric determination of α- and β - CD as a non-linear relationship and studied the optimization of the CGTase production from B. firmus using a two-level factorial design.
MATERIAL AND METHODS
Microorganisms
The microorganism used was isolate number 31 of strains of alkalophilic CGTase-producing bacteria, identified as Bacillus firmus by morphological, physiological and biochemical tests (Higuti et al., 2003a). It was grown at 28 °C and 120 rpm for 24 h (New Brunswick rotary shaker). The sterilized control culture medium contained 2% soluble starch (corn starch Sigma), 0.5% peptone, 0.5% yeast extract, 0.02% MgSO4.7H2O, 0.1% K2HPO4,
pH 10.3. The cells were removed by centrifugation (4000 x g; 10 min), and the supernatant that contained the enzyme, substrates and products was used for further assays.
Enzyme assay
CGTase activity was assayed by the Lejeune et al. (1989) method slightly modified by Gawande and Patkar (1999). A 1.0 mL amount of 1% soluble starch prepared in 50 mmol/L phosphate buffer, pH 7.0, was added with 0.1 mL of properly diluted enzyme and incubated at 40 ºC for 10 min. Enzyme reaction was stopped by immediately cooling the tubes in chilled water followed by addition of 0.1 mL of 1.2 mol/L HCl. Then 2 mL of methyl orange solution (final concentration 0.035 mmol/L) was added to the reaction mixture and the tubes were
maintained at 15 ºC for 30 min. The absorbance was measured at 507 nm and its decrease in absorbance (with respect to a control tube without enzyme) was correlated with the amount of α-CD. One unit of enzyme was defined as the amount of enzyme that produced 1 micromol of α-CD per min under standard conditions.
Measurement of ββββ-CD
The concentration of β-CD was analyzed by the decrease in absorbance at 550 nm due to phenolphtalein-CD complex formation (Goel and Nene, 1995 and modifications reported by Matioli, 1997). To 0.2 mL of β-CD solution in 0.05 mmol/L Tris-HCl buffer, pH 8.0, 1.0 mL of the phenolphthalein working solution was added. The tube was mixed by vortexing and the absorbance was measured immediately. The working solution was prepared by diluting 2 mL of 3 mmol/L phenolphthalein in ethanol (stock solution) to 100 mL with 125 mmol/L Na2CO3/NaHCO3 buffer, pH 10.5.
Statistical analysis
The colorimetric determination of α- and β – cyclodextrins was based on molecular complexation of dyes that undergoes spontaneous decolorization. Thus, the absorbance difference was analysed to obtain information on the Kd of the reaction:
Dye (D) + CD ==== Complex (C)
Kd is given by [D] [CD]/ [C], where braquets denotes concentration of the indicated species. Since [Dt] = [D] + [C], and [CDt] = [CD] + [C], Kd can be written as:
Kd = {[Dt] – [C]} [CD] / [C]
Assuming that the δA is directly proportional to [C] and δAmax as the limiting δA under [CDt] >>[C], we can obtain the approximate equation:
δA = (δAmax) [ CDt] / (Kd + [CDt])
RESULTS AND DISCUSSION
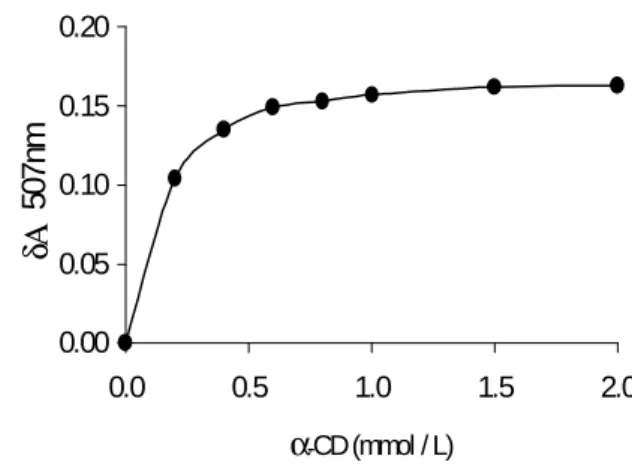
The colorimetric methods are suitable for determination of CD concentration and seldom require preliminary steps for the removal of acyclic carbohydrates (Makela et al., 1987). Deviation of linearity could be well explained by the theory of complex formation. Phenolphtalein-β-CD complex was only linear when correlated to β-CD concentration for up to 0.17 mmol/L (Goel and Nene, 1995). The formation of the inclusion complex causes a decrease in absorbance of the methyl orange solution that is only linearly correlated with the cyclomalto hexaose concentration in the range of 0.25 optical density unit and 0.30 mmol/L cyclomaltohexaose, with limited interference by linear oligosaccharides and other cyclodextrins (Lejeune et al., 1989). The enzyme CGTase hydrolyses starch to produce CDs as its main reaction products and the maltooligosaccharides present in the enzyme hydrolyzates do not interfere in the analysis of CDs by the phenolphtalein method (Goel and Nene, 1995). The experimental data were analyzed in the light of a non-linear relationship that can be easily used with the aid of a statistical package for computers (Figures 1 and 2). The equilibrium constant for α -CD and β-CD complexes were 7.69 x 10³ L/mol and 2.33 x 10³ L /mol, respectively. The original procedure of Vikmon (1981) for phenolphthalein assay for the determination of β - CD required minor modifications to assure reproducibility. This phenolphthalein assay was analyzed for the susceptibility to interferences by mono, oligosaccharides and mannitol (Table 1). Very little influence was observed in spite of their high concentrations.
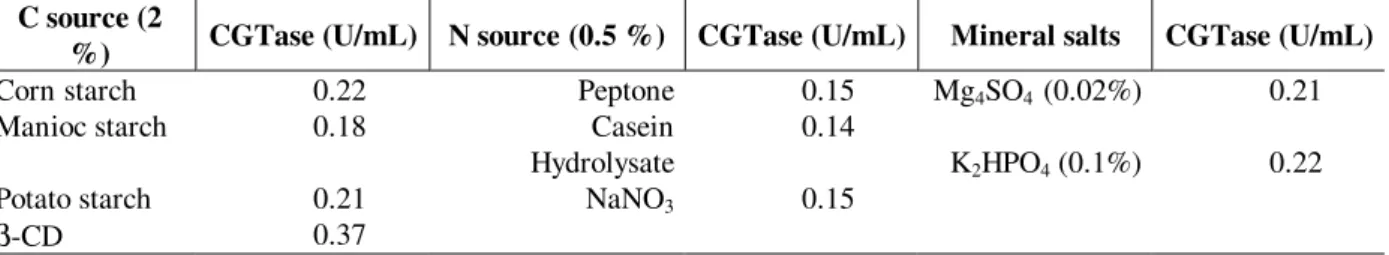
Studies on optimization of the CGTase production were performed in shake flasks using a 2k-1 statistical experimental design approach. The results are illustrated in Table 2. The CGTase was produced when the carbon source was starch and
β-CD, but when a small sugar such as glucose, galactose, lactose, sucrose, and maltose were used there was no enzyme production. Very little differences were observed with different starch sources. CGTase was not produced by B. firmus
when simple sugars were used as carbon source. Simple sugars favoured CGTase synthesis by B. cereus (Jamuna et al. 1993) but not by K. pneumoniae (Gawand and Patkar, 1999). CGTase
production was the same with either organic or inorganic nitrogen source. CGTase activity decreased 2-fold when incubation temperature was increased from 28 to 37 °C, and decreased 2.1- fold when the initial pH was lowered from 10.3 to 7.4 (not shown). Enzyme production was lower in the absence of magnesium sulfate.
Figure 1 - Differential absorbance at 507 nm of methyl orange as a function of the concentration of
α - CD.
The experimental data fitted the equation:
δ A = ( 0.177 x [α-CD])/( 0.130 + [α -CD])
Figure 2 - Differential absorbance at 550 nm of phenolphtalein as a function of the concentration of β - CD.
The experimental data fitted the equation:
δA = (0.800 x [β-CD])/(0.428 + [β -CD])
0.00 0.05 0.10 0.15 0.20
0.0 0.5 1.0 1.5 2.0
α-CD (mmol / L)
δΑ
50
7
Sugar at 0.1 and 0.2% final concentration was added to 0.2 mmol/L β - CD solution in 0.05 mmol/L Tris-HCl buffer, pH 8.0
The data represent the percentage of the absorbance related to the absorbance obtained in the absence of the sugar.
Similar results have been reported by Gawande and Patkar (1999) for K. pneumoniae.
The CGTase activity in U/mL observed with isolate 31 of B. firmus was slightly lower than the activity described by Gawande et al. (1998).
Table 1 - Effect of sugar on colorimetric determination of β-CD by phenolphthalein Sugar concentration
0.10% 0.20%
glucose 102.6 99.1
fructose 95.7 96.1
galactose 100.7 116
mannose 93.1 101.5
arabinose 103.3 112.4
xylose 98.4 99.1
mannitol 93.1 101.5
melibioze 110.1 99.3
lactose 95.2 98.1
cellobiose 123.4 130.3
melezitose 102.6 98.9
Table 2 - Effect of carbon and nitrogen sources on enzyme production C source (2
%) CGTase (U/mL) N source (0.5 %) CGTase (U/mL) Mineral salts CGTase (U/mL)
Corn starch 0.22 Peptone 0.15 Mg4SO4 (0.02%) 0.21
Manioc starch 0.18 Casein
Hydrolysate
0.14
K2HPO4 (0.1%) 0.22
Potato starch 0.21 NaNO3 0.15
β-CD 0.37
ACKNOWLEDGMENT
AJN wishes to thank CNPq and FUNPAR-UFPR for the financial support.
RESUMO
A produção de ciclodextrina glicosiltransferase (EC2.4.1.19, CGTase) de B. firmus isolada de solo de Curitiba, PR, foi otimizada com o uso de modelo estatístico fatorial. Foi estudado o efeito de componentes no meio básico bem como pH inicial e temperatura na produção da enzima. O modelo de fatorial 2k-1 foi usado. A atividade da CGTase foi monitorada pelo método colorimétrico com alaranjado de metila. Houve produção da CGTase quando a fonte de carbono era ami ✁✂ ✄☎✆✝ ✞✟ ✠ ✡
quando galactose, lactose, sacarose e maltose foram usadas, não houve nenhuma produção de enzima. A produção de CGTase foi a mesma com a fonte de nitrogênio orgânico ou inorgânico. A atividade da CGTase diminuiu 2 vezes quando a temperatura de incubação foi aumentada de 28 a 37
REFERENCES
Barcza, L. and Buvari-Barcza, A. (1989), Complex formation of cyclomalto-octaose with tetrabromophenolphthalein and some related compounds. Carbohydrate research, 192, 103-109. Cramer, F. (1952), Occlusion compounds of
cyclodextrins Angew. Chem. Int. Ed. Engl., 64, 136. French, D. (1957), The Schardinger dextrin. Adv.
Carbohydr. Chem., 12, 189-260.
Gawande, B. N.; Singh, R. K.; Chauhan, A. K.; Goel, A. and Patkar, Y. (1998), Optimization of cyclomaltosedextrin glucanotransferase production from Bacillus firmus. Enzyme Microb. Technol., 22 : (4), 288-291.
Gawande, B. N. and Patkar A. Y. (1999), Application of factorial designs for optimization of cyclodextrin glycosyltransferase production from Klebsiella pneumoniae pneumoniae AS-22. Biotech. Bioeng., 64, 168-173.
Goel, A. and Nene, S. (1995), Modification in the phenolphthalein method for spectrophotometric estimation of ß-cyclodextrin. Starch/Starke, 47, 399-400.
Higuti, I. H.; Grande, S. W.; Sacco, R. and Nascimento, A. J. (2003a), Isolation of alkalophilic CGTase-producing bacteria and characterization of cyclodextrin-glycosyltransferase. Braz. Arch. Biol. Tech. [In press].
Higuti, I. H.; Silva, P. A. and Nascimento, A. J. (2003b), Studies on alkalophilic CGTase-producing bactéria and effect of starch on cyclodextrin -glycosyltransferase activity. Braz. Arch. Biol. Tech. [In press].
Jamuna, R.; Saswathi, N.; Sheela, R. and Ramakrishna, S.V. (1993), Synthesis of cyclodextrin glucosyl transferase by Bacillus cereus for the production of cyclodextrins. Appl. Biochem. Biotechnol., 43 : (3), 163-176.
Lejeune, A.; Sakaguchi, K. and Imanaka, T. (1989), A spectrophotometric assay for the cyclization activity of cyclomaltohexaose (α-cyclodextrin) glucanotransferase. Anal. Biochem., 181, 6-11. Makela, M.; Korpela, T. K. and Laakso, S. (1987),
Colorimetric determination of ß-cyclodextrin: two assay modifications based on molecular complexation of phenolphthalein . J. Biochem. Biophys. Methods., 14, 85-92.
Matioli, G. (1997), Seleção de microrganismos e caracterização de sua enzima ciclodextrina glicosiltransferase. Tese (Doutorado), Universidade Federal do Paraná, Curitiba.
Matioli, G. (2000), Ciclodextrinas e suas aplicações em: alimentos fármacos, cosméticos, agricultura, biotecnologia, química analítica e produtos gerais. Maringá : Eduem.
Nakatani, H. and Hiromi, K. (1984), Kinetic study of beta-cyclodextrin-dye system by high-pressure temperature-jump method. J. Biochem., 96 : (1), 69-72.
Pszczola, D. E. (1988), Productions and potential food applications of cyclodextrins. Food Technol., 42, 96-100.
Sjejtli, J. (1986), Ciclodextrin in biotechnology. Starch/Stärke, 38 : (11), 388-390.
Stefanova, M. E.; Tonkova, A. I.; Miteva, V. I. and Dobreva, E. P. (1999), Characterization and cultural conditions of a novel cyclodextrin glucanotransferase- producing Bacillus stearothermophilus strain. J. Bas. Microbiol., 39 : (4), 257-263.
Thoma, J. and Stewart, L. (1965), Cycloamyloses. In: Whistler, R. L. et al. (Eds.). Starch Chemistry and Technology. New York : Academic Press. pp. 209-249.
Vikmon, M. (1981), Rapid and simple spectrophotometric method for determination of microamounts of cyclodextrins. In: Szejtli, J. (Ed.). The First International Symposium on Cyclodextrin. Dordrecht : D. Rildel Publishing Company. pp. 69-74.