Voltammetric Behaviour of Metronidazole at Mercury Electrodes
Mauro A. La-Scaleaa,b,#, Silvia H.P. Serranoa*, and Ivano G.R. Gutza
a
Dep. Química Fundamental, Instituto de Química, Universidade de São Paulo,
C.P. 26077, 05599-970 São Paulo - SP, Brazil
b
Departamento de Farmácia, Faculdade de Ciências Farmacêuticas, Universidade de
São Paulo, Av. Prof. Lineu Prestes 580, 05508-900 São Paulo - SP, Brazil
Metronidazol é o fármaco mais importante do grupo de 5-nitroimidazoles, possuindo toxicidade contra microrganismos anaeróbicos, sendo a molécula de DNA o principal alvo de sua ação biológica. O mecanismo de ação do metronidazol depende do processo de redução do grupo nitro e, em meio ácido, a redução é pH-dependente envolvendo quatro elétrons na completa redução ao derivado hidroxilamínico. Em meio aprótico a redução do metronidazole acontece em duas etapas: a primeira envolvendo um elétron para formar o radical nitro e a segunda etapa envolve mais três elétrons até a formação da hidroxilamina. Neste artigo o mecanismo de redução do metronidazol foi estudado utilizando as técnicas voltamétricas: polarografia d.c. e pulso diferencial, voltametria cíclica usando o eletrodo gota de mercúrio como eletrodo de trabalho.
Metronidazole is the most important drug of the group of 5-nitroimidazoles and possesses toxicity to anaerobic micro-organisms DNA being the main target for their biological action. The mechanism of biological action of metronidazole is dependent upon the nitro group reduction process. The reduction of metronidazole is pH dependent in acid medium and four electrons are involved in the complete reduction to the hydroxylamine derivative. In aprotic medium the reduction of the metronidazole occurs in two steps, the first involving one electron to form the nitro radical and the second step involving three more electrons until the formation of the hydroxylamine derivative. In this paper the mechanism of reduction of metronidazole was studied by using the voltammetric techniques: d.c. polarography, differential pulse polarography and cyclic voltammetry using the mercury drop as the working electrode.
Keywords: metronidazole, nitro radical, voltammetry, polarography
Introduction
Nitroimidazole derivatives contain toxic selectivities to anaerobic micro-organisms1. The most important deriva-tives contain the 5-nitroimidazole nucleus with substituints at the N1 position of the heterocyclic aromatic ring2. Metronidazole [1-(2-hydroxyethyl)2-methyl-5-nitroimi-dazole] has been used as a therapeutic drug for at least 30 years. The reduction of the nitroimidazoles is a complex process, involving 6 electrons for complete reduction of the nitro group to the amine derivative1-3 (Scheme 1).
Under anaerobic conditions or low oxygen pressure, the reduction process is similar to that observed for nitroben-zene4. The reduction mechanism for several aromatic and heterocyclic nitrocompounds was presented by Zuman and co-workers5-13. A total of two electrons and two protons is involved in the formation of the nitroso (R-NO) intermedi-ate, two more electrons and protons result in the hydroxy-lamine (R-NHOH)5-14:
R-NO2 + e → R-NO2
.-R-NO2.- + H+→ R-NO2H. Article
*e-mail: [email protected]; tel/Fax 55 11 818 3837;
#
e-mail: [email protected]
Printed in Brazil. 0103 -- 5053 $6.00 + 0.00
N
N NO
2
H3C
CH2CH2OH
N
N NHOH
H3C
CH2CH2OH
N
N NH
2
H3C
CH2CH2OH N
N NO
H3C
CH2CH2OH
2e 2e 2e
R-NO2H. + H+→ R-NO2H2.+
R-NO2H2.+ + e → R-N(OH)2
R-N(OH)2 → R-NO + H2O
R-NO + 2e + 2H+→ R-NHOH
The addition of two more electrons results in formation of the amine4:
R-NHOH + 2e + 2H+→ R-NH2 + H2O
In voltammetric studies of nitroimidazole derivatives15-17, two reduction waves were observed in aqueous acid me-dium. The first one is due to the nitro group reduction to hydroxylamine and the last one to the subsequent reduction to the amine derivative.
Generally the E1/2 values for the nitro group reduction change with the lateral chain at the N1 position of the heterocyclic ring15-18. Some compounds showed only one reduction wave involving six electrons in alkaline medium. The polarographic behaviour of metronidazole was in-itially reported to be similar in neutral (pH 7.3) and acid medium, with E1/2 = -0.34 and -0.92 V vs. SCE15. Later, Leach and co-workers18 observed only one cathodic wave for metronidazole with E1/2 = -0.465 V in the same buffer solution of pH 7.3. For ornidazole two waves were also reported in acid and neutral medium with disappearance of the second cathodic wave on increasing pH19.
Zuman and co-workers5,7,13 showed that the E1/2 for the first reduction step of nitrocompounds is shifted to more negative potentials with increasing pH. This change in the E1/2 values occurs both in aqueous medium and solutions with different percentages of organic solvents. These shifts were attributed to an acid-base pre-equilibrium followed by the first electron transfer to form the nitro radical.
Voltammetric methods have been applied to the study of the mechanism of nitroimidazoles as antimicrobial agents20, and its determination in pharmaceutical21-25 and clinical25-27 matrces. The mercury electrode was the most used, but good results were obtained using solid electrodes when studying nitrobenzene28-30 and metronidazole31-33.
The biological activity of nitroimidazoles is dependent upon the nitro group reduction process due to the formation of active intermediate species34-38 that interact with DNA to produce biochemical damage1-2. Several studies dealing with stabilization of intermediate nitro species during the electroreduction of nitroimidazole derivatives have been done38. Barety and co-workers39 observed the stabilization of the nitro radical (R-NO2.-) by using cyclic voltammetry in non aqueous medium (dimethylsulfoxide). This species may be responsable for the observed DNA damage38,40. The process was characterized as an ECi mechanism and the reversibility of the first step was dependent on the substituent groups on the heterocyclic ring of the
nitroimi-dazole derivatives39. The electrochemical production of the R-NO2.- radical has also been the target of studies of other pharmacologically active compounds, such as nifurti-mox41, dihydropyridinic compounds42-45 and nitro-substi-tuted amphetamine derivatives46. Voltammetric studies for these compounds showed that their reduction mechanisms are dependent upon the solvent and background electrolyte. This paper advances understanding of the metronida-zole electroreduction process. The results obtained in water and water/DMF using dc, differential pulse polarography and cyclic voltammetry are presented. The fundamental parameters that control the formation and stabilization of the nitro radical intermediate are shown.
Experimental
Metronidazole (MTZ), pharmaceutical grade, was sup-plied by Rhodia Farma Ltda (Brazil). Analytical grade reagents were used to prepare MacIlvine and Britton-Ro-binson series buffer solutions47a (ionic strength = 0.2 mol L-1 with NaNO3), used as support electrolyte for po-larographic measurements. Citrate buffer (pH = 7.4 and ionic strength = 0.3 mol L-1) solutions were used for cyclic voltammetric measurements in dimethyl formamide (DMF)/aqueous buffer mixtures. All solutions were pre-pared using purified water from a Barnstead Nanopore system.
All polarograms were recorded using a Metrohm Po-larecord E 506 connected to Multi Mode Electrode - 663 VA Stand system. The dropping and static mercury drop electrodes were used as working electrodes. The dropping time for dc polarographic measurements was 3.4 s. Differ-ential pulse voltammograms were recorded using a drop-ping time of 1.0 s, pulse amplitude (∆E) of 50 mV and scan rate (ν) of 5 mV s-1. All cyclic voltammograms were recorded by using an EG&G PAR 273 Potentiostat/Gal-vanostat connected to a three electrode system cell (EG&G PAR 303A) and a HMDE (mean area = 1.02 mm2)47b as a working electrode. In all experiments, Pt and Ag/AgCl were used as counter and reference electrodes respectively. The pH measurements were done with a Micronal B375 pH-meter and a Metrohm glass electrode (6.0203.100-OE). The experiments were done in the absence of oxygen after purging with high purity N2 for at least 10 min. All meas-urements were made at room temperature, 23 ± 5 °C.
Results and Discussion
d.c. polarography
po-larographic maximum (Fig. 1). These results are in good agreement with those obtained by Leach et al.18 at the same pH value (pH 7.3). By focusing the polarographic reduc-tion, the results of Dumanovic16 and Leach18 differ only with respect to E1/2 values. The present results confirm the observation, that the second reduction wave of MTZ disap-pears by increasing the pH.
Figure 2A shows that the E1/2 values for the first wave shift linearly to the cathodic region with the pH increase (E1/2 = 0.114 - 0.0721 pH), confirming that H+ ions are involved in the reduction process. Similar behaviour has been reported for secnidazole by Radi and co-workers48.
The number of protons (p) involved in the rate-deter-mining step of the electrode reaction can be calculated by49-51:
∆E1⁄2 ∆pH =
−0.059p
αn (1)
where α is the charge transfer coefficient. The αn value for the irreversible process can be calculated by the equation:
E = E1⁄2− 0.059 αn log [
i
id − i] (2)
αn and p correspond to the parameters that control the rate-determining step of the reaction at different pH values. The αn and p values for 0.1 mmol L-1 of MTZ at pH 7.4 were 1.03 and 1.26, respectively, suggesting the involve-ment of two electrons in the rate determining step of the electrode reaction. This indicates that the wave can be attribuited to a nitroso compound that probably is being formed after the first two electrons are transfered and is reduced immediately to the hydroxylamine or amine
de-rivative5,13. In fact, this can be evaluated by the number of protons and electrons involved in the metronidazole reduc-tion. Therefore, the E1/2 values can be defined by the charge transfer of the first or second electron, despite the detection of only one reduction wave with 4 electrons. Similar results were obtained for nitrofurantoin and chloranphenicol49.
Differential pulse polarography
The same study was repeated with differential pulse polarography (dpp) due to better discrimination of faradaic processes at low electroactive species concentrations.
The differential pulse polarogram of MTZ also showed two reduction waves in acidic medium. As observed for dc polarography, the second cathodic wave disappears with increasing pH. The best conditions for the observation of the two reduction waves were obtained at pH 4.0. Ep1 and Ep2 were - 0.17 and -0.95 V, respectively, with Ep1 chang-ing linearly with the pH (Ep1 = 0.118 - 0.0773 pH), Figure 2B, in good agreement with the dc polarography results. The peak current levels increased with the pH value, but no linear relation was observed. The same behaviour was observed on a glassy carbon electrode, suggesting that 6 electrons were involved in the process producing the amine derivative in basic medium, as observed previously31,32.
Differential pulse polarography can be a good alterna-tive for the analytical determination of metronidazole, Fig. 3 shows the reduction peaks obtained by dpp for several
Figure 2. Plot of E vs. pH: (A) E1/2 values for first reduction wave of 0.5
mmol L-1 MTZ; (B) Ep values for first reducition wave of 0.1 mmol L-1
MTZ. McIlvine buffer, I = 0.2 mol L-1. Figure 1. d.c. polarograms of 0.5 mmol L-1 MTZ in McIlvine buffer, pH:
MTZ concentrations. In fact, a linear analytical curve was observed from 1.0 to 100 µmol L-1 with a detection limit of 0.75 µmol L-1.
Cyclic voltammetry
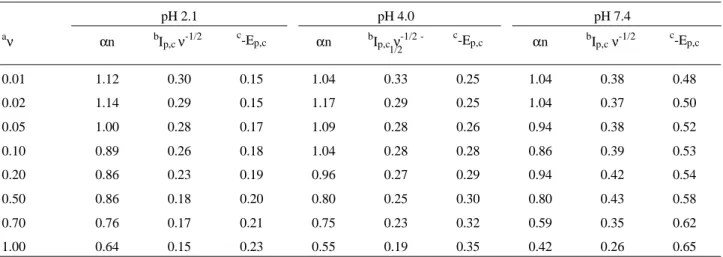
The MTZ behaviour was also studied using 0.1 mmol L-1 at three different pH values: 2.1, 4.0 and 7.4. As observed with prior techniques, only one reduction wave was the observed by cyclic voltammetry at pH 7.4 (Fig. 4). Anodic waves did not appear under any circunstance. The voltammetric data for reduction of MTZ to the hydroxylamine derivative is pre-sented in Table 1. The electroreduction of MTZ is compatible with the mechanism:
R-NO2 + 4e + 4 H+→ R-NHOH + H2O
The potential of the cathodic peaks (Ep,c) shifted to more negative values by increasing the pH or scan rate. In the last case, higher current signals were also observed.
To determine αn values the follow relation was used50-52:
E p⁄2 = ( Ep,c±0.048
αn ) V (3)
The αn value obtained by d.c. polarography (Eq. 2), 1.03, agrees with the values presented in Table 1, for a compatible time scale of both techniques. If α is a revers-ibility criterion and the number of electrons is the same in all the cases, looking at the results obtained by cyclic voltammetry and shown in Table 1, the MTZ reduction irreversibility becames evident at higher scan rates and pH values. Literature results52 show that for irreversible sys-tems the current function (Ip,c /ν1/2) can be scan rate inde-pendent while Ep,c varies negatively as the scan rate increases.
As mentioned in the introduction, several authors re-ported the nitro radical stabilization in aprotic medium or mixtures of water/organic solvents. A closer investigation of MTZ in several mixtures of aqueous citrate buffer (pH 7.4)/DMF was done here.
Figure 3. Reduction peaks of MTZ obtained by dpp in McIlvine buffer pH 7.4. Dropping time = 1.0 s; ∆E = 50 mV; ν = 5 mV s-1. [MTZ] = 1 -0.0; 2 - 0.99; 3 - 1.96; 4 - 2.91; 5 - 4.76; 6 - 9.09; 7 - 31.8 µmol L-1.
Table 1. Voltammetric results for the reduction of MTZ 0.1 mmol L-1 in aqueous MacIlvine buffer, using HMDE.
pH 2.1 pH 4.0 pH 7.4
aν α
n bIp,c ν-1/2 c-Ep,c αn bIp,cν-1/2 -1/2
c
-Ep,c αn bIp,cν-1/2 c-Ep,c
0.01 1.12 0.30 0.15 1.04 0.33 0.25 1.04 0.38 0.48
0.02 1.14 0.29 0.15 1.17 0.29 0.25 1.04 0.37 0.50
0.05 1.00 0.28 0.17 1.09 0.28 0.26 0.94 0.38 0.52
0.10 0.89 0.26 0.18 1.04 0.28 0.28 0.86 0.39 0.53
0.20 0.86 0.23 0.19 0.96 0.27 0.29 0.94 0.42 0.54
0.50 0.86 0.18 0.20 0.80 0.25 0.30 0.80 0.43 0.58
0.70 0.76 0.17 0.21 0.75 0.23 0.32 0.59 0.35 0.62
1.00 0.64 0.15 0.23 0.55 0.19 0.35 0.42 0.26 0.65
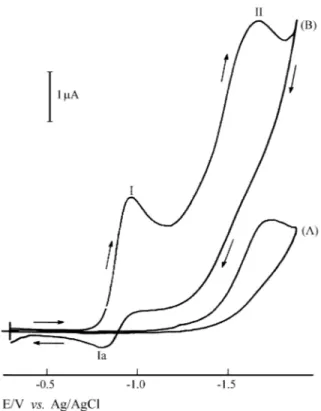
By using 50% of DMF/citrate buffer with the pH ad-justed to 7.4 the Ep,c shifted to -0.87 V at 1.0 V s-1 and no anodic peak was detected. However, when an apparent pH* of 8.9 (in aprotic medium) was selected the MTZ cyclic voltammogram showed two reduction peaks (I, II) and one anodic peak (Ia) with smaller area than any one of the former. As presented in Fig. 5, for [MTZ] = 0.5 mmol L-1
the Ep,c I was -0.95 V and the corresponding anodic peak, Ep,a Ia, was -0.71 V. The second cathodic potential peak (Ep,c II) was -1.63 V.
By comparing this data with the behaviour of other nitro-compounds39,41-46, the peak I can be attributed to the nitro group reduction to the free radical R-NO2.- with one electron transfer and the peak II, to the hydroxylamine derivative, involving three electrons, following the mechanism:
R-NO2 + e R-NO2
.-R-NO2.- + 3e + 4 H+→ R-NHOH + H2O
For several DMF/citrate buffer (pH 7.4) percentages (10 to 60% of DMF) with the apparent pH increased to the range 8.5 ≤ pH ≤ 9.0, the nitro radical has increased stability due to the decreased proton concentration. In fact, the ratio
Table 2. Influence of DMF percentages on current ratio and peak poten-tials.
%DMF Ip,a/Ip,c -Ep,c/V
10 0.61 0.82
20 0.61 0.86
23 0.61 0.87
26 0.62 0.87
30 0.62 0.89
33 0.65 0.89
40 0.68 0.91
50 0.72 0.96
60 0.76 0.98
[MTZ] = 0.6 mmol L-1; citrate buffer pH 7.4; ν = 1.0 V s-1. Figure 5. Cyclic voltammogram of DMF 50%/citrate buffer (pH 7.4); (B)
cyclic voltammogram of (A) + 0.5 mmol L-1 MTZ. HMDE; ν = 1.0 V s-1; pH* = 8.9.
Ip,a/Ip,c for R-NO2/R-NO2.- couple increased with the DMF percentages and Ep,c I shifted to more negative values as
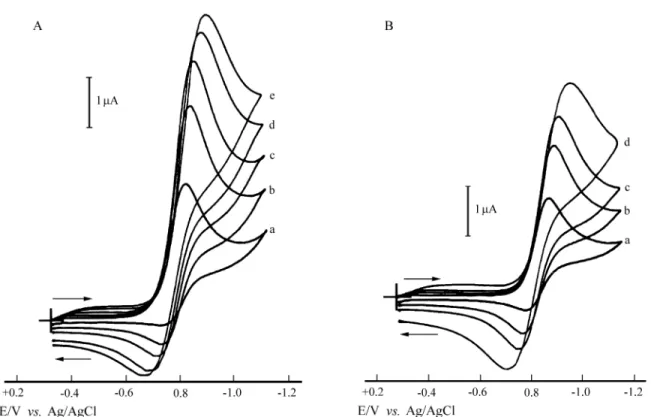
shown in Table 2. These results demonstrate the stabiliza-tion of the nitro radical in DMF, although the current ratio remained smaller than unity. Barety et al.39 have reported Figure 6. Cyclic voltammograms for first reduction step of 0.6 mmol L-1 MTZ at several scan rates in (A) DMF 30%/citrate buffer (pH 7.4); (B) DMF 50%/citrate buffer (pH 7.4). HMDE, a - 0.10; b - 0.30; c - 0.50; d - 0.80 and 1.0 (resp.); e - 1.0 V s-1.
Figure 7. Plot Ip,a/Ip,cvs.ν for different MTZ concentrations in DMF 50%/citrate buffer (pH 7.4).
that the Ip,a/Ip,c ratios close to 1 in dimethylsulfoxide only for tinidazole and nimorazole, but not for metronidazole.
Figures 6A and 6B show the cyclic voltammograms of the first reduction step of metronidazole in 30% and 50% DMF, respectively. Comparing the voltammograms it can be observed that the cathodic as well as the anodic current is dependent upon the percentage of DMF suggesting an apparent stabilization of the nitro radical. The decrease of the value of the cathodic current with the increase in the DMF percentage indicates the occurrence of a protonation step preceding charge transfer5, and suggests the stabiliza-tion of this derivative instead of the nitro radical, followed by the reduction involving one electron. For the smallest amounts of DMF, probably, the R-NO2H+/R-NO2H. couple is stabilized. The alternative mechanism is presented as follows:
R-NO2H+ R-NO2 + H+
R-NO2H+ + e R-NO2H.
As mentioned, some works39,41-46 have shown that the nitro radical stabilization process of the nitrocompounds indicates a reversible charge transfer mechanism followed by an irreversible chemical reaction. The same mechanism can be attributed to metronidazole. Figure 7 shows that in DMF 50%/citrate buffer (pH 7.4) the Ip,a/Ip,c ratio changed with the scan rate for different MTZ concentrations. The maximum value, 0.90, was obtained with the lowest con-centration (0.2 mmol L-1 MTZ) and highest scan rate (1.0 V s-1). As can be confirmed in Fig. 8, the Ip,a/Ip,c ratio is a function of: DMF percentage, scan rate and MTZ concen-tration.
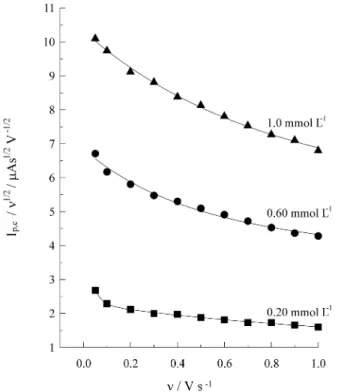
The peak potentials for reduction of the nitro group are also dependent upon the scan rate, because Ep,c are switched linearly on negative potentials with scan rate (Fig. 9). On the other hand, the small influence on current function of the scan rate, Ip,c/ν1/2, (Fig. 10) indicates weak adsorption of the reagent on the mercury electrode.
The results described above indicate that this system involves charge transfer followed by irreversible chemical reactions, an ECi mechanism51,52. This behaviour can be represented by the following reaction mechanism:
R-NO2 + e R-NO2.- Z
Therefore, as proposed by other authors41-46,53-56, the model for a second-order reaction can be applied to the nitro radical disproportionation reaction, represented by the equation:
2 R-NO2.- + 2 H+→ R-NO2 + R-NO + H2O
Using the theoretical model of Olmestead et al.57, the values of Ip,a/Ip,c measured at each scan rate were inserted in a work curve to determine the parameter ω, that incor-porates the effects of rate constant, drug concentration and scan rate.
Figure 9. Plot Ep,cvs.ν. [MTZ] = 0.2 mmol L-1 in DMF 50%/citrate buffer (pH 7.4).
Figure 10. Plot Ip,c/ν1/2vs.ν for different MTZ concentrations in DMF
50%/citrate buffer (pH 7.4).
The ω vs. τ plot results in a linear relationship that can be described by the equation:
ω= k2 C0τ (4)
where k2 is the rate constant of the second-order reaction for the nitro radical decomposition, C0 is the metronidazole concentration and τ (= (E1/2 - Eλ)/ν is the time to scan between E1/2 and switching potential. Consequently, k2 value can be obtained from the slope of ω vs. τ plot (ω = 0.531 + 1.31 τ, correlation coefficient = 0.994).
Thus, using the method described above the k2 value (6.6 x 10³ L/mol s) was obtained and the nitro radical stability could be calculed by half-life calculation (t1/2 = 1/[R-NO2.-] k2) for the nitro radical in DMF 50%/citrate buffer (pH 7.4), t1/2 = 0.76 s. Based on these results it can be seen that the rate constant decreased and the half-life increased as the DMF percentage increased. This behaviour confirms the results obtained by pulse radiolysis, suggest-ing that the biological activity of metronidazole depends upon its electron affinity as discussed by other authors57.
Conclusions
The voltammetric techniques showed themselves to be an excellent alternative for the study of the reaction mecha-nisms and analytical determinations of drugs, especially heterocyclic nitrocompounds. The results showed the for-mation and stabilization of the nitro radical during metroni-dazole electrochemical reduction, demonstrating the possibility for the study of this group of drugs that reveal their biological activity by targeting DNA. The results of this paper are complementary to previously published data31,32,54 obtained with a DNA glassy carbon modified electrode, that indicate that the intermediates of metronida-zole reduction are responsible for the biochemical damage to the DNA. In conclusion, knowledge of the conditions for free radical formation and stabilization will allow studies of the interaction of the nitro radical and DNA-bases.
References
1. Edwards, D.I. J. Antimicrob. Chemothr. 1993, 31, 9. 2. Edwards, D.I. In Comprehensive Medicinal
Chemis-try, Hansch, C., Ed.; Pergamon Press, New York, Vol.
2, 5th ed., 1990, p. 725.
3. Knox, R.I.; Knight, R.C.; Edwards, D.I. Biochem.
Pharmac. 1983, 32, 2149.
4. Zuman, P.; Fijalek, Z. J. Electroanal. Chem. 1990,
296, 538.
5. Zuman, P.; Fijalek, Z.; Dumanovic, D.; Suznjevic, D.
Electroanalysis 1992, 4, 783.
6. Dumanovic, D.; Suznjevic, D.; Erceg, M.; Zuman, P.
Electroanalysis 1992, 4, 795.
7. Dumanovic, D.; Jovanovic, J.; Suznjevic, D.; Erceg, M.; Zuman, P. Electroanalysis 1992, 4, 871.
8. Dumanovic, D.; Jovanovic, J.; Suznjevic, D.; Erceg, M.; Zuman, P. Electroanalysis 1992, 4, 889.
9. Dumanovic, D.; Jovanovic, J.; Marjanovic, B.; Zu-man, P. Electroanalysis 1993, 5, 47.
10. Fijalek, Z.; Zuman, P. Electroanalysis 1993, 5, 53. 11. Fijalek, Z.; Pugia, M.; Zuman, P. Electroanalysis
1993, 5, 65.
12. Zuman, P.; Rupp, E. Electroanalysis 1995, 7, 132. 13. Karakus, C.; Zuman, P. J. Electroanal. Chem. 1995,
396, 499.
14. Declerck, P.J.; De Ranter, C.J. Analusis 1987, 15, 148. 15. Dumanovic, D.; Volke, J.; Vajgand, V. J. Pharm.
Pharmac. 1966, 18, 507.
16. Dumanovic, D.; Perkucin, S.; Volke, J. Talanta 1971,
18, 675.
17. Dumanovic, D.; Ciric, J. Talanta 1973, 20, 525. 18. Leach, S.C.; Weaver, R.D.; Kinoshita, K.; Lee, W. J.
Electroanal. Chem. 1981, 129, 213.
19. Fonseca, J.M.L.; Rivera, M.C.G.; Monteagudo, J.C.G. Anal. Lett. 1993, 26, 109.
20. Chien, Y.W.; Mizuba, S.S. J. Med. Chem. 1978, 21, 374.
21. Papas, A.N.; Delaney, M.F. Anal. Lett. 1982, 15, 739. 22. Zuhri, A.Z.A.; Al-Khalil, S.I.; Suleiman, M.S. Anal.
Lett. 1986, 19, 453.
23. Patriarche, G.J.; Vire, J.C. Anal. Chim. Acta 1987,
196, 193.
24. Yarnitzky, C.; Smith, W.F. Int. J. Pharmac. 1991, 75, 161.
25. El-Sayed, G.O. Microchem. Journal 1997, 55, 110. 26. Brooks, M.A.; D’Arconte, L.; Silva, J.A.F. J. Pharm.
Sci. 1976, 65, 112.
27. Wang, Z.; Zhou, H.; Zhou, S. Talanta 1993, 40, 1073. 28. Nishihara, C.; Kaise, M. J. Electroanal. Chem. 1983,
149, 287.
29. Rubinstein, I. J. Electroanal. Chem. 1985, 183, 379. 30. Nishihara, C.; Shindo, H. J. Electroanal. Chem. 1987,
221, 245.
31. Brett, A.M.O.; Serrano, S.H.P.; Gutz, I.G.R.; La-Scalea, M.A. Electroanalysis 1997, 9, 110.
32. Brett, A.M.O.; Serrano, S.H.P.; Gutz, I.G.R.; La-Scalea, M.A. Bioelectrochem. Bioenerg. 1997, 42, 175.
33. Bishop, E.; Hussein, W. Analyst 1984, 109, 759. 34. Knox, R.J.; Knight, R.C.; Edwards, D.I. Br. J. Cancer
1981, 44, 741.
35. Edwards, D.I.; Knight, R.C.; Zahoor, A. Int. J.
Radia-tion Oncology Biol. Phys. 1986, 12, 1207.
36. Declerck, P.J.; De Ranter, C.J. Biochem. Pharmacol.
1986, 35, 59.
37. Declerck, P.J.; De Ranter, C.J. J. Chem. Soc., Faraday
Trans. 1 1987, 83, 257.
38. Tocher, J.H.; Edwards, D.I. Biochem. Pharmacol.
39. Barety, D.; Resibois, B.; Vergoten, G.; Moschetto, Y.
J. Electroanal. Chem. 1984, 162, 335.
40. Moreno, S.N.; Mason, R.P.; Muniz, R.P.A.; Cruz, F.S.; Docampo, R. J. Biol. Chem. 1983, 258, 4051. 41. Núñez-Vergara, L.J.; Aldunate, J.; Letelier, M.E.;
Bollo, S.; Repetto, Y.; Morello, A.; Spencer P.L.; Squella, J.A. Bioelectrochem. Bioenerg. 1995, 38, 355.
42. Squella, J.A.; Mosre, J.; Blásquez, M.; Núñez-Ver-gara, L.J. J. Electroanal. Chem. 1991, 319, 177. 43. Núñez-Vergara, L.J.; Bollo, S.; Alvarez, A.F.;
Squella, J.A. J. Electroanal. Chem. 1993, 345, 121. 44. Squella, J.A.; Bollo, S.; de la Fuente, J.;
Núñez-Ver-gara, L.J. Bioelectrochem. Bioenerg. 1994, 34, 13. 45. Núñez-Vergara, L.J.; Garcia, F.; Domínguez, M.M.;
de la Fuente, J.; Squella, J.A. J. Electroanal. Chem.
1995, 381, 215.
46. Núñez-Vergara, L.; Matus, C.; Alvarez-Lueje, A.F.; Cassels, B.K.; Squella, J.A. Electroanalysis 1994, 6, 509.
47. (a) Perrin, D.D.; Denpsey, B. Buffers for pH and Metal
Ions Control, Chapman and Hall, London, 1974. (b)
Pedrotti, J.J; Angnes, L.; Gutz, I.G.R. Electroanalysis
1992, 3, 635.
48. Radi, A.; El-Laban, S.; El-Kourashy, A.-G.
Elec-troanalysis 1997, 9, 625.
49. Morales, A.; Toral, M.I.; Richter, P. Analyst 1984,
109, 633.
50. Plambeck, J.A.; Electroanalytical Chemistry: basic
principles and applications, John Wiley & Sons, New
York, 1982.
51. Brett, C.M.A.; Brett, A.M.O. Electrochemistry:
prin-ciples, methods and applications, Oxford University
Press, New York, 1993.
52. Brown, E.R.; Sandifer, J.R. In Physical Methods of
Chemistry, Electrochemical Methods, Rossiter, B.
W.; Hamilton, J. F., Eds., Vol. II, 2th ed., John Wiley, New York, 1986, p 273.
53. Tocher, J.H.; Edwards, D.I. Free Rad. Res. Comm.
1992, 16, 19.
54. Tocher, J.H.; Edwards, D.I. Int. J. Radiat. Biol. 1990,
57, 45.
55. Tocher, J.H.; Edwards, D.I. Free Rad. Res. Comm.
1989, 6, 39.
56. Tocher, J.H.; Edwards, D.I. Free Rad. Res. Comm.
1988, 4, 269.
57. Wardman, P.; Clarke, E.D. J. Chem. Soc., Faraday
Trans 1 1976, 76, 1377.
58. Brett, A.M.O.; Serrano, S.H.P.; Gutz, I.; La-Scalea, M.A.; Cruz, M.L. Electroanalysis 1997, 9, 1132.
Received: August 3, 1998