www.atmos-chem-phys.net/11/1837/2011/ doi:10.5194/acp-11-1837-2011
© Author(s) 2011. CC Attribution 3.0 License.
Chemistry
and Physics
Dependence of SOA oxidation on organic aerosol mass
concentration and OH exposure: experimental PAM chamber
studies
E. Kang1,3, D. W. Toohey2, and W. H. Brune1
1Department of Meteorology, Pennsylvania State University, University Park, PA 16802, USA
2Department of Atmospheric and Oceanic Sciences, University of Colorado, Boulder, CO 80309-0311, USA 3Department of Earth and Environmental Science, Korea University, Seoul, 136-701, Korea
Received: 27 September 2010 – Published in Atmos. Chem. Phys. Discuss.: 15 October 2010 Revised: 14 February 2011 – Accepted: 17 February 2011 – Published: 28 February 2011
Abstract.The oxidation of secondary organic aerosol (SOA) is studied with mass spectra analysis of SOA formed in a Po-tential Aerosol Mass (PAM) chamber, a small flow-through photo-oxidation chamber with extremely high OH and ozone levels. The OH exposure from a few minutes in the PAM chamber is similar to that from days to weeks in the atmo-sphere. The mass spectra were measured with a Quadrupole Aerosol Mass Spectrometer (Q-AMS) for SOA formed from oxidation ofα-pinene,m-xylene,p-xylene, and a mixture of the three. The organic mass fractions ofm/z44 (CO+2)and m/z43 (mainly C2H3O+), namedf44 andf43 respectively, are used as indicators of the degree of organic aerosol (OA) oxidation that occurs as the OA mass concentration or the OH exposure are varied. The degree of oxidation is sensi-tive to both. For a fixed OH exposure, the degree of oxida-tion initially decreases rapidly and then more slowly as the OA mass concentration increases. For fixed initial precur-sor VOC amounts, the degree of oxidation increases linearly with OH exposure, withf44 increasing andf43 decreasing. In this study, the degree of SOA oxidation spans much of the range observed in the atmosphere. These results, while sen-sitive to the determination off44 andf43, provide evidence that some characteristics of atmospheric OA oxidation can be generated in a PAM chamber. For all measurements in this study, the sum off44andf43is 0.25±0.03, so that the slope of a linear regression is approximately−1 on anf44vs.f43 plot. This constancy of the sum suggests that these ions are complete proxies for organic mass in the OA studied.
Correspondence to:E. Kang ([email protected])
1 Introduction
Organic aerosol (OA) is a significant fraction of the total atmospheric aerosol (Kanakidou et al., 2005) and, as a re-sult, affects both climate change by changing Earth’s radia-tive balance (Forster et al., 2007; Hoyle et al., 2009; Myhre et al., 2009) and human health by degrading the cardiovas-cular and respiratory system (Nel, 2005; Jang et al., 2006; Baltensperger et al., 2008). A significant fraction of OA is secondary organic aerosol (SOA), which is formed when at-mospheric oxidants such as the hydroxyl radical (OH) and ozone (O3)react with volatile organic compounds (VOCs) to form lower volatility organics. These VOCs are numerous and include biogenic terpenes, anthropogenic alkenes, aro-matics, and long-chain alkenes. Because of the importance of SOA to both climate and human health, SOA has become a focus of intense laboratory, theoretical, and observational research (Kroll and Seinfeld, 2008; Hallquist et al., 2009).
The evolution of SOA appears to be complicated. Unlike sulfate that remains in the particle phase, the organic con-stituents that compose OA are semi-volatile and continually partition between the particle and gas phases. The aging process can cause the shift in the gas and particle partition-ing equilibrium by dilution with fresh air, the further oxi-dation of the gaseous product, heterogeneous oxioxi-dation of the organic layer in the particle, and the reactions that lead to oligomer formation (Donahue et al., 2006; Rudich et al., 2007; Shilling et al., 2009). Oxidants such as hydroxyl (OH), ozone (O3), hydroperoxyl (HO2), organic peroxyl (RO2), ni-tric oxide (NO), and nitrogen dioxide (NO2)affect the yields and identity of the reaction products. In some situations, or-ganics in OA may be directly decomposed by the ultraviolet (UV) light (Kroll et al., 2006; Surratt et al., 2006; Lambe et al., 2007; Warren et al., 2008).
New modeling frameworks are being developed to ac-count for these changes in OA with atmospheric oxidation (Dzepina et al., 2009; Jimenez et al., 2009), but the uncer-tainties and unknowns in OA oxidation are large. Measured OA can greatly exceed the model calculated OA by a factor of 4 to 100 (Volkamer et al., 2006). The cause of this discrep-ancy is currently unknown but may result from unmeasured precursor VOCs that can lead to SOA formation, unknown oxidation processes, or measurement errors for OA and pre-cursor VOCs in both the atmosphere and the laboratory.
To complicate this problem further, controlled laboratory chambers and flow tubes offer only imperfect simulations of OA atmospheric oxidation. Problems include using VOCs amounts well above atmospheric levels, potentially interac-tive walls (Matsunaga and Ziemann, 2010), and levels of oxidants or oxidant precursors that are significantly larger than those in the atmosphere. A key test is to compare the chemical composition of the OA produced in these cham-bers with that observed in the atmosphere. For most large environmental chambers, the chemical composition of OA is much more hydrocarbon-like than the OA observed in the at-mosphere (Bahreini et al., 2005; Alfarra et al., 2006; Zhang et al., 2006; Shilling et al., 2009; Ng et al., 2010), proba-bly because the exposure to oxidants is much less than in the atmosphere, especially in case of rural or remote regions. Even when oxidant levels are increased in large environmen-tal chambers, it is difficult to achieve the exposure to oxidants that occurs in the atmosphere. Attempts to increase the expo-sure to oxidants have used highly oxidative environments in small chambers and flow tubes (Jimenez et al., 2009; Kroll et al., 2009; George and Abbatt, 2010), but the resulting chem-ical composition has too much SV-OOA for the observed amounts of LV-OOA (Ng et al., 2010). These conclusions are based on only a few laboratory studies.
The degree of OA oxidation is often studied with an aerosol mass spectrometer (AMS), which vaporizes incom-ing OA and then samples the mass spectrum of the vaporized, ionized molecular fragments (Zhang et a., 2005; Jimenez et al., 2009; Ng et al., 2010). HOA is identified by the mass to
charge ratios (m/z) 41, 43, 55, 57, 69, 71 and OOA is mainly identified bym/z43 and 44. SV-OOA is characterized as a relatively less aged aerosol with more volatile organic com-pounds. Thus ambient SV-OOA is often highly correlated with semi-volatile species like ammonium nitrate and am-monium chloride, has a low ratio of oxygen to carbon (O:C), and hasm/z43 contributing more thanm/z44 to the OA mass concentration. In contrast, LV-OOA has morem/z44 than m/z43. SV-OOA and LV-OOA are not uniquely defined but form a continuum of the degree of oxidation.
The contributions of the mass concentrations atm/z43 and m/z44 to OA mass concentration, calledf43andf44(Ng et al., 2010), have been used to indicate the degree of OA oxida-tion, along with the O:C ratio and the overall mass spectrum (Lanz et al., 2007; Aiken et al., 2008; Jimenez et al., 2009). For the comparison of various OA aging processes in the at-mosphere and laboratory studies, a generalized clear defini-tion of the contribudefini-tion of the mass concentradefini-tions atm/z43 andm/z 44 to OA mass concentrations is required. Typi-cally for laboratory studies,f43andf44can be defined as the mass concentrations atm/z43 andm/z44 divided by the OA mass concentrations as determined from Q-AMS fragmenta-tion tables (Allan et al., 2004) that are modified to attribute the total observed mass to organics. While Principle Compo-nent Analysis provides a more rigorous characterization of atmospheric OA, the use off43andf44is sufficient to track the degree of oxidation in VOC precursor laboratory experi-ments (e.g., Shilling et al., 2009; Ng et al., 2010).
In this paper, we present the results of OA oxidation stud-ies conducted in the highly oxidizing environment of a Po-tential Aerosol Mass chamber (Kang et al., 2007). In a previous manuscript, we introduced the concept of Poten-tial Aerosol Mass (PAM), which is defined as the maximum aerosol mass that the oxidation of precursor gases produces, and presented the results of extensive tests of the chamber performance and the OA yields of several atmospherically relevant VOCs (Kang et al., 2007). A Tapered Element Os-cillation Microbalance (TEOM) was used to measure the OA mass in those studies. During some additional experi-ments, we also sampled the OA chemical composition from the PAM chamber using a Quadrupole-Aerosol Mass Spec-trometer (Q-AMS). In this study, we use mass spectra taken with the Q-AMS to examine the chemical characteristics of OA as a function of the OA mass concentration and the OH exposure and to compare these results to those from other recent laboratory studies.
2 Experimental method
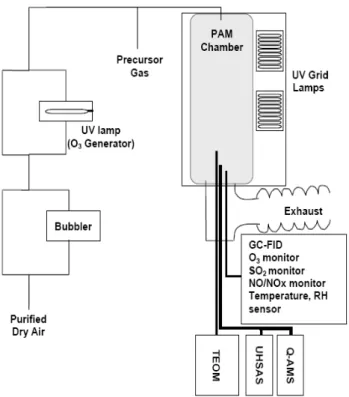
Fig. 1.Schematic diagram of the PAM chamber. Purified air could be humidified by passing through or around a bubbler, after which ozone and the precursor gas could be added. This gas was added uniformly across the PAM chamber cross-section; part of the flow was sampled by multiple instruments in the center of the bottom plate, while about half the flow exited through a ring-shaped tube with tiny drilled holes surrounding the sampling tube.
miscellaneous gas sampling instruments. Whereas our pre-vious study focused on the TEOM results, this study focuses on the Q-AMS data. Additional monitoring of the refractive index of the particles using the Ultra-high Sensitivity Aerosol Spectrometer (UHSAS, ParticleMetrics, Inc., Boulder, CO) will not be discussed here.
2.1 PAM chamber description
The PAM chamber and its operation are described in detail in Kang et al. (2007), so only a brief description is presented here (Fig. 1). This version of the PAM chamber was a contin-uous flow 19 L cylinder (diameter 20 cm, length 60 cm) made of Teflon FEP film (0.5 mm thick) and suspended in a sealed housing. Two ozone-producing ultraviolet (UV) grid lamps (BHK Inc., Ontario, CA) that mainly produced 185 nm and 254 nm light were mounted on a wall of the housing. The volume inside of the housing surrounding the Teflon cham-ber was purged with N2gas to prevent gas impurities from diffusing through the Teflon into the chamber air and to pre-vent ozone formation in the space between the Teflon cham-ber and housing. The sample air was continuously added into the PAM chamber and removed through a large exhaust hose
at the bottom of the PAM chamber. Aerosol particles, gases, relative humidity, pressure, and temperature were sampled from the bottom of the PAM chamber.
To distribute the air flow evenly into the chamber and to reduce losses on the wall surfaces, the sample air was added through tubes that had many tiny drilled holes and spiraled out from a central tube. Approximately 60% of the flow was sampled by the instrument inlet in the center of the bottom plate, while the rest exited the chamber through a ring-shaped tube with tiny drilled holes that surrounded the sampling in-let. The flow in the PAM chamber is not strictly plug flow, for which residence time and distance from the inlet are lin-early correlated. Instead, convection mixes the air and cre-ates a distribution of residence times (Lambe et al., 2010). Thus, OA sampled at any time have experienced a distribu-tion of OH exposures, although the distribudistribu-tion does have a well-defined peak value. Possible wall effects in the PAM chamber were examined by adding SO2, turning on the UV lights to produce OH, and then measuring the SO2decrease and the sulfate mass increase. Sulfate aerosol is known to be rapidly lost to wall surfaces, but the conversion of SO2 to sulfate in the chamber agreed with theory to within 10%, indicating that wall loss had little effect on the sampled air.
2.2 Experimental conditions
The SOA formation experiments were carried out using photo-oxidation of three precursor VOCs: α-pinene, m-xylene, andp-xylene. The PAM chamber was continuously flushed with humidified and purified zero air overnight be-fore experiments the next day. In addition, a humidified zero air flow was frequently irradiated by UV lamps to clean up the chamber and to test for particle formation, which would indicate problems with wall interactions or impure zero air. The flow rate in the chamber was 5 L min−1, which produced a mean residence time of 240±36 s. VOC gas mixtures,
prepared in ultra zero N2gas, were combined with humid-ified zero air prior to the PAM chamber inlet and then added into the chamber. The stated purities of parent VOCs and N2gas are as follows: α-pinene (Fluka, 99.0%),m-xylene (Fluka, 99.5%),p-xylene (Fluka, 99.5%), and N2(99.999% pure, <0.5 ppm THC, GTS). The preparation method was described previously (Kang et al., 2007).
humidity is given by OH(pptv) = 9.3643×RH(%) + 34.643, R2=0.99. The relative humidity range was 3 to 45%. The absolute uncertainty of this calibration is±32%, 2σ uncer-tainty (Faloona et al., 2004). The photo-oxidation and parti-cle formation was initiated and terminated by turning on and off the UV lamp.
OH exposure, which is OH concentration (molecules cm−3) integrated over the time in the PAM chamber, determines how fast the precursor VOCs and their products are oxidized. The rates for re-actions between OH and VOCs are large; for in-stance kOH+α−pinene = 5 × 10⁻¹¹molecules−1cm3s−1, kOH+m−xylene = 2.44×10⁻¹¹molecules−1cm3s−1, and kOH+p−xylene=1.5×10⁻¹¹molecules−1cm3s−1 at 300 K (NIST Chemical Kinetics Database, Version 7.0, 2000). For even the largest VOC amount and smallest OH amount, photochemical modeling indicates that VOCs were oxidized and OH returned to a stable value within the first 150 s in the chamber, with OH recovering faster for α-pinene than for the xylenes. This modeling result is confirmed by gas chromatographic measurements that show no VOCs remained at the bottom of the chamber for all experiments. Photochemical modeling also shows that OH exposure was reduced by the presence of the high VOC amounts, by as much as 40% in the worst case. These modeling calculations have been used to correct the OH exposure determined from relative humidity. The OH exposure calculation also includes the uncertainty error bars (2σ confidence level) to take into account the OH yields from the fact that the ozone reactions with the VOCs and their products can produce OH as well as destroy it. For experiments with various VOC amounts and fixed OH, OH exposures decreased with in-creasing VOC amounts, dein-creasing 20% forα-pinene, 33% for m-xylene, and 23% forp-xylene. An OH exposure of 1012molecules cm−3s in the PAM chamber is equivalent to an ambient exposure time of∼5 days for a typical diurnally
averaged OH concentration of 1.5×10⁶molecules cm−3
(Mao et al., 2009).
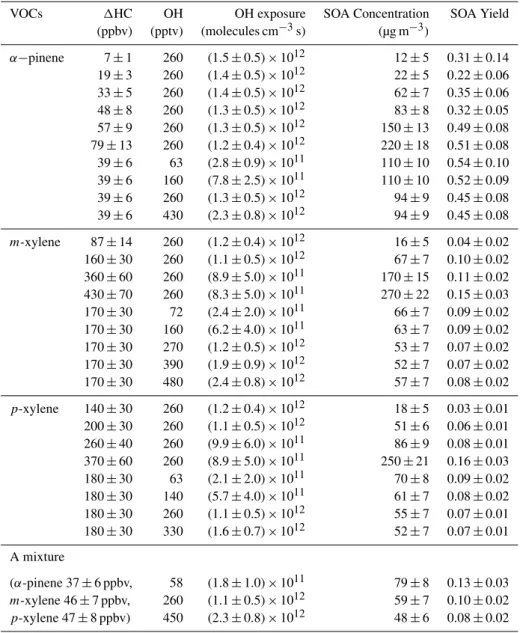
We performed two different types of experiments. The first examined the SOA oxidation as a function of precursor VOC amount and the second examined the SOA oxidation as a function of OH exposure. The detailed experimental con-ditions are presented in Table 1. All experiments were per-formed at a constant temperature of 25◦C with neither seed particles nor NOx. For experiments with various precursor VOC amounts, O3and final OH amount were kept constant at 9 ppmv and 260 pptv, respectively. Relative humidity was also controlled in the 23 to 25% range and temperature was kept constant at 25±1◦C. For experiments with various OH
amounts, O3was kept constant at 9 ppmv while OH was var-ied in the range of 63 pptv to 480 pptv by changing the rela-tive humidity over the range of 3 to 45%.
2.3 Instrumentation
Table 1. Experimental conditions of OH exposures, SOA concentrations and SOA yield for various conditions. SOA concentration was measured by a TEOM.
VOCs 1HC OH OH exposure SOA Concentration SOA Yield
(ppbv) (pptv) (molecules cm−3s) (µg m−3)
α−pinene 7±1 260 (1.5±0.5)×1012 12±5 0.31±0.14
19±3 260 (1.4±0.5)×1012 22±5 0.22±0.06
33±5 260 (1.4±0.5)×1012 62±7 0.35±0.06
48±8 260 (1.3±0.5)×1012 83±8 0.32±0.05
57±9 260 (1.3±0.5)×1012 150±13 0.49±0.08 79±13 260 (1.2±0.4)×1012 220±18 0.51±0.08
39±6 63 (2.8±0.9)×1011 110±10 0.54±0.10
39±6 160 (7.8±2.5)×1011 110±10 0.52±0.09
39±6 260 (1.3±0.5)×1012 94±9 0.45±0.08
39±6 430 (2.3±0.8)×1012 94±9 0.45±0.08
m-xylene 87±14 260 (1.2±0.4)×1012 16±5 0.04±0.02
160±30 260 (1.1±0.5)×1012 67±7 0.10±0.02
360±60 260 (8.9±5.0)×1011 170±15 0.11±0.02 430±70 260 (8.3±5.0)×1011 270±22 0.15±0.03
170±30 72 (2.4±2.0)×1011 66±7 0.09±0.02
170±30 160 (6.2±4.0)×1011 63±7 0.09±0.02
170±30 270 (1.2±0.5)×1012 53±7 0.07±0.02
170±30 390 (1.9±0.9)×1012 52±7 0.07±0.02
170±30 480 (2.4±0.8)×1012 57±7 0.08±0.02
p-xylene 140±30 260 (1.2±0.4)×1012 18±5 0.03±0.01
200±30 260 (1.1±0.5)×1012 51±6 0.06±0.01
260±40 260 (9.9±6.0)×1011 86±9 0.08±0.01
370±60 260 (8.9±5.0)×1011 250±21 0.16±0.03
180±30 63 (2.1±2.0)×1011 70±8 0.09±0.02
180±30 140 (5.7±4.0)×1011 61±7 0.08±0.02
180±30 260 (1.1±0.5)×1012 55±7 0.07±0.01
180±30 330 (1.6±0.7)×1012 52±7 0.07±0.01
A mixture
(α-pinene 37±6 ppbv, 58 (1.8±1.0)×1011 79±8 0.13±0.03 m-xylene 46±7 ppbv, 260 (1.1±0.5)×1012 59±7 0.10±0.02 p-xylene 47±8 ppbv) 450 (2.3±0.8)×1012 48±6 0.08±0.02
2.4 Determination of the total OA mass concentration
The SOA mass concentrations generated in the PAM cham-ber were directly measured by TEOM and compared with the OA mass concentrations that were calculated from the AMS mass spectrum analysis. The calculation of the OA mass con-centration depends on assumptions about which mass peaks contribute to the OAs.
The fragmentation table reported in Allan et al. (2004) was the basis for the calculation of OA mass concentration re-ported here. This table was modified to account for peaks that, in measurements of ambient aerosols, are dominated by air or by non-organic particulate compounds but, in these experiments with high OA mass concentrations, correlate
Table 2. The changes to Allan et al. (2004) fragmentation table used in this analysis.
m/z Allan et al. (2004) This analysis (range) 14 – (3.5–4.5)×fragorganic[13]∗ 16 0.04×fragorganic[18] (0.18-0.25)×fragorganic[44] 17 0.25×fragorganic[18] (0.31–0.45)×fragorganic[44] 18 1.0×fragorganic[44] (0.8–1.04)×fragorganic[44] 19 0.00128×fragorganic[18] 19−fragwater[19]−fragair[19] 20 0.002×fragorganic[18] (0.002–0.005)×fragorganic[44]
21 – 21
22 – 22
28 – (0.6–0.7)×fragorganic[43] or (0.8–0.9)×fragorganic[44] 30 0.022×fragorganic[29] (0.18–0.23)×fragorganic[29]
31 – 31
33 – 33
36 – 36
39 – (0.1–0.19)×fragorganic[43] 40 – 40−fragair[40] 46 – (0.03–0.06)×fragorganic[44]
47 – 47
48 0.5×fragorganic[62] (0.33–0.66)×fragorganic[62]
∗[m/z]: signals at the givenm/z.
chosen for the air beam reference for normalization to the AMS-standard pre- and post-experiment calibrations that employed ammonium nitrate aerosols. The signals atm/z 32 did not vary with OA mass concentration, indicating that this mass was suitable for tracking any drift in sensitivity or tuning of the quadrupole mass analyzer over the course of a series of experimental runs. A sample set of changes to the Allan et al. (2004) fragmentation table is shown in Table 2. The total OA mass concentration calculated here was about 25% greater than values obtained using the Allan et al. (2004) fragmentation table, due mostly to adjustments inm/z18 and m/z28 and inclusion ofm/z14, 39, and 40.
It is important to note here that in these experiments, for which expected products are pure organics and signals are much larger than in ambient measurements, it is relatively straightforward to account for the OA mass concentration. It is more difficult to account for OA mass concentration in am-bient measurements. Consequently, it is reasonable to com-pare values off43andf44from laboratory experiments (e.g., flow tubes or environmental chambers), but comparisons to ambient measurements (e.g., Ng et al., 2010) are more com-plicated. It is likely thatf43andf44 values calculated with modified fragmentation tables that account for all the OA mass concentration as described above will be systematically smaller than values calculated for ambient aerosols with stan-dard fragmentation tables.
Depending on the assignment ofm/zpeaks or fractions of m/zpeaks as organics, the calculated OA mass concentra-tions, thusf44 andf43, differs by as much as 15–25%. If f44 andf43 are to be used as generalized oxidation indica-tors and for comparing oxidation processes in different
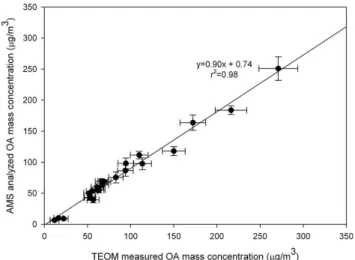
lab-Fig. 2. AMS-analyzed OA mass concentration compared with TEOM-measured OA mass concentration. Error bars for TEOM and AMS mass concentration are at the 1σ confidence level.
oratory and field studies, then the publication of each study should contain a description or reference of the determination of OA mass concentrations in order to make the comparisons among published studies valid.
The OA mass concentration calculated from this AMS spectrum analysis is in a good agreement with TEOM-measured aerosol mass concentrations with a slope of 0.90 andr2of 0.98 (Fig. 2). For these laboratory studies in which all the aerosol mass comes from the oxidation of VOCs, the OA mass concentration, as determined by the AMS analysis, should be the same as the total aerosol mass concentration, as determined by the TEOM. An AMS underestimation of the OA mass concentration could occur for three reasons: (1) the limited transmission of the AMS lens about 50∼1500 nm
in size, (2) evaporation of volatile components such as wa-ter and some light organics, and (3) potential particle bounce which results in less than 100% particle collection efficiency (Allan et al., 2004).
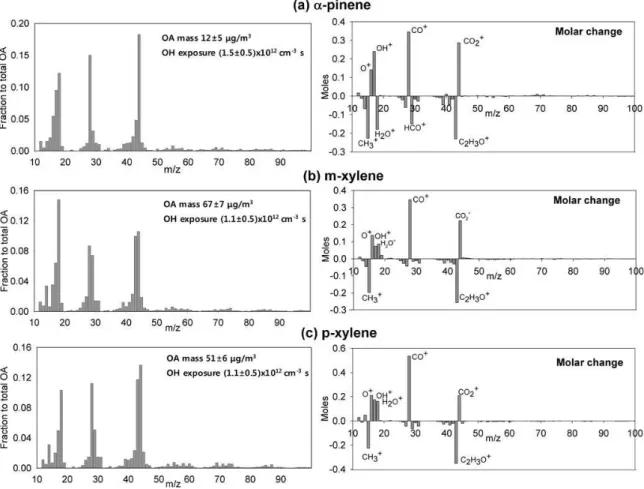
Fig. 3. The left panel represents the example of mass spectra of SOA for(a)7±1 ppbv ofα-pinene,(b)160±30 ppbv ofm-xylene, and
(c)200±30 ppbv ofp-xylene in the PAM chamber. OH exposure was 1.5x1012cm−3s for no VOC addition, and resulting OH exposures for each VOC amount are shown in the figure. The OH exposure includes the uncertainty error bars (2σ confidence level). All spectra are the quantitative fractional contribution to the total OA mass concentration. The right panel represents the observed fractional molar change as a function of increasingf44(e.g., OH exposure). Peaks are normalized to the y-intercept of thef44vs.f43plot (e.g., Fig. 6).
3 Results and discussion
3.1 Characteristics of SOA generated in a highly oxidizing environment
Examples of mass spectra of SOA formed in the PAM cham-ber for three VOCs at a constant OH are shown in Fig. 3. Overall, four dominant peaks were observed atm/z18, 28, 43, and 44. Fragments at higher molecular weights were observed (such as m/z 55, 57, 67, and/or higher m/z) but these individual peaks were smaller than the four dominant ones. The relatively high contribution ofm/z>50, for in-stance m/z57, 67, and 69, are commonly found for HOA and consist of unsaturated hydrocarbons, unsaturated alco-hols, unsaturated carbonyl groups, or freshly formed SOA from the urban plume or diesel exhaust. The dominance of m/z43 and 44 observed in these experiments is a charac-teristic of OOA that is commonly observed in rural or re-mote atmospheres, hours-to-days downwind on SOA sources
(Bahreini et al., 2005; Zhang et al., 2005; Ng et al., 2010). It is not surprising that the SOA in the PAM chamber re-semble OOA, since the smallest OH exposure in the PAM chamber is 1.8×1011cm−3s, equivalent to about 1.4 days
in the atmosphere, assuming an average OH concentration of 1.5×106cm−3.
For each precursor studied, there was a series of peaks that varied primarily withm/z43 and a different series that var-ied primarily with m/z44. There were a larger number of peaks that varied with bothm/z43 andm/z44, probably due to fragmentation of a common parent compound. The right panels in Fig. 3 show difference spectra obtained from a re-gression of the changes in individualm/zvalues as a func-tion of changing f44. A positive (or negative) value rep-resents a gain (or loss) of a particular mass with increas-ing f44. These difference spectra are remarkably similar and very simple: they reveal that with increased oxidation the condensed phase is enriched in species that fragment intom/z16, 17, 28, and 44 (e.g., the expected fragments of
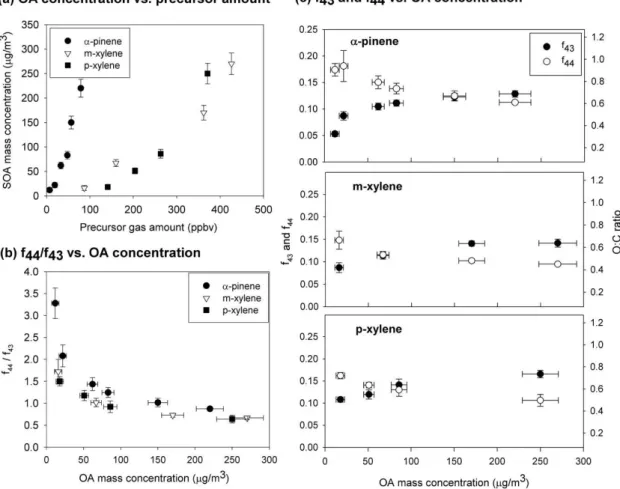
Fig. 4. SOA oxidation dependent on the OA mass concentration forα-pinene,m-xylene, and p-xylene. OH exposure was ranged be-tween (12±4.0)×1011 and (15±5.0)×1011cm−3s forα-pinene, (8.3±5.0)×1011 and (12±4.0)×1011cm−3s for m-xylene, and (8.9±5.0)×1011and (12±4.0)×1011cm−3s forp-xylene. OA mass concentration was measured by the TEOM. Error bars for SOA mass concentration,f43, andf44are at the 1σconfidence level.(a)Generated OA mass concentrations vs. precursor VOCs amount.(b)The ratio off44tof43vs. OA mass concentrations. (c)The values off44andf43 vs. the OA mass concentrations. O:C ratio was calculated fromf44values based on Aiken et al. (2008).
that fragment intom/z14, 15, 27, 29, and 43 (the expected fragments of−C2H3O and−CH3groups). For all three or-ganic precursors, the change in the O/C ratio is−1.0±0.05, strong evidence for an increase in the oxidation state of car-bon from +2 to +3 in response to OH exposure (i.e.,−CHx
O-groups), as opposed to just an increase in the number of oxi-dized carbon atoms in a particular compound. In the follow-ing discussions, the mass spectrum peaks atm/z43 andm/z 44 will be used as indicators of the relative oxidation of the SOA as the VOC type and amount or the OH exposure are varied.
3.2 Effect of OA mass concentration on the SOA oxidation
The dependence of SOA oxidation on OA mass concentra-tion was studied by varying the amounts of three VOCs: α-pinene, m-xylene, andp-xylene. O3 was kept constant at 9 ppmv and the final OH amount was fixed to 260 pptv,
resulting in the OH exposures in Table 1. The amount of α-pinene was varied from 7±1 to 79±13 ppbv, m-xylene from 87±14 to 430±70 ppbv, andp-xylene from 140±30 to 370±60 ppbv (Table 1). These mixing ratios are greater
than those found in the atmosphere, although the smallest α-pinene amounts are comparable to total VOC amounts in the atmosphere.
The OA mass yields are greatly different forα-pinene and the xylenes (m-xylene andp-xylene), but the fractions of m/z43 andm/z44 to the total OA mass concentration,f43 andf44, have almost the same dependence on the OA mass concentration (Fig. 4b and c). The ratio of f44 to f43 of xylenes was about 10–20% smaller than that ofα-pinene, but the decrease inf44/f43as the OA mass concentration in-creases is similar (Fig. 4b), with the difference that the OA mass concentration at whichf44/f43equals one is much less for xylenes. These results show that the amount of oxidation depends strongly on the OA mass concentration, especially for low OA mass concentrations. There is a rapid decrease inf44/f43with increasing OA below 50 µg m−3and a much smaller decrease at higher OA mass concentrations. For the lowestα-pinene mixing ratio, 7±1 ppbv,f44/f43is 3.2 and f44is 0.19, consistent with aged atmospheric OA (Ng et al., 2010, Fig. 5).
As the OA mass concentration increased, f43 increased and both f44 and atomic oxygen-to-carbon (O:C) ratios decreased (Fig. 4c). The O:C ratio was calculated us-ing the approximate correlation equation, O/C atomic ra-tio = (0.0382±0.0005)×(m/z 44/OA from this study (in
%)) + (0.0794±0.0070), from Aiken et al. (2008). The
O:C ratio forα-pinene in this study decreased from 0.8 to 0.5 for a range of OA mass concentrations of 12±5 to
220±18 µg m−3. Form-xylene andp-xylene, the ratio
de-creased from 0.7 to 0.4 for a range of OA mass concentra-tions within 16±5 and 270±22 µg m−3. Thesef44and O:C ratios are comparable to those observed in the atmosphere, where O:C ratios vary widely from 0.2 to 1.0 (Aiken et al., 2008; Jimenez et al., 2009; Ng et al., 2010). On the other hand, O:C ratios observed in environmental chambers and some flow tubes are less than 0.6 (Aiken et al., 2008; George and Abbatt, 2010; Ng et al., 2010), quite different from the atmosphere and from this study.
The decrease off44 and increase off43 with increasing OA mass concentration is significant. The decrease in the ratio off44 tof43with increasing OA mass concentration is another way to show this behaviour. One possible explana-tion for this behaviour is that more volatile and less oxidized organics are able to condense as the OA mass concentration increases (Donahue et al., 2006). As a result, an increasing fraction of the OA is less oxidized, thus shiftingf43up and f44down. The non-linear behaviour off44andf43as a func-tion of OA mass concentrafunc-tion (Fig. 4 (b) and (c)) must then be related to the volatility of the semi-volatile organics that are condensing. The cross-over point (i.e., wheref44andf43 are equal) form-xylene andp-xylene is at a lower OA mass concentration than forα-pinene, suggesting that the organics in the xylenes OA are less volatile and more oxidized than those in theα-pinene OA, a conclusion also reached by Ng et al. (2010).
The behaviour off44 as a function of OA mass concen-tration observed in this study is similar to the compilation of photo-oxidation and ozonolysis experiments in Ng et al.,
(2010). The difference between this study and the previous ones is thatf44 for this study is about twice as large as that measured in most studies at low OA mass concentrations and in all studies at mass concentrations greater than 50 µg m−3. Our study may get this result because the PAM chamber sam-ples the high OH exposure region off44andf43values. 3.3 Effect of OH exposure on the SOA oxidation
The effect of OH exposure on the SOA formation and oxidation was studied with different levels of OH expo-sure in the PAM chamber. Initial VOCs concentrations were 39±6 ppbv of α-pinene, 170±30 ppbv ofm-xylene,
180±30 ppbv ofp-xylene, and a mixture of 37±6 ppbv of
α-pinene, 46±7 ppbv of m-xylene and 47±8 ppbv of p-xylene. The OH exposure was varied by changing the rel-ative humidity. The effect of relrel-ative humidity itself on the SOA was found to be negligible for these precursor VOC gases (Kang et al., 2007). By changing the relative humid-ity over the range of 3 to 45%, the OH was changed from 63 pptv to 480 pptv, and the OH exposure was changed from (1.8±1.0)×1011cm−3s to (2.4±0.8)×1012cm−3s.
The OH exposure affected the OA mass concentration as well as the chemical characteristics (Fig. 5a). In a simple conceptual model of OA oxidation, the OA mass concentra-tion builds as the OH exposure begins and VOCs are oxidized to less volatile organics. With further oxidation, fragmenta-tion can occur, resulting in breaking carbon bonds and loss of OA mass concentration. Functionalization and oligomer-ization can also occur (Gross et al., 2006; Jimenez et al., 2009), but in this study functionalization was not the dom-inant process based on the O:C ratio increase and OA mass concentration decrease with oxidation, which is similar to the conclusion of Kroll et al. (2009) and Heald et al. (2010). In this study, oligomerization is difficult to study because of the extensive fragmentation by the Q-AMS.
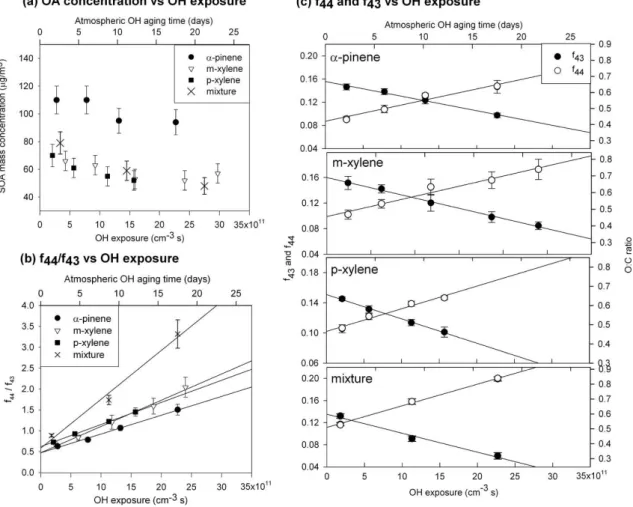
Fig. 5.SOA oxidation dependent on the OH exposure at a constant VOC amount of 39±6 ppbv ofα-pinene, 170±30 ppbv ofm-xylene, 180±30 ppbv ofp-xylene, and a mixture of three (37±6 ppbv ofα-pinene, 46±7 ppbv ofm-xlene, 47±8 ppbv ofp-xylene). OA mass concentration was measured by the TEOM. The error bars for OA mass concentration,f43, andf44are at the 1σ confidence level. Atmo-spheric OH aging time was obtained with a typical diurnally averaged OH concentration of 1.5×10⁶molecules cm−3(Mao et al., 2009). Uncertainties in the OH exposures are correlated so that the OH exposure scale could expand or shrink by the uncertainty ranges given in Ta-ble 1.(a)OA mass concentration vs. OH exposure.(b)The ratio off44tof43vs. OH exposures. Linear regressions of each lines are shown here; forα-pinene, slope = 4.50×10⁻¹³, intercept = 0.47, r2=0.99; form-xylene, slope = 6.29×10⁻¹³, intercept = 0.48,r2=0.99; for p-xylene, slope = 4.46×10⁻¹³, intercept = 0.64,r2=0.99; and for the mixture, slope = 1.17×10⁻¹², intercept = 0.58,r2=0.99. (c)The values off43andf44vs. OH exposures. O:C ratio was calculated fromf44values based on Aiken et al. (2008).
The ratio of f44 to f43 increased as the OH expo-sure increased for all experiments here (Fig. 5b). The measured range of the ratio of f44 to f43 was 0.63 to 3.3 for OH exposures of (1.8±1.0)×1011cm−3s to
(2.4±0.8)×1012cm−3s. The maximum values from large
environmental chambers are on the lower end of this mea-sured range; for instance, the ratios off44 tof43 were 0.6 for 160 ppbv of α-pinene photo-oxidation from Alfarra et al. (2006) and 0.5 for 186 ppbv ofα-pinene ozonolysis from Bahreini et al. (2005). The ratio off44 tof43 in rural area in British Columbia, Canada and the Jungfraujoch remote high-alpine locations were observed to be 1.7 (Alfarra et al., 2006). It varied from about 0.4 to more than 4.0 for measure-ments downwind of Mexico City and in Riverside CA (Ng et al., 2010). Thus, thef44/f43values observed in this study are
comparable to those observed in the atmosphere even though the SOA mass concentrations observed in this study are far greater than those observed in the atmosphere.
The changes inf44,f43, and f44/f43 are all linear with OH exposure. Linear regressions off44/f43 vs. OH expo-sure (Fig.5 b and c) gave slopes of 4.5x10⁻¹³cm3s−1for α-pinene, 6.3x10⁻¹³cm3s−1form-xylene, 5.3x10⁻¹³cm3s−1 forp-xylene, and 1.2×10⁻¹²cm3s−1for the mixture, with r2 values greater than 0.98 for all of them. The linear re-gressions of f44 vs. OH exposure gave slopes in the range of 2.5×10⁻¹⁴ to 3.9×10⁻¹⁴cm3s−1, while the linear
re-gressions of f43 vs. OH exposure gave slopes in the range of−2.5×10⁻¹⁴to−3.4×10⁻¹⁴cm3s−1, respectively. The
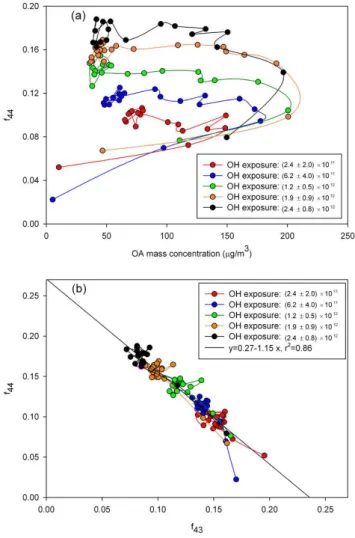
Fig. 6. Change in f44 and f43 over the course of m-xylene photo-oxidation experiment for various OH exposure conditions.
(a) Change in f44 as a function of OA mass concentrations,
(b)Change inf44as a function off43. Each data point is a one-minute measurement data by the Q-AMS. The OH exposure unit is cm−3s with uncertainty error bars (2σconfidence level).
asf57, is similarly linear with OH exposure, demonstrating that this behaviour applies to several AMS masses, not just m/z43 andm/z44.
From these experiments, it is not possible to distinguish between the gas-phase oxidation of semi-volatile organics that are in equilibrium with particle phase and the heteroge-neous oxidation of organics on the particle surface. Since the OH concentration, [OH], is simply the OH exposure divided by the PAM chamber residence time, the oxidation indicated by thef44 increase andf43 decrease is linear with [OH]. If the oxidation is occurring on the particle surface, then the surface reaction kinetics are linear with [OH] no matter what the exact surface reaction mechanism is. If the oxidation is occuring in the gas phase, then the reaction kinetics appear to be first-order in [OH]. This linearity holds for [OH] from 109cm−3to 1010cm−3; additional studies will be needed to
see if this linearity holds down to atmospheric levels of [OH] from 106cm−3to 107cm−3. Whether the oxidation occurs in the gas phase or on the particle, this observation suggests that the high levels of OH in the PAM chamber can possibly be used to simulate atmospheric oxidation.
Considering the differences in the oxidation pathways for α-pinene and the xylenes, it is noteworthy thatf44andf43, as indicators of OA oxidation, behave similarly as a function of OH exposure. This similarity suggests that the evolution of f44 andf43 are dominated by oxidation of the aliphatic groups attached to the aromatic rings, rather than to oxida-tion (and breaking) of the aromatic rings, since the latter pro-cess would lead to a more complex suite of compounds with differing molecular masses. It is therefore interesting that the behaviour off44andf43for the mixture ofα-pinene, m-xylene, andp-xylene is somewhat different from that of the individual precursor VOCs. The oxidation of the mixture oc-curs at a lower OH exposure, as indicated by the crossover of thef44andf43linear fits and the amount of oxidation ap-pears to be greater, as indicated byf44/f43. Yet at the same time, the OA mass concentration decreases similarly to the xylenes that make up 75% of the mixture. More experiments will be needed to understand these observations.
Additional insight into the OA oxidation can be gained from the behaviour of f44, f43, and OA mass concentra-tion during individual experiments using m-xylene photo-oxidation as an example (Fig. 6a). Photo-photo-oxidation in the PAM chamber was initiated by turning on the UV lamps only after the gases were flowing and the VOC was well mixed in the chamber. The lamps produce OH immediately, some-times with brief spikes according to photochemical models, and the final OH amount was reached as the lamps stabilized and the VOCs reacted away in a few minutes. Each point in Fig. 6 is a minute apart; the first point is the lowestf44value observed in each experiment. The high OH concentrations in the chamber rapidly oxidized the VOCs, resulting in the rapid increase of lower volatility organics that partition be-tween the gas and particle phases. For all OH exposures, the OA mass concentration reached a transient peak in 2–3 min and then decreased to the stable values. This transient peak is not understood, but may be related to OA non-linear oscil-latory nucleation and growth (McGraw and Saunders, 1984) and the competing processes of oxidation and evaporation, as will be described below.
forα-pinene, not shown, is qualitatively the same as for m-xylene, with similar peak values for different OH exposures, but with a slight decrease inf44between the transient peaks and stable values. This result suggests that microphysics (e.g., evaporation) and not the oxidation of condensed phase was responsible for the decrease in the OA mass concen-tration between the transient peak and the stable value. It also suggests that most of the oxidation had already occurred by the time the OA mass concentration had peaked. This behaviour provides evidence that the oxidation occurred in the gas-phase, followed by partitioning of the low volatility products between the gas and particle phases. The increase in oxidation degree in all of these experiments is seen in a graph off44vs.f43(Fig. 6b). All data plotted in Fig. 6a fall on a line with a slope of−1.15, and intercept of 0.27, and an r2of 0.86. For greater OH exposure,f44is higher andf43is lower, as was already shown in Fig. 5c. Note that even the transient values fall on this line.
3.4 Comparison of SOA oxidation with atmospheric values and other laboratory studies
It can be difficult to compare the effects of OH exposure from this study to those of other studies primarily because the initial precursor VOC type and concentrations are gener-ally different among the studies. However, if thef44vs. OH exposure linear fit form-xylene in this study is extrapolated to the OH exposure for the Caltech environmental chamber, the line could pass through the others’ observed data (Ng et al., 2010, Fig. 7). George and Abbatt (2010) observed the increase of f44 with OH exposure for the mono-dispersed SOA fromα-pinene ozonolysis, but the slope was about 1/3 of ours (George and Abbatt, 2010, Fig. 4). Why the OA were more efficiently oxidized in this study compared to theirs is not known, but the conditions between their study and ours are quite different. In their study, OA were produced from α-pinene by ozonolysis and then passed through an activated charcoal denuder to remove volatile and probably semi-volatile organics before being exposed to OH in a re-action flow tube. Thus, the greater amount of volatile and semi-volatile organics present during OH exposure in our study could explain the greater amount off44 observed. It could also be that differences in the aerosol mass spectrom-eters used in the two studies or in the calculation off44 and f43 are responsible for the different results. We come back to this point later.
A plot off44andf43 is a good indicator of the degree of SOA oxidation (Ng et al., 2010), as long as differences in the operation of the AMSs and in the calculation off44 and f43 are similar for the studies being compared. The results of this study are plotted along with those from atmospheric measurements and other laboratory studies (Fig. 7). All one-minute measurements from this study are plotted, both for studies with varying OA mass concentrations and with
vary-Fig. 7.A graph off44vs.f43. Red and black circles are 1-minute measurements from experiments with varying OA mass concentra-tions (black) and with varying OH exposure (red) in this study. Re-sults fromα-pinene photo-oxidation in the LBNL high-OH flow tube (approximated by a green dot-dashed line) and fromm-xylene photo-oxidation in the Caltech environmental chamber (approxi-mated by the orange rectangle) fall outside of the triangle (blue dashed lines) that contains atmospheric measurements (Ng et al., 2010).
ing OH exposures. A linear fit to this study’s results in Fig. 7 has a slope of −1.01, an intercept of 0.25, and an r2 of 0.72. The atmospheric measurements generally fall within the triangular space denoted by the dotted blue lines (Ng et al., 2010). Measurements of m-xylene photo-oxidation in the Caltech environmental chamber (orange rectangle) are consistent with the measurements from this study and fall just outside of the triangle. Measurements from a high-OH flow tube study at Lawrence Berkeley National Laboratory (LBNL) (Jimenez et al., 2009) have more f43 for a given f44than any of the other measurements. Thus, the measure-ments from this study fall just outside of the triangle for less oxidized OA and inside the triangle for more oxidized OA.
For our study, the sum off43 andf44 is 0.25±0.03 for essentially all one-minute measurements, independent of the type of study – varying OA mass concentration or varying OH exposure – and of the precursor gas – α-pinene, m-xylene,p-xylene, and even a mixture of them. That this sum does not change significantly suggests thatf43 andf44 are complete proxies for organic mass in the OA studied.
represent CH2CHO and CH3CO (both C2H3O) andm/z44 to represent CO+2 (or−COOH, which would readily form CO+2 by electron impact) from parent compounds with molecular weights ranging from 168 g mole−1 to 200 g mole−1. On a f44 vs. f43 plot, fragmentation of a single C2H3O group from pinonaldehyde would generate an x-intercept of 0.256, whereas fragmentation of CO+2 from pinic acid would result in a y-intercept of 0.238. Products with mixed C2H3O and COOH (and CO+2)functional groups would produce a mix ofm/z43 andm/z44 fragments that would lie along a line with a slope of -1.0 on thef44vs.f43plot. Thus, our results for oxidation ofα-pinene in the PAM chamber are consistent with the fragmentation of a single functional group with an increased yield of CO+2 (and COOH) groups at the expense of−CHxO – groups with increased OH exposure.
A similar conclusion can be drawn for the xylenes exper-iments, although it appears that there is less-than-unit frag-mentation intom/z43 andm/z44 groups or that there is a modest yield of a compound that does not formm/z43 orm/z 44 fragments upon electron impact ionization. Nevertheless, the progression from lower right to upper left along a straight line of slope−1.0 inf44vs.f43space in them-xylene exper-iments (e.g., Fig. 6) is also consistent with the same nature of increasing yield of CO+2 groups at the expense of C2H3O groups with increased OH exposure.
The differences between the LBNL study and this study are puzzling, since both of these studies used short residence times and OH and O3 concentrations far above atmospheric levels. The OH exposures in the LBNL study (0 to 3.0×1012cm−3s) are compara-ble to those from this study ((1.8±1.0)×1011cm−3s to (2.4±0.8)×x1012cm−3s). However, just as in George and Abbatt (2010), Jimenez et al. (2009) produced SOA from α-pinene ozonolysis and then removed volatile organics prior to adding the OA to the reaction flow tube. It is possible that these different conditions between their study and ours result in slightly different particle composition, which then produces differentf44andf43, although in the same propor-tion. However, it is also possible that the differences in the AMSs used in the two studies or in the calculations off44 andf43are responsible.
In Fig. 7, note that the line representing the LBNL result is roughly parallel to the results from this study. Our results in Fig. 7 can be made to overlap with the results from Jimenez et al. (2009) by shifting ourf44orf43values up by 0.07 or by shifting a combination of both by as little as 0.04. This par-allel shift could occur if the AMS used in the LBNL study were more efficient at fragmenting the OA organics intom/z 43 andm/z44. It could also occur if the calculation of the OA mass concentration was different from the calculation used in this study. In fact, using the fragmentation table that is com-monly applied to the atmosphere for our laboratory results yields a total OA mass concentration that is 25% less than the one we used. As a result, ourf44 andf43 values would shift to coincide with the LBNL results. Until there is
consis-tency in the methods of AMS operation and mass calculation, we cannot compare these results from different studies with much certainty.
4 Conclusions
In the first paper on the Potential Aerosol Mass method, we showed that the yields of OA from individual organic pre-cursor gases were similar to those obtained in large environ-mental chambers (Kang et al., 2007). In this study, we show that the extent of OA oxidation appears to be similar to that observed in the atmosphere and greater than that observed in large environmental chambers and laboratory flow tubes. The similarities between the OA in the atmosphere and the PAM chamber include the following properties: mass spec-tra;f44 of 0.10 to 0.18 and thus O:C of 0.4 to 0.8; f44/f43 of 0.4 to 3.2; and points on anf44vs.f43 plot that are close to or within the triangle containing results from atmospheric measurements. This statement is valid only for the few or-ganic precursor gasesα-pinene,m-xylene, andp-xylene, and a mixture of them. More studies will be necessary to see how universal these results are.
This study highlights the value of small flow-through photo-oxidation chambers, like the PAM chamber, for exam-ining the atmospheric oxidation of OA. The extreme oxidant amounts in the PAM chamber favors reactions of OH, HO2, and O3with VOCs and their reaction products, so that or-ganic peroxy radicals react only with HO2and not with each other as happens in the atmosphere. On the other hand, if most OA-producing and OA-aging reactions occur with OH, HO2, O3, and O2in the atmosphere, then the same oxidation reactions occur in the PAM chamber, only faster. While there is some evidence from another study that the OH levels are as important as the OH exposure, so that the slower oxidation of the atmosphere is different from the faster oxidation of the PAM chamber, the results from this study suggest otherwise. The comparisons of this study to others are subject to other caveats -the possible differences in the operation of the AMS (in particular, oven temperature) and the calculation of the OA mass concentration. In this paper, we provide an ex-plicit description of the calculation of the OA mass concen-tration. While similar descriptions or references to detailed descriptions have been provided in many published papers, they have not been provided in all. It would be very useful for future PAM-chamber studies to examine the sensitivity off44andf43to oven temperature and to assumptions nec-essary for calculating the total OA mass concentration. To a large degree, the ambiguities in calculating the total OA mass concentration from Q-AMS results are not an issue with the high-resolution TOF-AMS instruments.
not clear if the organics from other precursor organics would show the same behaviour in this PAM chamber. While the absolute values off43 andf44 are subject to the caveats in the previous paragraph, the slopes of linear regressions for f44 andf43 vs. OH exposure andf44 vs.f43 are not. The slope of−1 on thef44vs.f43plot and the constancy of the sum off44 andf43suggest that these two masses represent essentially all of the organics in the OA as they oxidize and shift from C2H3O groups to CO+2 groups forα-pinene, m-xylene, andp-xylene.
The linear regressions off44andf43measurements from some of other laboratory studies and the atmosphere have slopes quite similar to−1 on a plot off44vs.f43but some of them are not. These slopes could be different for a variety of reasons. If other processes are occurring, like the preferential removal of LV-OOA by clouds or surfaces for atmospheric OA or walls in the environmental chambers, then removal of organics contributing tof44 will reducef44 more thanf43, causing scatter in the plot. The slope could also change if fresh, less oxidized organics condense on more aged SOA, thus increasingf43 while decreasing f44, also resulting in scatter in the plot. Differences in the organic composition from the oxidation of different mixtures of precursor VOCs could also result in a different oxidation pathways, leading to different relationships betweenf44andf43(Ng et al., 2009, Fig. 6b). Likely there are many causes, especially in the atmosphere.
These conclusions suggest several lines of inquiry for fu-ture research. First, the determination of the OA mass con-centration has to be standardized in a way that permits mean-ingful comparisons among different studies. Second, the ox-idation of many other atmospheric VOCs, and indeed organ-ics in ambient air itself, needs to be studied to see how univer-sal this behaviour is, particularly the−1 slope forf44vs.f43 and the constancy of the sum of f44 and f43. Third, the causes of differences in the oxidation slopes need to be iden-tified, understood, and cataloged for importance to the real atmosphere. And fourth, comparisons must be made of all characteristics of SOA produced in the PAM chamber and in the atmosphere to test the ability of small, highly oxida-tive chambers to simulate the behaviour of SOA in the atmo-sphere.
Acknowledgements. This research is supported by NSF grant ATM-0518783 and the Korea Meteorological Administration Research and Development Program under CATER 2007-3204.
Edited by: D. Knopf
References
Aiken, A. C., DeCarlo, P. F., Kroll, J. H., Worsnop, D. R., Huff-man, J. A., Docherty, K. S.,Ulbrich, I. M., Mohr, C., Kimmel, J. R., Sueper, D., Sun, Y., Zhang, Q., Trimborn, A., Northway, M., Ziemann, P., Canagaratna, M. R., Onasch, T. B., Alfarra,
M. R., Pr´evˆot, A. H., Dommen, J., Duplissy, J., Metzger, A., Baltensperger, U., and Jimenez, J. L.: O/C and OM/OC ratios of primary, secondary, and ambient organic aerosols with High-Resolution Time-of-Flight Aerosol Mass Spectrometry, Environ. Sci. Technol., 42, 4478–4485, 2008.
Alfarra, M. R., Paulsen, D., Gysel, M., Garforth, A. A., Dommen, J., Prvt, A. S. H., Worsnop, D. R., Baltensperger, U., and Coe, H.: A mass spectrometric study of secondary organic aerosols formed from the photooxidation of anthropogenic and biogenic precursors in a reaction chamber, Atmos. Chem. Phys., 6, 5279– 5293, doi:10.5194/acp-6-5279-2006, 2006.
Allan, J. D, Alfarra, M. R, Bower, K. N., Williams, P. I., Gallagher, M. W., Jimenez, J. L., McDonald, A. G., Nemitz, E., Cana-garatna, M. R., Jayne, J. T., Coe, H., and Worsnop, D. R.: Quan-titative sampling using an Aerodyne Aerosol Mass Spectrome-ter. Part 2: Measurements of fine particulate chemical composi-tion in two UK Cities, J. Geophys. Res. Atmos., 108(D3), 4091, doi:4010.1029/2002JD002359, 2003.
Allan, J. D., Coe, H., Bower, K. N., Alfarra, M. R., Delia, A. E., Jimenez, J. L., Middlebrook, A. M., Drewnick, F., Onasch, T. B., Canagaratna, M. R., Jayne, J. T., and Worsnop, D. R.: Technical note: Extraction of chemically resolved mass spectra from Aero-dyne aerosol mass spectrometer data, Aerosol Sci., 35, 909–922, 2004.
Bahreini, R., Keywood, M. D., Ng, N. L., Varutbangkul, V., Gao, S., Flagan, R. C., Seinfeld, J. H., Worsnop, D. R., and Jimenez, J. L.: Measurements of secondary organic aerosol from oxidation of cycloalkenes, terpenes, andm-xylene using an Aerodyne aerosol mass spectrometer, Environ. Sci. Technol., 39, 5674–5688, 2005. Baltensperger, U., Dommen, J., Alfarra, M. R., Duplissy, J., Gaeggeler, K., Metzger A., Facchini, M. C., Decesari, S., Finessi, E., Reinnig, C., Schott, M., Warnke, J., Hoffmann, T., Klatzer, B., Puxbaum, H., Geiser, M., Savi, M., Lang, D., Kalberer, M., and Geiser, T.: Combined determination of the chemical com-position and of health effects of secondary organic aerosols: the POLYSOA project, J. Aerosol Med. Pulm. Drug. Deliv., 21(1), 145–154, 2008.
Canagaratna, M. R., Jayne, J. T., Jimenez, J. L., Allan, J. D., Al-farra, M. R., Zhang, Q., Onasch, T. B., Drewnick, R., Coe, H., Middlebrook, A., Delia, A., Williams, L. R., Trimborn, A. M., Northway, M. J., DeCarlo, P. F., Kolb, C. E., Davidovits, P., and Worsnop, D. R.: Chemical and microphysical characterization of ambient aerosols with the Aerodyne aerosol mass spectrometer, Mass Spectrom. Rev., 26, 185-222, 2007.
Chan, M. N., Chan, A. W. H., Chhabra, P. S., Surratt, J. D., and Seinfeld, J. H.: Modeling of secondary organic aerosol yields from laboratory chamber data, Atmos. Chem. Phys., 9, 5669– 5680, doi:10.5194/acp-9-5669-2009, 2009.
Donahue, N. M., Robinson, A. L., Stanier, C. O., and Pandis, S. N.: Coupled partitioning, dilution, and chemical aging of semivolatile organics, Environ. Sci. Technol., 40, 2635–2643, 2006.
L.: Evaluation of recently-proposed secondary organic aerosol models for a case study in Mexico City, Atmos. Chem. Phys., 9, 5681–5709, doi:10.5194/acp-9-5681-2009, 2009.
Faloona, I. C., Tan, D., Lesher, R. L., Hazen, N. L., Frame, C. L., Simpas, J. B., Harder, H., Martinez, M., Di Carlo, P., Ren, X., and Brune, W. H.: A laser-induced fluorescence instrument for detecting tropospheric OH and HO2: Characteristics and calibra-tion, J. Atmos. Chem., 139-167, 2004.
Forster, P., Ramaswamy, V., Artaxo, P., Berntsen, T., Betts, R., Fa-hey, D. W., Haywood, J., Lean, J., Lowe, D. C., Myhre, G., Nganga, J., Prinn, R., Raga, G., Schulz, M., and Van Dorland, R.: Changes in atmospheric constituents and in radiative forc-ing. in: Climate Change 2007: Contribution of working group I to the fourth assessment report of the Intergovernmental Panel on Climate Change, edited by: Solomon, S., Qin, D., Manning, M., Chen, Z., Marquis, M. K. B., Averyt, K. B., Tignor, M., and Miller, H. L., Cambridge University Press, Cambridge, 2007. George, I. J. and Abbatt, J. P. D.: Chemical evolution of secondary
organic aerosol from OH-initiated heterogeneous oxidation, At-mos. Chem. Phys., 10, 5551–5563, doi:10.5194/acp-10-5551-2010, 2010.
Gross, D. S., G¨alli, M. E., Kalberer, M., Pr´evˆot, A. S. H., Dom-men, J., Alfarra, M. R., Duplissy, J., Gaeggeler, K., Gascho, A., Metzger, A., and Baltensperger, U.: Real-time measure-ment of oligomeric species in secondary organic aerosol with the Aerosol Time-of-Flight Mass Spectrometer, Anal. Chem., 78, 2130–2137, 2006.
Hallquist, M., Wenger, J. C., Baltensperger, U., Rudich, Y., Simp-son, D., Claeys, M., D ommen, J., Donahue, N. M., George, C., Goldstein, A. H., Hamilton, J. F., Herrmann, H., Hoff-mann, T., Iinuma, Y., Jang, M., Jenkin, M. E., Jimenez, J. L., Kiendler-Scharr, A., Maenhaut, W., McFiggans, G., Mentel, Th. F., Monod, A., Pr´evˆot, A. S. H., Seinfeld, J. H., Surratt, J. D., Szmigielski, R., and Wildt, J.: The formation, properties and impact of secondary organic aerosol: current and emerging is-sues, Atmos. Chem. Phys., 9, 5155–5236, doi:10.5194/acp-9-5155-2009, 2009.
Heald, C. L., Kroll, J. H., Jimenez, J. L., Docherty, K. S., DeCarlo, P. F., Aiken, A. C., Chen, Q., Martin, S. T., Farmer, D. K., and Artaxo, P.: A simplified description of the evolution of organic aerosol composition in the atmosphere, Geophys. Res. Lett., 37, L08803, doi:10.1029/2010GL042737, 2010.
Hoyle, C. R., Myhre, G., Berntsen, T. K., and Isaksen, I. S. A.: An-thropogenic influence on SOA and the resulting radiative forcing, Atmos. Chem. Phys., 9, 2715–2728, doi:10.5194/acp-9-2715-2009, 2009.
Jang, M., Ghio, A. J., and Cao, G.: Exposure of BEAS-2B cells to secondary organic aerosol coated on magnetic nanoparticles., Chem. Res. Toxicol., 19(8), 1044–1050, 2006.
Jayne, J. T., Leard, D. C., Zhang, X., Davidovits, P., Smith, K. A., Kolb, C. E., and Worsnop, D. R.: Development of an Aerosol Mass Spectrometer for size and composition analysis of submi-cron particles, Aerosol. Sci. Tech., 33, 49–70, 2000.
Jimenez, J. L., Canagaratna, M. R., Donahue, N. M., Pr´evˆot, A. S. H., Zhang, Q., Kroll, J. H., DeCarlo, P. F., Allan, J. D., Coe, H., Ng, N. L., Aiken, A. C., Docherty, K. S., Ulbrich, I. M., Grieshop, A. P., Robinson, A. L., Duplissy, J., Smith, J. D., Wil-son, K. R., Lanz, V. A., Hueglin, C., Sun, Y. L., Tian, J., Laak-sonen, A., Raatikainen, R., Rautiainen, J., Vaattovaara, P., Ehn,
M., Kulmala, M., Tomlinson, J. M., Collins, D. R., Cubison, M. J., Dunlea, E. J., Huffman, J. A., Onasch, T. B., Alfarra, M. R., Williams, P. I., Bower, K., Kondo, K., Schneider, J., Drewnick, F., Borrmann, S., Weimer, S., Demerjian, K., Salcedo, D., Cot-trell, L., Griffin, R., Takami, A., Miyoshi, T., Hatakeyama, S., Shimono, A., Sun, J. Y., Zhang, Y. M., Dzepina, K., Kimmel, J. R., Sueper, D., Jayne, J. T., Herndon, S. C., Trimborn, A. M., Williams, L. R., Wood, E. C., Middlebrook, A. M., Kolb, C. E., Baltensperger, U., and Worsnop, D. R.: Evolution of organic aerosols in the atmosphere, Science, 326, 1525–1529, 2009. Kanakidou, M., Seinfeld, J. H., Pandis, S. N., Barnes, I., Dentener,
F. J., Facchini, M. C., Van Dingenen, R., Ervens, B., Nenes, A., Nielsen, C. J., Swietlicki, E., Putaud, J. P., Balkanski, Y., Fuzzi, S., Horth, J., Moortgat, G. K., Winterhalter, R., Myhre, C. E. L., Tsigaridis, K., Vignati, E., Stephanou, E. G., and Wilson, J.: Organic aerosol and global climate modelling: a review, At-mos. Chem. Phys., 5, 1053–1123, doi:10.5194/acp-5-1053-2005, 2005.
Kang, E., Root, M. J., Toohey, D. W., and Brune, W. H.: Introduc-ing the concept of Potential Aerosol Mass (PAM), Atmos. Chem. Phys., 7, 5727–5744, doi:10.5194/acp-7-5727-2007, 2007. Kroll, J. H. and Seinfeld, J. H.: Chemistry of secondary organic
aerosol: Formation and evolution of low-volatility organics in the atmosphere, Atmos. Environ., 42, 3593–3624, 2008. Kroll, J. H., Ng, N. G., Murphy, S. M., Flagan, R. C., and
Sein-feld, J. H.: Secondary organic aerosol formation from Isoprene photooxidation, Environ. Sci. Technol., 40, 1869–1877, 2006. Kroll, J. H., Smith, J. D., Che, D. L., Kessler, S. H., Worsnop, D. R.,
and Wilson, K. R.: Measurement of fragmentation and function-alization pathways in the heterogeneous oxidation of oxidized or-ganic aerosol, Phys. Chem. Chem. Phys., 11, 8005–8014, 2009. Lambe, A. T., Zhang, J., Sage, A. M., Donahue, N. M.: Controlled
OH radical production via ozone-alkene reactions for use in aerosol aging studies, Environ. Sci. Technol., 2357–2363, 2007. Lambe, A. T., Ahern, A. T., Williams, L. R., Slowik, J. G., Wong, J. P. S., Abbatt, J. P. D., Brune, W. H., Ng, N. L., Croasdale, D. R., Wright, J. P., Worsnop, D. R., Davidovits, P., and Onasch, T. B.: Characterization of aerosol photooxidation flow reactors: het-erogeneous oxidation, secondary organic aerosol formation and cloud condensation nuclei activity measurements, Atmos. Meas. Tech. Discuss., 3, 5211–5251, doi:10.5194/amtd-3-5211-2010, 2010.
Lanz, V. A., Alfarra, M. R., Baltensperger, U., Buchmann, B., Hueglin, C., and Pr´evˆot, A. S. H.: Source apportionment of submicron organic aerosols at an urban site by factor analyti-cal modelling of aerosol mass spectra, Atmos. Chem. Phys., 7, 1503–1522, doi:10.5194/acp-7-1503-2007, 2007.
Mao, J., Ren, X., Brune, W. H., Olson, J. R., Crawford, J. H., Fried, A., Huey, L. G., Cohen, R. C., Heikes, B., Singh, H. B., Blake, D. R., Sachse, G. W., Diskin, G. S., Hall, S. R., and Shetter, R. E.: Airborne measurement of OH reactivity during INTEX-B, Atmos. Chem. Phys., 9, 163–173, doi:10.5194/acp-9-163-2009, 2009
Res. Lett., 37, L24801, doi:10.1029/2010GL045258, 2010. Matsunaga, A. and Ziemann, P. J.: Gas-wall partitioning of organic
compounds in a Teflon film chamber and potential effects on reaction product and aerosol yield measurements, Aerosol. Sci. Tech., 44(10), 881–892, 2010.
Matthew, B. M., Middlebrook, A. M., Onasch, T. B.: Collection ef-ficiencies in an Aerodyne Aerosol Mass Spectrometer as a func-tion of particle phase for laboratory generated aerosols, Aerosol. Sci. Tech., 42(11), 884–898, 2008.
McGraw, R. and Saunders, J. H.: A condensation feedback mecha-nism for oscillatory nucleation and growth, Aerosol. Sci. Tech., 3, 367–380, 1984.
Myhre, G., Berglen, T. F., Johnsrud, M., Hoyle, C. R., Berntsen, T. K., Christopher, S. A., Fahey, D. W., Isaksen, I. S. A., Jones, T. A., Kahn, R. A., Loeb, N., Quinn, P., Remer, L., Schwarz, J. P., and Yttri, K. E.: Modelled radiative forcing of the direct aerosol effect with multi-observation evaluation, Atmos. Chem. Phys., 9, 1365–1392, doi:10.5194/acp-9-1365-2009, 2009.
Nel, A.: Air pollution-related illness: Effects of particles, Science, 308, 804–806, 2005.
Ng, N. L., Canagaratna, M. R., Zhang, Q., Jimenez, J. L., Tian, J., Ulbrich, I. M., Kroll, J. H., Docherty, K. S., Chhabra, P. S., Bahreini, R., Murphy, S. M., Seinfeld, J. H., Hildebrandt, L., Donahue, N. M., DeCarlo, P. F., Lanz, V. A., Pr´evˆot, A. S. H., Dinar, E., Rudich, Y., and Worsnop, D. R.: Organic aerosol components observed in Northern Hemispheric datasets from Aerosol Mass Spectrometry, Atmos. Chem. Phys., 10, 4625– 4641, doi:10.5194/acp-10-4625-2010, 2010.
NIST chemical Kinetics Database, Version 7.0, 2000.
Odum, J., Hoffmann T., Bowman F., Collins D., Flagan R., and Seinfeld, J. H.: Gas/particle partitioning and secondary organic aerosol yields, Environ. Sci. Technol., 30, 2580–2585, 1996. Poulain, L., Wu, Z., Petters, M. D., Wex, H., Hallbauer, E., Wehner,
B., Massling, A., Kreidenweis, S. M., and Stratmann, F.: To-wards closing the gap between hygroscopic growth and CCN activation for secondary organic aerosols - Part 3: Influence of the chemical composition on the hygroscopic properties and volatile fractions of aerosols, Atmos. Chem. Phys., 10, 3775– 3785, doi:10.5194/acp-10-3775-2010, 2010.
Root, M. J.: Determining the major oxidants in an environmental chamber, M. S. Thesis, The Pennsylvania State University, 2007.
Rudich, Y., Donahue, N. M., and Mentel, T. F.: Aging of organic aerosol: Bridging the gap between laboratory and field studies, Annu. Rev. Phys. Chem., 58, 321–352, 2007.
Shilling, J. E., Chen, Q., King, S. M., Rosenoern, T., Kroll, J. H., Worsnop, D. R., DeCarlo, P. F., Aiken, A. C., Sueper, D., Jimenez, J. L., and Martin, S. T.: Loading-dependent elemental composition ofα-pinene SOA particles, Atmos. Chem. Phys., 9, 771–782, doi:10.5194/acp-9-771-2009, 2009.
Surratt, J. D., Murphy, S. M., Kroll, J. H., Ng, N. L., Hildebrandt, L., Sorooshian, A., Szmigielski, R., Vermeylen, R., Maenhaut, W., Claeys, M., Flagan, R. C., and Seinfeld, J. H.: Chemical composition of secondary organic aerosol formed from the pho-tooxidation of Isoprene, J. Phys. Chem. A., 110, 9665–9690, 2006.
Volkamer, R., Jimenez, J. L., Martini, F. S., Dzepina, K., Zhang, Q., Salcedo, D., Molina, L. T., Worsnop, D. R., and Molina, M. J.: Secondary organic aerosol formation from anthropogenic air pollution: Rapid and higher than expected, Geophys. Res. Lett., 33, L17811, doi:10.1029/2006GL026899, 2006.
Warren, B., Song, C., and Cocker III, D. R.: Light intensity and light source influence on secondary organic aerosol formation for the m-xylene/NOx photooxidation system, Environ. Sci. Technol., 42, 5461–5466, 2008.
Wilson, W. E., Grover, B. D., Long, R. W., Eatough, N. L., and Eatough, D. J.: The measurement of fine particulate semivolatile material in urban aerosols, J. Air Waste Manage., 56, 384–397, 2006.
Zhang, Q., Alfarra, M. R., Worshop, D. R., Allan, J. D., Coe, H., Canagaratna, M. R., and Jimenez, J. L.: Deconvolution and quan-tification of hydrocarbon-like and oxygenated organic aerosols based on Aerosol Mass Spectrometry, Environ. Sci. Technol., 39, 4938–4952, 2005.