www.biogeosciences.net/12/513/2015/ doi:10.5194/bg-12-513-2015
© Author(s) 2015. CC Attribution 3.0 License.
Moderate forest disturbance as a stringent test for gap
and big-leaf models
B. Bond-Lamberty1, J. P. Fisk2, J. A. Holm3, V. Bailey4, G. Bohrer5, and C. M. Gough6
1Pacific Northwest National Laboratory, Joint Global Change Research Institute at the University of Maryland–College Park,
5825 University Research Court, Suite 3500, College Park, Maryland, MA 20740, USA
2Department of Geographical Sciences, 1150 LeFrak, University of Maryland, College Park, Maryland, MA 20742, USA 3Climate Sciences Department, Lawrence Berkeley National Laboratory, 1 Cyclotron Rd., MS 74-0171,
Berkeley, CA 94720, USA
4Pacific Northwest National Laboratory, 902 Battelle Boulevard, Richland, WA 99352, USA
5Department of Civil, Environmental and Geodetic Engineering, The Ohio State University, 470 Hitchcock Hall,
2070 Neil Avenue, Columbus, Ohio, OH 43210, USA
6Virginia Commonwealth University, Department of Biology, P.O. Box 842012, 1000 West Cary Street, Richmond,
VA 23284-2012, USA
Correspondence to:B. Bond-Lamberty ([email protected])
Received: 27 June 2014 – Published in Biogeosciences Discuss.: 21 July 2014
Revised: 10 December 2014 – Accepted: 11 December 2014 – Published: 27 January 2015
Abstract.Disturbance-induced tree mortality is a key factor regulating the carbon balance of a forest, but tree mortality and its subsequent effects are poorly represented processes in terrestrial ecosystem models. It is thus unclear whether mod-els can robustly simulate moderate (non-catastrophic) distur-bances, which tend to increase biological and structural com-plexity and are increasingly common in aging US forests. We tested whether three forest ecosystem models – Biome-BGC (BioGeochemical Cycles), a classic big-leaf model, and the ZELIG and ED (Ecosystem Demography) gap-oriented mod-els – could reproduce the resilience to moderate disturbance observed in an experimentally manipulated forest (the Forest Accelerated Succession Experiment in northern Michigan, USA, in which 38 % of canopy dominants were stem girdled and compared to control plots). Each model was parameter-ized, spun up, and disturbed following similar protocols and run for 5 years post-disturbance. The models replicated ob-served declines in aboveground biomass well. Biome-BGC captured the timing and rebound of observed leaf area in-dex (LAI), while ZELIG and ED correctly estimated the magnitude of LAI decline. None of the models fully cap-tured the observed post-disturbance C fluxes, in particular gross primary production or net primary production (NPP). Biome-BGC NPP was correctly resilient but for the wrong
reasons, and could not match the absolute observational val-ues. ZELIG and ED, in contrast, exhibited large, unobserved drops in NPP and net ecosystem production. The biologi-cal mechanisms proposed to explain the observed rapid re-silience of the C cycle are typically not incorporated by these or other models. It is thus an open question whether most ecosystem models will simulate correctly the gradual and less extensive tree mortality characteristic of moderate dis-turbances.
1 Introduction
Most North American forests are at some stage of recovery from either natural or anthropogenic disturbance (Pan et al., 2011). In the US upper Midwest and northeast, low-severity disturbance is increasing in frequency and extent in regional forests, which have regrown following stand-replacing dis-turbances over a century ago (Frelich and Reich, 1995). The resulting cohort of fast-growing, deciduous trees is now past maturity and beginning to decline, while longer-lived species representation is increasing (Gough et al., 2010b). At the same time, forest disturbances in the region are transition-ing away from severe events that historically caused com-plete stand replacement towards more subtle disturbances that result in only partial canopy defoliation or loss of se-lected species (Pregitzer and Euskirchen, 2004; Williams et al., 2012; Birdsey et al., 2006). These subtler disturbances in-clude partial harvests, wind, pathogenic insects, diseases, and age-related senescence (e.g., Caspersen et al., 2000), which contribute to a gradient of disturbance intensities across the landscape. Unlike stand-replacing disturbance, moderate dis-turbances tend to increase biological and structural complex-ity and, consequently, are expected to have entirely different functional consequences for ecosystems (Nave et al., 2011; Peters et al., 2013).
Moderate disturbances have mixed effects on successional trajectories of forest C production and storage (Birdsey et al., 2006; Knohl et al., 2002; Vanderwel et al., 2013). In many forests, C storage shows unexpected resilience or even resis-tance to partial canopy defoliation (Hicke et al., 2011; Gough et al., 2013; Mathys et al., 2013) or thinning (Granier et al., 2008). The reasons and mechanisms for different functional responses to moderate disturbance are not clear, but these re-sults have large potential implications, as the long-assumed future decline of production in aging stands is expected to reduce continental C sink strength (Birdsey et al., 2006). Re-cent empirical evidence indicates, however, that net ecosys-tem production (NEP, the ecosysecosys-tem carbon balance) may be sustained or even increase in older forests that experience moderate disturbance (Luyssaert et al., 2008). For example, NEP in the ∼100 yr old Harvard Forest has more than dou-bled in the last 18 years (Keenan et al., 2012). More broadly, recent syntheses of North America’s mixed temperate forests found no evidence for a substantial decline in NEP or net pri-mary production (NPP) with age (He et al., 2012; Amiro et al., 2010).
Many ecosystem-scale models, designed for and tested in early to mid-successional forests with low biological and structural complexity, can be expected to have trou-ble reproducing these results (Landsberg and Waring, 1997; Raulier, 1999; Law et al., 2003; Li et al., 2003; Zhao et al., 2009). Such models are typically developed from, and tested most thoroughly against, classic primary- and secondary-succession scenarios featuring stand-replacing or at least gap-size disturbances (Peters et al., 2013; Weng et al., 2012; Wang et al., 2014). Most model experiments using moder-ate (non-catastrophic) disturbance intensities have been
per-formed in the context of timber management, e.g., assessing the sustainability of harvesting for a particular ecosystem or region (e.g., Peng et al., 2002; Rolff and Ågren, 1999). As a result, it is unclear whether most ecosystem models will be able to correctly simulate naturally occurring disturbances in mature forests, which may be spatially more heteroge-neous and generally do not involve biomass removals. This is particularly important given the rapidly aging distribution of eastern US forests (USDA, 2013; Radeloff et al., 2012).
With moderate disturbances increasing in aging North American forests, and only an emerging understanding of the mechanisms underpinning such forests’ resilience to distur-bance, it is clearly important to understand how, and how well, forest models simulate these events. Doing so not only provides a quantitative assessment of model performance, but also may help identify knowledge gaps and processes missing or not properly implemented in ecosystem mod-els more generally. This study tested three forest ecosystem models – a classic big-leaf model and two gap models – to understand how well they reproduce observed resilience to moderate disturbance in an experimentally manipulated for-est and to explore specific mechanisms limiting model skill.
2 Methods
2.1 Site description
The study site is the University of Michigan Biological Sta-tion (UMBS, 45◦35.5′N, 84◦43′W), nested within a sec-ondary successional forest that is comprised of bigtooth aspen (Populus grandidentata), northern red oak (Quercus rubra), red maple (Acer rubrum), paper birch (Betula pa-pyrifera), and eastern white pine (Pinus strobus). Average overstory tree age in 2013 was 95 years. NEP in the unma-nipulated footprint of the UMBS control tower (US-UMBS) was 0.80–1.98 Mg C ha−1yr−1 from 1999 to 2006,
averag-ing 1.58 Mg C ha−1yr−1with substantial landscape variation (Gough et al., 2009). The forest was heavily logged in the late 1800s and early 1900s and disturbed by fire until 1923; its present-day plant composition is typical of many forests in the upper Great Lakes region (Gough et al., 2007).
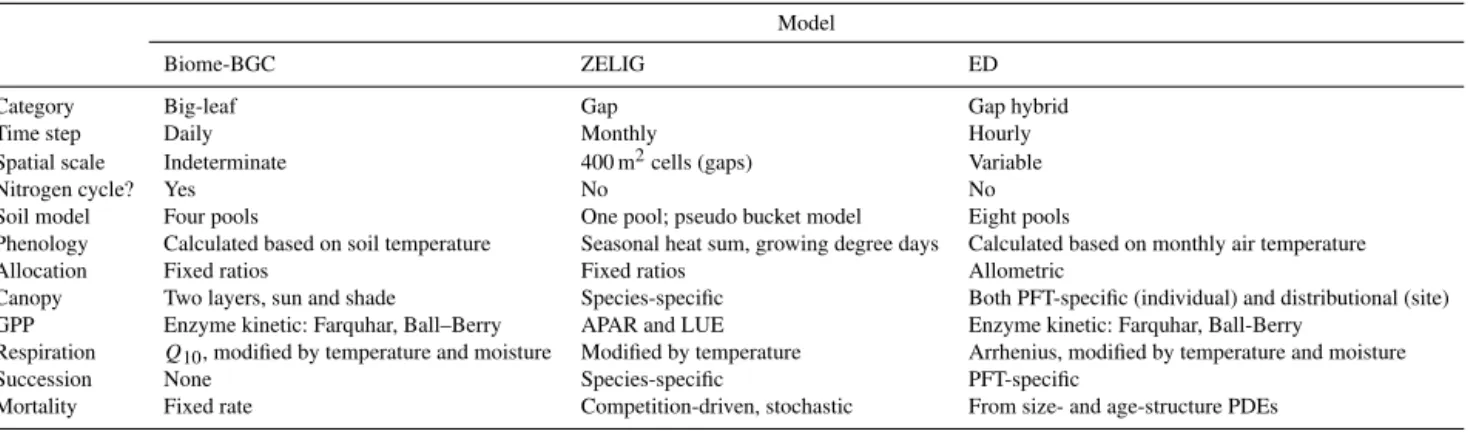
taken up by senescing aspen and birch trees is redistributed to other, longer-lived species assuming canopy dominance. The experiment employs a suite of paired C cycling mea-surements within separate treatment and control meteorolog-ical flux tower footprints. The C cycling parameters reported here for the control and treatment forests are aboveground biomass (AGB), gross primary production (GPP), ecosys-tem respiration (ER), leaf area index (LAI), total (above-and belowground) NPP, (above-and NEP. Site methodological ap-proaches for the derivation of each are described by Gough et al. (2013, 2008), but, briefly, AGB was estimated biomet-rically, using dendrometers and site-specific allometry; LAI from litter traps; NPP from biometry and fine root cores; and ER, GPP, and NEP (here treated as equivalent to net ecosys-tem exchange) from eddy covariance (Gough et al., 2013).
FASET results were most recently summarized by Gough et al. (2013). Briefly, the girdling treatment successfully ex-pedited the mortality of early successional aspen and birch, promoting an emerging canopy that approximates projected regional changes in forest composition and structure (e.g., Wolter and White, 2002). In the first 4 years following distur-bance, GPP and ER both initially rose in the treatment plots relative to the controls, while NPP and NEP were not sig-nificantly different in the control and treatment forests even though LAI in the latter declined by up to 44 % (summarized in Fig. 1). This high resilience of the C cycle was attributed to high N retention and rapid reallocation of this limiting re-source in support of new leaf area production as aspen and birch declined (Nave et al., 2011). Decadal records of tree growth indicate that resilience to age-related declines in NPP is highest where a diversity of canopy tree species is present because later successional species rapidly compensate for the declining growth of early successional species (Gough et al., 2010b). Investigators are also finding that resilience of forest production to disturbance is dependent upon canopy structural reorganizations that enhance C uptake by increas-ing light use efficiency (Hardiman et al., 2011; Gough et al., 2013) and by hydrodynamic responses that increase post-disturbance water use efficiency in some species (Matheny et al., 2015).
2.3 Model descriptions
We tested three complementary models for their ability to replicate disturbance-related changes in production and LAI observed in FASET; model attributes and differences are summarized in Table 1. The first was a version of Biome-BGC (BioGeochemical Cycles) (Running and Hunt, 1993; Thornton et al., 2002). This model has coupled water, carbon, and nitrogen cycles (Thornton et al., 2007), uses a Farquhar photosynthesis submodel linked to prognostic leaf area, and runs on a daily timestep. The model partitions NPP into the leaves, roots and stems using dynamic allocation patterns, accounting for nitrogen and water limitations. It has been widely used for simulating carbon flows in forest
ecosys-tems (Kimball et al., 1997; Pietsch et al., 2003; Tatarinov and Cienciala, 2009; Warren et al., 2011). We used a version of the model that incorporates an explicit disturbance mech-anism (Bond-Lamberty et al., 2007).
The second model tested was ZELIG, a gap model based on the original principles of the JABOWA (Botkin et al., 1972) and FORET (Shugart and West, 1977) models. ZELIG simulates the growth, death, and regeneration of individual trees (Urban, 1990; Urban et al., 1991) in a two-dimensional grid of 400 m2 cells (i.e., gaps) representing the forest
canopy. Trees in each cell influence the availability of re-sources in adjacent cells, although direct tree-to-tree interac-tions are not represented (Taylor et al., 2009). ZELIG’s main routines include growth, mortality, regeneration, and track-ing environmental conditions. In each model timestep, forest processes (e.g., seedling establishment rate, diameter incre-ment, survival rate) are reduced from their maximum poten-tial rates based on available resources. Potenpoten-tial tree regener-ation, growth, and survival are functions of light conditions, soil moisture, level of soil fertility resources, and temper-ature. The model runs on a monthly timestep. Specific de-tails on the methodical approaches used in the model can be found in Urban (1990), Urban et al. (1991) and Larocque et al. (2006). ZELIG has been applied over many large-scale and diverse landscapes (see list and further references in Holm et al., 2012).
The third model was ED (Ecosystem Demography), a ter-restrial biosphere model that uses size- and age-structure par-tial differenpar-tial equations (PDEs) (Moorcroft et al., 2001) to approximate the behavior of a stochastic gap model on medium to large scales. It combines an individual-based gap model, describing a particular plant community, with a biogeochemical simulation of carbon, water, and nitrogen fluxes. Modeled processes include leaf-level photosynthesis, explicit competition for water and mortality, and C and N al-location above- and belowground (Moorcroft et al., 2001). Much of the soil model is based on that of CENTURY (Par-ton et al., 1987). ED then models subgrid (∼10 ha) dis-turbance heterogeneity using its PDEs to approximate the behavior of a spatially distributed ensemble of individual plants, and it has been used for a variety of optimization and data assimilation exercises (Medvigy et al., 2009).
Table 1.Comparison of the models used in this study. LUE stands for light use efficiency, APAR stands for absorbed photosynthetically
active radiation, and PFT stands for plant functional type.
Model
Biome-BGC ZELIG ED
Category Big-leaf Gap Gap hybrid
Time step Daily Monthly Hourly
Spatial scale Indeterminate 400 m2cells (gaps) Variable
Nitrogen cycle? Yes No No
Soil model Four pools One pool; pseudo bucket model Eight pools
Phenology Calculated based on soil temperature Seasonal heat sum, growing degree days Calculated based on monthly air temperature
Allocation Fixed ratios Fixed ratios Allometric
Canopy Two layers, sun and shade Species-specific Both PFT-specific (individual) and distributional (site) GPP Enzyme kinetic: Farquhar, Ball–Berry APAR and LUE Enzyme kinetic: Farquhar, Ball-Berry
Respiration Q10, modified by temperature and moisture Modified by temperature Arrhenius, modified by temperature and moisture
Succession None Species-specific PFT-specific
Mortality Fixed rate Competition-driven, stochastic From size- and age-structure PDEs
25 50 75 100
8.0 8.5 9.0 9.5 10.0
11 12 13
2 3 4 5 6
2 3 4
4 5 6 7 8
(a) A
GB
(b) ER
(c) GPP
(d) LAI
(e) NEP
(f) NPP
2008 2010 2012
Year
Obser
v
ed v
alue Treatment
Control Disturbance
Figure 1. Observed data from FASET treatment and control forests. Panels include (a) aboveground biomass (AGB, in Mg C ha−1), (b)ecosystem respiration (ER, Mg C ha−1),(c)GPP (Mg C ha−1),(d)leaf area index (LAI, unitless),(e)net ecosystem production (NEP,
Mg C ha−1), and(f)net primary production (NPP, Mg C ha−1). Vertical shaded area shows approximate time of the girdling treatment described in the text. Error bars indicate±1 SD based on eight measurement plots (Gough et al., 2013). Control and treatment sites had
2.4 Parameters and optimization
Biome-BGC was subjected to a pre-experiment optimiza-tion exercise, with the goal of algorithmically adjusting its parameters, within observational ranges, such that model output best matched the pre-experiment carbon stocks and pools of the UMBS forest. The choice of parameters to in-clude was based on three factors: the known sensitivities of Biome-BGC (White et al., 2000); our a priori knowl-edge of the FASET research site and possible physiologi-cal mechanisms underlying forest resilience to disturbance (Gough et al., 2013); and known uncertainties in measured data (C. M. Gough et al., unpublished data). The final set of optimized parameters is shown in Table 2. Constrain-ing against observed C stocks can provide significant im-provements in model performance (Carvalhais et al., 2010); in this study, slow-turnover soil C, tree stem C, and NPP were used as constraining variables. For the parameter-space search itself we used a variant of the simplex algorithm (Nelder and Mead, 1965) that uses a randomly oriented set of basis vectors instead of fixed coordinate axes, as imple-mented (gsl_multimin_fminimizer_nmsimplex2rand) in Gnu Scientific Library version GSL-1.16 (Gough, 2009). For each combination of parameter values selected by the algorithm, Biome-BGC was “spun up”, i.e., its slow soil pools were brought to equilibrium, and the C pools noted above com-pared to observed soil C values. A linear cost function ranked model performance, imposing a large penalty if a parameter varied more than 2σ(based on expert judgment) from its ob-served mean.
ZELIG was parameterized with species-specific and site-specific parameters representative of the UMBS study site. The silvicultural and biological parameters for each of the eight temperate tree species required for ZELIG are listed in Table 3, with species data collected in previous studies (Larocque et al., 2006; Leemans and Prentice, 1989; Holm et al., 2013). Soil field capacity (cm) and wilting point (cm) were determined from measurements at the study site (un-published data). We used allometric equations to estimate aboveground biomass (AGB, Mg C ha−1), these were gener-ated from on-site harvests at the UMBS site or from general allometric equations typical of northeastern trees (Gough et al., 2008).
ED’s parameters were used from the versions developed for studying both anthropogenic and natural disturbance across US forests (Hurtt et al., 2002; Fisk et al., 2013). This configuration uses two tree functional types: a cold decidu-ous and an evergreen type. Allometric equations, leaf char-acteristics, and phenology parameters are described in Hurtt et al. (2002) and summarized in Table 4.
For the main modeling experiment, Biome-BGC and ZELIG were driven by identical reanalysis daily cli-mate (NCEP (National Centers for Environmental Predic-tion); Kanamitsu et al., 2002) from 1970–2012 data, with mean values of air temperature (5.1◦C) and precipitation
(575 mm yr−1). In contrast, ED used a climatology (i.e., with no year-to-year variation) comprised of the average monthly diurnal cycle for light, temperature and humidity, and mean monthly precipitation from the slightly warmer (mean 6.5◦C) North American Regional Reanalysis for 1979–2010 (NARR, 2013). We recognize that using differ-ent climatic inputs is not ideal, but Biome-BGC and ZELIG both took steps that made their results comparable to those of ED. For Biome-BGC, we used ensembling (Thornton et al., 2002) to characterize the mean climate and effect of inter-annual climate variability on model outputs, reporting model outputs as means±standard deviation computed by running the model starting with each successive year in the climate data. For ZELIG, each year the model stochastically gener-ated new monthly temperature and precipitation, based on the range provided by the NCEP data, thus also diminishing the effect of year-to-year variability in the input data. In sum-mary, all model results are reported based on mean climatic conditions, not exact year-to-year changes.
2.5 Modeling experiment
As far as possible, we used the same experimental protocol with each of the three models. The models were spun up, i.e., brought to a steady state with a mature forest, and then the entire site was clear-cut, with all trees removed, i.e., har-vested and the biomass taken away. This approximates the known stand-replacing disturbances of the early 20th cen-tury (Gough et al., 2007) in the UMBS forest. The models then allowed the forest to recover over 90 years before im-posing 13–14 % harvests of basal area (ED and ZELIG) and biomass (Biome-BGC) in 2008, 2009, and 2010. This ap-proach was used, as opposed to a single∼40 % cut in 2008, to better mimic the slow death of girdled trees observed over 2–3 years in the FASET study, as lagged mortality has been shown to exert a strong influence on the modeling of forest disturbances (Dietze and Matthes, 2014). None of the models allowed for tree girdling, and we used harvests as a second-best alternative; under this protocol, the models remove tree stems while allowing leaves and fine litter to decay on-site. This was consistent with our observations that girdled trees in FASET did not senesce at once and remained standing for multiple years without significantly decaying (Gough et al., 2013).
har-Table 2. Selected site-specific parameters used by Biome-BGC. Model inputs differ from observed values because of the optimization
procedure used (see Methods section).
Parameter Observed Model Units
value (±se) value
Fine root C : N ratio 77 77.0 kg C kg N−1 Fine root : leaf C allocation 1.18 1.14 Ratio Fraction of leaf N in Rubisco 0.12 Fraction Leaf C : N ratio 25±3.4 25.0 kg C kg N−1
Maximum stomatal conductance 0.03 0.0065 m s−1 Nitrogen deposition 0.00085 0.001 kg N m−2yr−1 Specific leaf area 19.42 m2kg C−1 Stem : leaf C allocation 1.16 1.16 Ratio Whole plant mortality fraction 0.014 0.015 1 yr−1
Table 3. Species-specific allometric and ecological parameters for the eight tree species used in ZELIG, representing species found in
the upper Great Lakes. Species shown includePopulus grandidentata(POGR),Betula papyrifera(BEPA),Quercus rubra(QURU),Pinus strobus(PIST),Acer saccharum(ACSA),Acer rubrum(ACRU),Populus tremuloides(POTR), andFagus grandifolia(FAGR). All species were assigned a probability factor of stress mortality of 0.369, a probability factor of natural mortality of 2.408, and a zone of seed influence of 200. Full explanations of all parameters can be found in the original ZELIG paper (Urban, 1990).
Species Agemax DBHmax HTmax G DegDmin DegDmax L D N RSER Stock
POGR 150 70 30 42 800 3169 4 5 2 0.82 0.8
PIST 450 150 37 68 800 3183 3 2 3 0.90 0.7
QURU 400 100 30 92 800 4903 2 3 2 0.44 0.7
ACRU 150 100 30 244 800 6986 2 2 1 0.56 0.8
BEPA 140 100 25 160 800 2500 4 3 3 0.33 0.2
FAGR 366 80 30 100 800 5894 2 2 2 0.44 0.5
ACSA 400 150 40.1 89 800 3200 1 2 2 0.30 0.4
POTR 150 75 37 158 889 5556 4 3 2 0.50 0.4
Key: Agemax– maximum age for the species (yr); DBHmax– maximum diameter at breast height (cm); HTmax– maximum height (m); G –
growth rate scaling coefficient; DegDmin– minimum growing degree day; DegDmax– maximum growing degree day; Light (L), Drought (D),
Nutrient (N) – light/shade tolerance class, maximum drought tolerance class, and soil nutrient tolerance class; RSER – relative seedling establishment rate; Stock – regeneration stocking.
vests used by the two other models. Although ED also tracks the dynamics of individual trees, the configuration used here was limited to two tree functional types (cf. Table 4). This precluded species-specific girdling; instead, 13–14 % of the basal area across all individuals was harvested annually for the 3-year period.
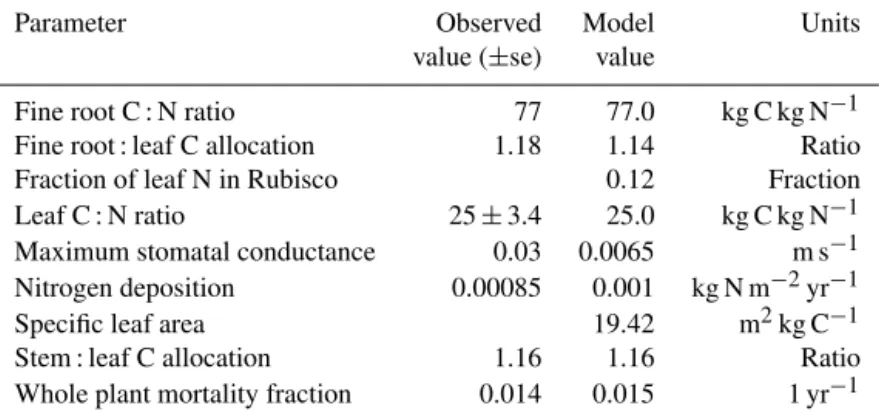
The disturbances occurred on 1 May in all models, repli-cating the timing of the girdling treatment just prior to spring leaf-out (Gough et al., 2013). We examined six primary model outputs at an annual resolution – GPP, ER, NPP, NEP (all these fluxes in Mg C ha−1yr−1), maximum LAI (unit-less), and aboveground biomass (Mg C ha−1) – comparing them to observed data for 0 to 4 years after disturbance. We particularly focused on the models’ structure and flux dy-namics, i.e., whether they could replicate the relative changes observed in FASET.
3 Results
Summarizing the models’ absolute performance provides a useful context for evaluating their relative changes dis-cussed below. Pretreatment (i.e., control plots in 2007–8) aboveground biomass and LAI were 81.2±25.4 Mg C ha−1 and 4.3±1.3, respectively (Fig. 1). The models’ com-parable values ranged from 51 (Biome-BGC) to 101 (ED) to 109 (ZELIG) Mg C ha−1 for biomass and 1.5 to 4.9 to 6.4 for LAI, respectively. Biome-BGC’s for-est, in other words, was significantly smaller than the ob-served data; ZELIG’s slightly larger; and that simulated by ED roughly comparable. Observed pretreatment gross primary production (GPP) was 12.2 Mg C ha−1yr−1, and
ecosystem respiration (ER) was 9.1 Mg C ha−1yr−1,
result-ing in net C fluxes of 6.6 and 2.2 Mg C ha−1yr−1 for NPP
Con-Table 4.Allometric and ecological parameters used in the ED model. The two plant functional types represent generic cold deciduous
hardwood and evergreen needleleaf trees, respectively.
Parameter Cold Deciduous Evergreen Units
Vmax 12.5 12.5 µ mol m−2s−1
Height computation∗ H=2.34D0.64 H=1.04D0.94 m (H) and cm (D)
Max height 35 35 m
Specific leaf area 18.2 5.5 m2kg C−1
Phenology temperature 10 – ◦C
Density-independent mortality 0.014 0.014 1 yr−1
∗Height (H, m) is computed based on DBH (D, cm).
trol forest NPP values of both Biome-BGC and ZELIG were low (2.6 and 3.7 Mg C ha−1yr−1, respectively), while ED was 8.2 Mg C ha−1yr−1. ZELIG was very close (2.1 Mg C ha−1yr−1)to the observed NEP value, with ED and
Biome-BGC much smaller (1.4 and 0.3 Mg C ha−1yr−1,
re-spectively). In summary, pretreatment carbon stocks and fluxes varied significantly among the models, with Biome-BGC consistently low – a smaller forest producing and se-questering less C. The other two models varied in their fi-delity to observations, with only ED able to achieve observed NPP, while ZELIG was closest to overall C balance, but nei-ther could achieve the high observed GPP values.
Aboveground biomass declined by 35–36 % between 2006 and 2010 in the FASET experiment. The models tracked this well (Fig. 2a), although the decline occurred more slowly be-cause of the protocol used in this modeling experiment (i.e., three successive years of 13–14 % cut instead of a single large girdling event). Leaf area index was less well repro-duced: ED and ZELIG came close to capturing the magni-tude of the observed decline (−30 and 33 %, respectively, compared to−37 to−44 % observed) but not the observed rebound of LAI by 2011 (Fig. 2d). Leaf area in Biome-BGC, in contrast, captured the timing and rebound of observed LAI but not its magnitude, as LAI only declined by 13 % in the model.
None of the models fully captured the main C flux dynam-ics observed in FASET. GPP initially rose in the treatment plots relative to the observed plots, but the models all sim-ulated GPP declines (Fig. 1c) of up to 5 % (Biome-BGC), 10 % (ED), and 14 % (ZELIG). The models also all produced modest ER declines for 2008–2010, whereas observed ER rose by 10 % relative to control values; this is perhaps not sur-prising, given that our modeling protocol removed “girdled” trees from the ecosystem. Observed net primary production did not significantly differ between treatment and control plots (Fig. 1f), but the models all exhibited NPP declines, by up to 3 % (Biome-BGC), 10 % (ED), and 14 % (ZELIG). All models’ treatment NPP had, however, recovered to con-trol levels by 2012 (Fig. 2f). Net ecosystem production was also unchanged in the observations, while Biome-BGC NEP declined by 23–27 % (Fig. 2e). ED and ZELIG recorded even
larger drops – of 79 and 43 %, respectively – although NEP had, like NPP, recovered to control levels 4 years following disturbance in all models.
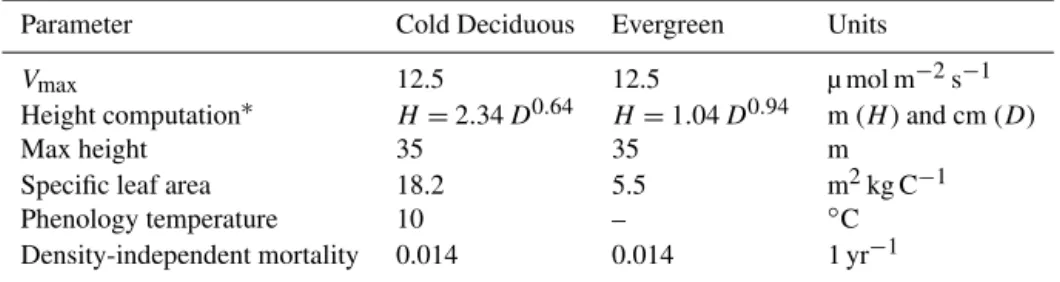
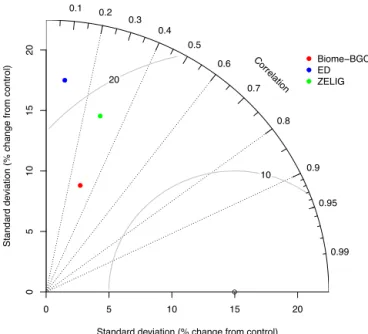
The models’ skill – i.e., how well they replicated both the magnitude and timing of all observed variables – is summa-rized in Fig. 3, a Taylor plot (Taylor, 2001) that is useful for summarizing both multiple aspects of complex models and relative skill. Here, all models exhibited low correlation (0.08–0.29) with observations, high root-mean-square differ-ence (9–18 %) between simulated and observed values, and high standard deviation, implying overall low model skill.
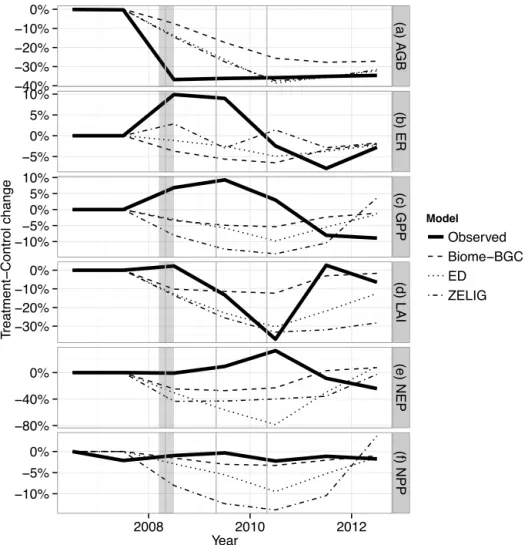
In ZELIG, aspen and birch exhibited low to moderate re-silience (i.e., full recovery to pretreatment basal area was not achieved) following moderate forest disturbance. The model also predicted which species thrived or declined post-disturbance (Fig. 4). Of the two treatment species that were girdled, aspen showed a stronger resilience and recovered to 71 % of pretreatment basal area after 4 years, increas-ing by 3.1 m2ha−1. In contrast, birch remained at
post-treatment basal area over the next 60 years, increasing by only 0.2 m2ha−1. The ZELIG forest became dominated by
red oak (Fig. 4), with that species’ basal area increasing nearly 2-fold, followed by sugar maple and white pine, which increased by 72 and 6 %, respectively. Thirty years after dis-turbance, the total basal area as predicted by ZELIG was 33.6 vs. 32.7 m2ha−1pretreatment, and recovery of basal area (a proxy for recovery of biomass) was achieved, even though ZELIG failed to capture the observed high resilience in C fluxes during the first 4 years after disturbance.
Similarly, the reduction in the number of individuals in ED resulted in a direct reduction in LAI, due to the strict allometric relationships used. Because NPP and NEP are so closely tied to LAI in ED, this resulted in low resistance to the disturbance event.
4 Discussion
−40%
−30%
−20%
−10%
0%
−5%
0% 5% 10%
−10%
−5%
0% 5% 10%
−30%
−20%
−10%
0%
−80%
−40%
0%
−10%
−5%
0%
(a) A
GB
(b) ER
(c) GPP
(d) LAI
(e) NEP
(f) NPP
2008 2010 2012
Year
T
reatment
−
Control change
Model
Observed Biome−BGC ED
ZELIG
Figure 2. Model performance in replicating the FASET experiment. Panels include (a) aboveground biomass (AGB, in Mg C ha−1), (b)ecosystem respiration (ER, Mg C ha−1),(c)GPP (Mg C ha−1),(d)leaf area index (LAI, unitless),(e)net ecosystem production (NEP,
Mg C ha−1), and(f)net primary production (NPP, Mg C ha−1), all expressed on a common normalized scale (relative change between treat-ment and control). Vertical shaded area shows approximate time of the girdling treattreat-ment described in the text. Vertical lines show May 1 forest harvests imposed in the Biome-BGC, ED, and ZELIG models.
NPP for forest stands across the upper Midwest, and found that increasing intensity had no effect on deciduous species but decreased evergreen NPP. Wang et al. (2014) also used PnET-CN and reported that measured and modeled evergreen needleleaf forests had lower resilience to disturbance than deciduous forests. This agrees with Biome-BGC’s behavior, in which broadleaf deciduous trees (such as simulated here) are less sensitive to moderate disturbance than are evergreen conifers (Thornton et al., 2002). The interaction of distur-bance intensity and forest resilience thus has both short- and long-term effects, presenting significant challenges to mod-els (Seidl et al., 2014; Dietze and Matthes, 2014).
4.1 Model mechanisms and behaviors
Gough et al. (2013) proposed several mechanisms support-ing sustained C uptake and storage (in particular the fluxes in NPP and NEP) after the FASET disturbance: enhancement
of canopy light use efficiency, maintenance of light absorp-tion as later successional species take advantage of increased light availability, and redistribution of N from senescent to early successional trees (Nave et al., 2011). The three mod-els used in this study are highly variable in their assumptions, parameters, and processes, and it is instructive to understand how and why each had difficulty reproducing the FASET re-sults with respect to these proposed mechanisms.
Standard deviation (% change from control)
Standard de
viation (% change from control)
0 5 10 15 20
0
5
10
15
20
10 20
● 0.1 0.2
0.3 0.4
0.5
0.6
0.7
0.8
0.9
0.95
0.99 Correlation
● ●
●
●
●
●
Biome−BGC ED ZELIG
Figure 3.Taylor diagram (Taylor, 2001) summarizing model skill
at predicting all (AGB, ER, GPP, LAI, NEP, NPP; cf. Fig. 1) ob-served data, normalized relative to the control forest. The standard deviation of the simulated data (colored by model) is gauged by the radial distance from the origin and can be compared to the observed data (circle on horizontal axis); model correlation to observations is found by azimuthal position; the curve contours show root mean square error (%).
Figure 4. Species-specific basal area trajectories simulated by
ZELIG, before and after the 2008–2010 tree removals mimicking the FASET experiment. Species codes are as in Table 1.
abiotic dynamics; FASET has already shown the assumption of a fixed LUE not to be true at the stand level (Gough et al., 2013). Recent work has also shown that the use of a spatially variable LUE parameterization, using C flux measurements from the Fluxnet data set, can significantly improve the ac-curacy of modeled GPP (Madani et al., 2014).
Maintenance of canopy light absorption in the FASET for-est depends on a structurally heterogeneous canopy so that
subdominant trees quickly increase their absorption follow-ing the girdlfollow-ing of canopy dominants (Gough et al., 2013). We would have expected, a priori, that ZELIG would be best able to simulate this dynamic, as it models a wide range of competing tree species, both early and late successional, competing in the same forest (Fig. 4). All models simulated small to moderate declines in both GPP and ER with distur-bance, in contrast to the small observational increases. The differences were generally small, however, and both fluxes are not direct observations but rather derived from tower measurements of ecosystem exchange, and they thus use less well constrained than NPP and NEP. For this reason we con-sider the models’ inability to replicate theabsoluteGPP and ER (which were 2–3 times higher than simulations) more troubling than their failure to exactly match the relative pat-terns shown in Fig. 2. NPP and NEP are better constrained observationally than are derived fluxes. Biome-BGC best maintained these fluxes with disturbance but for the wrong reason, i.e., too resilient a leaf area (Fig. 2b), rather than by increasing LUE when LAI declined in the FASET study. We note, however, that the Biome-BGC phenology submodel was quite accurate (cf. Gough et al., 2010a), a critical first step to accurately simulate stand C dynamics (Richardson et al., 2012).
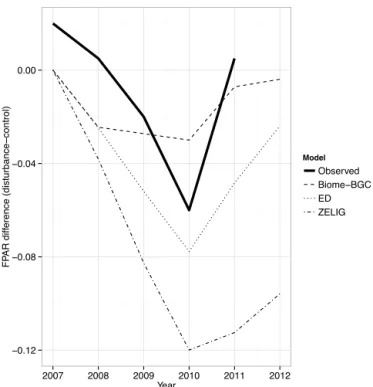
The proximal reason for Biome-BGC’s too strong re-silience is that the fraction of photosynthetically active ra-diation absorbed by the canopy, FPAR, does not diminish change linearly with LAI changes. Radiation transmission and absorption through canopies is a complex, computation-ally expensive process, and the three models studied here all use a common simplification: Beer’s law (Campbell and Nor-man, 1998), which models this process as an exponential de-crease downwards through the canopy. Biome-BGC, ZELIG, and ED also all assume a (mostly) equal extinction coeffi-cient, and this implies that the models’ FPAR declines theo-retically peaked at 3, 12, and 8 %, respectively (Fig. 5), com-pared to 6 % as measured in the field (Gough et al., 2013). The mathematical form of Beer’s law means that FPAR de-clines are smallest at low and high LAI values. For Biome-BGC, with its low-biomass forest, this meant relatively small FPAR declines with disturbance, small to moderate quanti-ties of stored C and N lost to disturbance, and enough stored C resources to fully leaf out the canopy and support photo-synthesis over the growing season.
and subdominant species could not contribute to an increase in NPP and NEP. Based on the current model structure of ZELIG, leaf production and leaf loss are tightly linked with NPP and NEP; therefore, the decline in LAI corresponded to a resulting decline in C fluxes.
In a separate study, ZELIG-TROP, a modified version of ZELIG that simulates tropical forests, was successful at replicating a nonsignificant change in NPP as a result of grad-ual, less extensive tree mortality (Holm et al., 2014). That study used a continual low-level elevated mortality rate as a treatment, i.e., doubling annual background mortality rate, and ZELIG-TROP predicted highly resilient NPP. However, following a one-time dramatic disturbance event (removing 20 % of basal area) NPP also declined, matching the modeled results seen here. Thus, the ZELIG results are characteristic of the model and not dependent on the particular forest type, soils, or climate of the FASET experiment.
In ED, despite the increase in light availability following disturbance, the remaining undisturbed trees were not able to respond sufficiently to offset NPP loss. This may be due in part to the limited number of plant functional types used here not representing the competition of early and late suc-cessional species. Additionally, ED’s scaling of individual trees to stand dynamics does not maintain the full level of canopy complexity, which may be required for resilience to a disturbance of this type.
Among the models tested here, nitrogen redistribution and limitation was only possible in Biome-BGC, as ZELIG lacks an N cycle, and ED’s integrated N cycle was not parame-terized or enabled in this study. Biome-BGC’s integrated N cycle encompasses N fixation, its deposition and leaching, plant growth, and microbial decomposition, and should, in theory, constrain C uptake in many circumstances (Thorn-ton et al., 2007). Such an effect was not noticeable here, however, as equal percentages of C and N were removed in the Biome-BGC disturbances (data not shown); this implies leaching/loss, i.e., a lack of N conservation as opposed to what was observed in FASET (Nave et al., 2011). This may also partly be an artifact, as all models used stem biomass removals to simulate the real-world girdling (although in Biome-BGC leaves were transferred to the litter pool, pro-viding some N reallocation). We speculate, however, that ex-cessive N limitation was a factor in the model’s inability to match the C stock and flux values of the UMBS forest.
In summary, the biological mechanisms proposed (Gough et al., 2013) to explain the carbon-cycle resilience of a mid-successional forest to disturbance are ones that most models either do not simulate (integrated C and N cycles, changing light use efficiency) or do so only crudely (canopy structure, heterotrophic respiration). At fine spatial scales, factors such as canopy structure can be simulated, but the computational demands are large and thus impractical for larger-scale mod-els (Caspersen et al., 2011), a consideration that inspired the development of models such as ED (Moorcroft et al., 2001). Similarly, how to translate the N recycling microbial
dynam-−0.12
−0.08
−0.04
0.00
2007 2008 2009 2010 2011 2012
Year
FP
AR diff
erence (disturbance
−
control)
Model
Observed Biome−BGC ED ZELIG
Figure 5.Effect of disturbance on fraction of photosynthetically
active radiation absorbed by the canopy (FPAR). Observed line is based on data from Fig. 4 in Gough et al. (2013). Model lines show implied (i.e., theoretical, based on Beer’s law) FPAR based on the observed and modeled leaf area index values and a common extinc-tion coefficient ofk= −0.45, the model mean.
ics into ecosystem- to global-scale models is an area of in-tense research (Wieder et al., 2013), as most models (includ-ing those tested here) use a few conceptual soil pools follow-ing simple first-order kinetics. C–N integration inside such models is increasingly common (Zaehle et al., 2014; Thorn-ton et al., 2007), enabling N redistribution and limitation dy-namics, and should improve future simulations of moderate disturbances.
5 Conclusions
ques-tion. This is particularly important as the moderate distur-bances associated with slow tree death (insect outbreaks, fun-gal pathogens) are on the rise worldwide (Allen et al., 2010) and in aging US forests. It is thus increasingly important to confront models with non-catastrophic disturbance scenar-ios.
Acknowledgements. B. Bond-Lamberty and V. L. Bailey were supported by the Office of Science of the US Department of Energy, as part of the Terrestrial Ecosystem Sciences Program. J. A. Holm was supported by Jeffrey Chambers for part of this work. C. M. Gough and FASET were supported by the Climate and Environmental Sciences Division, Office of Science, US Department of Energy (DOE) (Award No. DE-SC0006708) and by the Ameriflux Management Project (Flux 506 Core Site agreement No. 7096915) through Lawrence Berkeley National Laboratory. We acknowledge the University of Michigan Biological Station for infrastructure and logistics support and are grateful for the insightful comments of two anonymous referees.
Edited by: J. Xiao
References
Allen, C. D., Macalady, A. K., Chenchouni, H., Bachelet, D., McDowell, N. G., Vennetier, M., Kitzberger, T., Ringling, A., Breshears, D. D., Hogg, E. H., Gonzalez, P., Fensham, R., Zhang, Z., Castro, J., Demidova, N., Lim, J.-H., Allard, G., Run-ning, S. W., Semerci, A., and Cobb, N.: A global overview of drought and heat-induced tree mortality reveals emerging climate change risks for forests, Forest Ecol. Manage., 259, 660–684, doi:10.1016/j.foreco.2009.09.001, 2010.
Amiro, B. D., Barr, A. G., Barr, J. G., Black, T. A., Bracho, R., Brown, M., Chen, J. M., Clark, K. L., Davis, K. J., Desai, A. R., Dore, S., Engel, V., Fuentes, J. D., Goldstein, A. H., Goulden, M. L., Kolb, T. E., Lavigne, M. B., Law, B. E., Margolis, H. A., Martin, T. A., McCaughey, J. H., Misson, L., Montes-Helu, M. C., Noormets, A., Randerson, J. T., Starr, G., and Xiao, J.: Ecosystem carbon dioxide fluxes after disturbance in forests of North America, J. Geophys. Res.-Biogeosci., 115, G00K02, doi:10.1029/2010JG001390, 2010.
Birdsey, R. A., Pregitzer, K. S., and Lucier, A.: Forest carbon man-agement in the United States: 1600-2100, J. Environ. Qual., 35, 1461–1469, doi:10.2134/jeq2005.0162, 2006.
Bonan, G. B. and Levis, S.: Quantifying carbon-nitrogen feedbacks in the Community Land Model (CLM4), Geophys. Res. Lett., 37, L07401, doi:10.1029/2010GL042430, 2010.
Bond-Lamberty, B., Peckham, S. D., Ahl, D. E., and Gower, S. T.: The dominance of fire in determining carbon balance of the central Canadian boreal forest, Nature, 450, 89–92, doi:10.1038/nature06272, 2007.
Botkin, D. B., Janak, J. F., and Wallis, J. R.: Rationale, limitations and assumptions of a northeastern forest growth simulator, IBM J. Res. Dev., 16, 101–116, 1972.
Campbell, G. S. and Norman, J. M.: An Introduction to Environ-mental Biophysics, Springer-Verlag, New York, 286 pp., 1998.
Carvalhais, N., Reichstein, M., Ciais, P., Collatz, G. J., Ma-hecha, M. D., Montagnani, L., Papale, D., Rambal, S., and Seixas, J.: Identification of vegetation and soil carbon pools out of equilibrium in a process model via eddy covariance and biometric constraints, Global Change Biol., 16, 2813–2829, doi:10.1111/j.1365-2486.2010.02173.x, 2010.
Caspersen, J. P., Pacala, S. W., Jenkins, J. C., Hurtt, G. C., Moor-croft, P. R., and Birdsey, R. A.: Contributions of land-use history to carbon accumulation in US forests, Science, 290, 1148–1151, doi:10.1126/science.290.5494.1148, 2000.
Caspersen, J. P., Vanderwel, M. C., Cole, W. G., and Purves, D.: How stand productivity results from size- and competition-dependent growth and mortality, PLOS ONE, 6, e28660, doi:10.1371/journal.pone.0028660, 2011.
Dietze, M. C. and Matthes, J. H.: A general ecophysiological frame-work for modelling the impact of pests and pathogens on forest ecosystems, Ecol. Lett., 17, 1418–1426, doi:10.1111/ele.12345, 2014.
Fisk, J. P., Hurtt, G. C., Chambers, J. Q., Zeng, H., Dolan, K. A., and Negrón-Juárez, R. I.: The impacts of tropical cyclones on the net carbon balance of eastern US forests (1851–2000), Environ. Res. Lett., 8, 045017, doi:10.1088/1748-9326/8/4/045017, 2013. Franklin, J. F., Shugart, H. H., and Harmon, M. E.: Tree death as an
ecological process: the causes, consequences and variability of tree mortality, BioScience, 37, 55-0-556, doi:10.2307/1310665, 1987.
Frelich, L. E. and Reich, P. B.: Spatial patterns and succession in a Minnesota southern-boreal forest, Ecol. Monogr., 65, 325–346, 1995.
Goetz, S. J., Bond-Lamberty, B., Harmon, M. E., Hicke, J. A., Houghton, R. A., Kasischke, E. S., Law, B. E., McNulty, S. G., Meddens, A. J. H., Mildrexler, D., O’Halloran, T. L., and Pfeifer, E. M.: Observations and assessment of forest carbon recov-ery following disturbance in North America, J. Geophys. Res.-Biogeosci., 117, G02022, doi:10.1029/2011JG001733, 2012. Goodrich-Stuart, E. J., Curtis, P. S., Fahey, R. T., Vogel, C. S., and
Gough, C. M.: Forest net primary production exhibits a threshold response to increasing disturbance severity Ecosystems, submit-ted, 2015.
Gough, C. M., Vogel, C. S., Kazanski, C., Nagel, L., Flower, C. E., and Curtis, P. S.: Coarse woody debris and the carbon balance of a north temperate forest, Forest Ecol. Manage., 244, 60–67, doi:10.1016/j.foreco.2007.03.039, 2007.
Gough, C. M., Vogel, C. S., Schmid, H. P., and Curtis, P. S.: Multi-year convergence of biometric and meteorological estimates of forest carbon storage, Agric. Forest Meteorol., 148, 158–170, doi:10.1016/j.agrformet.2007.08.004, 2008.
Gough, C. M., Flower, C. E., Vogel, C. S., Dragoni, D., and Cur-tis, P. S.: Whole-ecosystem labile carbon production in a north temperate deciduous forest, Agric. Forest Meteorol., 149, 1531– 1540, doi:10.1016/j.agrformet.2009.04.006, 2009.
Gough, C. M., Hardiman, B., Nave, L. E., Bohrer, G., Maurer, K. D., Vogel, C. S., Nadelhoffer, K. J., and Curtis, P. S.: Sustained carbon uptake and storage following moderate disturbance in a Great Lakes forest, Ecol. Appl., 23, 1202–1215, doi:10.1890/12-1554.1, 2013.
Granier, A., Breda, N., Longdoz, B., Gross, P., and Ngao, J.: Ten years of fluxes and stand growth in a young beech for-est at Hesse, north-eastern France, Ann. For. Sci., 65, 704, doi:10.1051/forest:2008052, 2008.
Hardiman, B., Bohrer, G., Gough, C. M., Vogel, C. S., and Curtis, P. S.: The role of canopy structural complexity in wood net primary production of a maturing northern deciduous forest Ecology, 92, 1818–1827, doi:10.1890/10-2192.1, 2011.
Hardiman, B., Gough, C. M., Halperin, A., Hofmeister, K. L., Nave, L. E., Bohrer, G., and Curtis, P. S.: Maintaining high rates of car-bon storage in old forests: A mechanism linking canopy struc-ture to forest function, Forest Ecol. Manage., 298, 111–119, doi:10.1016/j.foreco.2013.02.031, 2013.
He, L., Chen, J. M., Pan, Y., Birdsey, R. A., and Kattge, J.: Re-lationships between net primary productivity and forest stand age in US forests, Global Biogeochem. Cy., 26, GB3009, doi:10.1029/2010GB003942, 2012.
Hicke, J. A., Allen, C. D., Desai, A. R., Dietze, M. C., Hall, R. J., Hogg, E. H., Kashian, D. M., Moore, D. J. P., Raffa, K. F., Stur-rock, R. N., and Vogelmann, J. E.: Effects of biotic disturbances on forest carbon cycling in the United States and Canada, Global Change Biol., 18, 7–34, doi:10.1111/j.1365-2486.2011.02543.x, 2011.
Holm, J. A., Shugart, H. H., Van Bloem, S. J., and Larocque, G. R.: Gap model development, validation, and application to succession of secondary subtropical dry forests of Puerto Rico, Ecol. Model., 233, 70–82, doi:10.1016/j.ecolmodel.2012.03.014, 2012.
Holm, J. A., Thompson, J. R., McShea, W. J., and Bourg, N. A.: Interactive effects of chronic deer browsing and canopy gap disturbance on forest successional dynamics, Ecosphere, 4, 44, doi:10.1890/es13-00223.1, 2013.
Holm, J. A., Chambers, J. Q., Collins, W. D., and Higuchi, N.: For-est response to increased disturbance in the central Amazon and comparison to western Amazonian forests, Biogeosciences, 11, 5773–5794, doi:10.5194/bg-11-5773-2014, 2014.
Hurtt, G. C., Pacala, S. W., Moorcroft, P. R., Caspersen, J. P., Shevli-akova, E., Houghton, R. A., and Moore III, B.: Projecting the future of the US carbon sink, P. Natl. Acad. Sci. USA, 99, 1389– 1394, doi:10.1073/pnas.012249999, 2002.
Kanamitsu, M., Ebisuzaki, W., Woollen, J., Yang, S.-K., Hnilo, J. J., Fiorino, M., and Potter, G. L.: NCEP–DOE AMIP-II Re-analysis (R-2), B. of the Am. Meteorol. Soc., 83, 1631–1643, doi:10.1175/BAMS-83-11-1631, 2002.
Keenan, T. F., Davidson, E. A., Moffat, A. M., Munger, J. W., and Richardson, A. D.: Using model-data fusion to interpret past trends, and quantify uncertainties in future projections, of terres-trial ecosystem carbon cycling, Global Change Biol., 18, 2555– 2569, doi:10.1111/j.1365-2486.2012.02684.x, 2012.
Kimball, J. S., Thornton, P. E., White, M. A., and Running, S. W.: Simulating forest productivity and surface-atmosphere car-bon exchange in the BOREAS study region, Tree Physiol., 17, 589–599, 1997.
Knohl, A., Kolle, O., Minayeva, T. Y., Milyukova, I. M., Vygod-skaya, N. N., Foken, T., and Schulze, E.-D.: Carbon dioxide exchange of a Russian boreal forest after disturbance by wind throw, Global Change Biol., 8, 231–246, 2002.
Landsberg, J. J. and Waring, R. H.: A generalised model of for-est productivity using simplified concepts of radiation-use effi-ciency, carbon balance and partitioning, Forest Ecol. Manage., 95, 209–228, doi:10.1016/S0378-1127(97)00026-1, 1997. Larocque, G. R., Archambault, L., and Delisle, C.: Modelling
for-est succession in two southeastern Canadian mixedwood ecosys-tem types using the ZELIG model, Ecol. Model., 199, 350–362, doi:10.1016/j.ecolmodel.2006.05.010, 2006.
Law, B. E., Sun, O. J., Campbell, J. S., Van Tuyl, S., and Thornton, P. E.: Changes in carbon storage and fluxes in a chronosequence of ponderosa pine, Global Change Biol., 9, 510–524, 2003. Leemans, R. and Prentice, I. C.: FORSKA: A general forest
succes-sion model, Meddelanden, Vaxtbiologiska institutionen, Vaxtbi-ologiska institutionen, Uppsala, Sweden, 2, 1–145, 1989. Li, Z., Apps, M. J., Kurz, W. A., and Banfield, E.: Temporal changes
of forest net primary production and net ecosystem production in west central Canada associated with natural and anthropogenic disturbances, Can. J. For. Res., 33, 2340–2351, doi:10.1139/x03-168, 2003.
Luyssaert, S., Schulze, E.-D., Börner, A., Knohl, A., Hes-senmöller, D., Law, B. E., Ciais, P., and Grace, J.: Old-growth forests as global carbon sinks, Nature, 455, 213–215, doi:10.1038/nature07276, 2008.
Madani, N., Kimball, J. S., Affleck, D. L. R., Kattge, J., van Bode-gom, P. M., Reich, P. B., and Running, S. W.: Improving ecosys-tem productivity modeling through spatially explicit estimation of optimal light use efficiency, J. Geophys. Res.-Biogeosci., 119, 1755–1769, doi:10.1002/2014JG002709, 2014.
Matheny, A. M., Bohrer, G., Vogel, C. S., Morin, T. H., He, L., Frasson, R. P. d. M., Mirfenderesgi, G., Schäfer, K. V. R., Gough, C. M., Ivanov, V. Y., and Curtis, P. S.: Species-specific transpiration responses to intermediate disturbance in a northern hardwood forest, J. Geophys. Res.-Biogeosci., in press, doi:10.1002/2014JG002804, 2015.
Mathys, A., Black, T. A., Nesic, Z., Nishio, G., Brown, M., Spittle-house, D. L., Fredeen, A. L., Bowler, R., Jassal, R. S., Grant, N. J., Burton, P. J., Trofymow, J. A., and Meyer, G.: Carbon balance of a partially harvested mixed conifer forest following mountain pine beetle attack and its comparison to a clear-cut, Biogeosciences, 10, 5451–5463, doi:10.5194/bg-10-5451-2013, 2013.
McDowell, N. G., Fisher, R. A., Xu, C., Domec, J.-C., Höltta, T., Mackay, D. S., Sperry, J. S., Boutz, A., Dickman, L. T., Gehres, N., Limousin, J. M., Macalady, A. K., Martínez-Vilalta, J., Men-cuccini, M., Plaut, J. A., Ogée, J., Pangle, R. E., Rasse, D. P., Ryan, M. G., Sevanto, S., Waring, R. H., Williams, A. P., Yepez, E. A., and Pockman, W. T.: Evaluating theories of drought-induced vegetation mortality using a multimodel–experiment framework, New Phytol., 200, 304–321, doi:10.1111/nph.12465, 2013.
Medvigy, D., Wofsy, S. C., Munger, J. W., Hollinger, D. Y., and Moorcroft, P. R.: Mechanistic scaling of ecosystem func-tion and dynamics in space and time: Ecosystem Demography model version 2, J. Geophys. Res.-Biogeosci., 114, G01002, doi:10.1029/2008JG000812, 2009.
Moorcroft, P. R., Hurtt, G. C., and Pacala, S. W.: A method for scaling vegetation dynamics: the Ecosystem Demography model (ED), Ecol. Monogr., 71, 557–586, doi:10.1890/0012-9615(2001)071[0557:AMFSVD]2.0.CO;2, 2001.
Nave, L. E., Gough, C. M., Maurer, K. D., Bohrer, G., Le Moine, J., Munoz, A. B., Nadelhoffer, K. J., Sparks, J. P., Strahm, B. D., Vogel, C. S., and Curtis, P. S.: Disturbance and the resilience of coupled carbon and nitrogen cycling in a north temperate forest, J. Geophys. Res.-Biogeosci., 116, G04016, doi:10.1029/2011JG001758, 2011.
Nelder, J. A. and Mead, R.: A simplex method for func-tion minimization, Computer Journal, 7, 308–313, doi:10.1093/comjnl/7.4.308, 1965.
Pan, Y., Chen, J. M., Birdsey, R., McCullough, K., He, L., and Deng, F.: Age structure and disturbance legacy of North Ameri-can forests, Biogeosciences, 8, 715–732, doi:10.5194/bg-8-715-2011, 2011.
Parton, W. J., Schimel, D. S., Cole, C. V., and Ojima, D. S.: Analysis of factors controlling soil organic matter levels in Great Plains grasslands, Soil Sci. Soc. Am. J., 51, 1173–1179, 1987. Peng, C., Jiang, H., Apps, M. J., and Zhang, Y.: Effects of harvesting
regimes on carbon and nitrogen dynamics of boreal forests in central Canada: a process model simulation, Ecol. Model., 155, 177–189, doi:10.1016/S0304-3800(02)00134-5, 2002.
Peters, E. B., Wythers, K. R., Bradford, J. B., and Reich, P. B.: In-fluence of disturbance on temperate forest productivity, Ecosys-tems, 16, 95–110, doi:10.1007/s10021-012-9599-y, 2013. Pietsch, S. A., Hasenauer, H., Kucera, J., and Cermák, J.:
Model-ing effects of hydrological changes on the carbon and nitrogen balance of oaks in floodplains, Tree Physiol., 23, 735–746, 2003. Potter, C. S., Klooster, S., Myneni, R. B., Genovese, V., Tan, P.-N., and Kumar, V.: Continental-scale comparisons of terrestrial car-bon sinks estimated from satellite data and ecosystem modeling 1982–1998, Global Planet. Change, 39, 201–213, 2003. Pregitzer, K. S. and Euskirchen, E. S.: Carbon cycling and
storage in world forests: biome patterns relating to forest age, Global Change Biol., 10, 2052–2077, doi:10.1111/j.1365-2486.2004.00866.x, 2004.
Radeloff, V. C., Nelson, E., Plantinga, A. J., Lewis, D. J., Helmers, D., Lawler, J. J., Withey, J. C., Beaudry, F., Martinuzzi, S., But-sic, V., Lonsdorf, E., White, D. C., and Polasky, S.: Economic-based projections of future land use in the conterminous United States under alternative policy scenarios, Ecol. Appl., 22, 1036– 1049, 2012.
Raulier, F.: Canopy photosynthesis of sugar maple (Acer saccha-rum): comparing big-leaf and multilayer extrapolations of leaf-level measurements., Tree Physiol., 19, 407–420, 1999. Richardson, A. D., Anderson, R. S., Arain, M. A., Barr, A. G.,
Bohrer, G., Chen, G., Chen, J. M., Ciais, P., Davis, K. J., De-sai, A. R., Dietze, M. C., Dragoni, D., Garrity, S. R., Gough, C. M., Grant, R. F., Hollinger, D. Y., Margolis, H. A., Mc-Caughey, J. H., Migliavacca, M., Monson, R. K., Munger, J. W., Poulter, B., Raczka, B. M., Ricciuto, D. M., Sahoo, A. K., Schaefer, K., Tian, H.-Q., Vargas, R., Verbeeck, H., Xiao, J., and
Xue, Y.: Terrestrial biosphere models need better representation of vegetation phenology: results from the North American Car-bon Program Site Synthesis, Global Change Biol., 18, 566–584, doi:10.1111/j.1365-2486.2011.02562.x, 2012.
Rolff, C. and Ågren, G. I.: Predicting effects of different harvesting intensities with a model of nitrogen limited forest growth, Ecol. Model., 118, 193–211, doi:10.1016/S0304-3800(99)00043-5, 1999.
Running, S. W. and Hunt, R. E.: Generalization of a forest ecosys-tem process model for other biomes, BIOME-BGC, and an ap-plication for global-scale models, in: Scaling Physiologic Pro-cesses: Leaf to Globe, edited by: Ehleringer, J. R. and Field, C. B., Academic Press, San Diego, CA, 141–158, 1993.
Sardans, J., Rivas-Ubach, A., and Peñuelas, J.: The C:N:P stoi-chiometry of organisms and ecosystems in a changing world: A review and perspectives, Perspectives in Plant Ecology and Evo-lution, 14, 33–47, doi:10.1016/j.ppees.2011.08.002, 2012. Seidl, R., Rammer, W., and Spies, T. A.: Disturbance legacies
in-crease the resilience of forest ecosystem structure, composition, and functioning, Ecol. Appl., 24, 2063–2077, doi:10.1890/14-0255.1, 2014.
Shugart, H. H. and West, D. C.: Development of an Appalachian deciduous forest succession model and its application to assess-ment of the impact of the chestnut blight, J. Environ. Manage., 5, 161–179, 1977.
Tatarinov, F. A. and Cienciala, E.: Long-term simulation of the effect of climate changes on the growth of main Central-European forest tree species, Ecol. Model., 220, 3081–3088, doi:10.1016/j.ecolmodel.2009.01.029, 2009.
Taylor, A. R., Chen, H. Y. H., and VanDamme, L.: A review of forest succession models and their suitability for forest management planning, Forest Science, 55, 23–36, 2009.
Taylor, K. E.: Summarizing multiple aspects of model performance in a single diagram, J. Geophys. Res., 106, 7183–7192, 2001. Thornton, P. E., Law, B. E., Gholz, H. L., Clark, K. L., Falge, E.,
Ellsworth, D. S., Goldstein, A. H., Monson, R. K., Hollinger, D. Y., Falk, M., Chen, J., and Sparks, J. P.: Modeling and measuring the effects of disturbance history and climate on carbon and water budgets in evergreen needleleaf forests, Agric. Forest Meteorol., 113, 185–222, doi:10.1016/S0168-1923(02)00108-9, 2002. Thornton, P. E., Lamarque, J.-F., Rosenbloom, N. A., and
Mahowald, N. M.: Influence of carbon-nitrogen cycle cou-pling on land model response to CO2 fertilization and climate variability, Global Biogeochem. Cy., 21, GB4018, doi:10.1029/2006GB002868, 2007.
Urban, D. L.: A Versatile Model to Simulate Forest Pattern: A User’s Guide to ZELIG Version 1.0., University of Virginia, Charlottesville, Virginia, 108 pp., 1990.
Urban, D. L., Bonan, G. B., Smith, T. M., and Shugart, H. H.: Spa-tial applications of gap models, Forest Ecol. Manage., 42, 95– 110, doi:10.1016/0378-1127(91)90067-6, 1991.
Vanderwel, M. C., Coomes, D. A., and Purves, D.: Quantifying variation in forest disturbance, and its effects on aboveground biomass dynamics, across the eastern United States, Global Change Biol., 19, 1504–1517, doi:10.1111/gcb.12152, 2013. Wang, W., Xiao, J., Ollinger, S. V., Desai, A. R., Chen, J., and
Warren, J. M., Pötzelsberger, E., Wullschleger, S. D., Thornton, P. E., Hasenauer, H., and Norby, R. J.: Ecohydrologic impact of re-duced stomatal conductance in forests exposed to elevated CO2, Ecohydrology, 4, 196–210, doi:10.1002/eco.173, 2011. Weng, E., Luo, Y., Wang, W., Wang, H., Hayes, D. J., McGuire,
A. D., Hastings, A., and Schimel, D. S.: Ecosystem carbon storage capacity as affected by disturbance regimes: A general theoretical model, J. Geophys. Res.-Biogeosci., 117, G03014, doi:10.1029/2012JG002040, 2012.
White, M. A., Thornton, P. E., Running, S. W., and Nemani, R. R.: Parameterization and sensitivity analysis of the BIOME-BGC terrestrial ecosystem model: net primary production controls, Earth Interact., 4, 3, 1–85, 2000.
Wieder, W. R., Bonan, G. B., and Allison, S. D.: Global soil carbon projections are improved by modelling mi-crobial processes, Nature Climate Change, 3, 909–912, doi:10.1038/NCLIMATE1951, 2013.
Williams, C. A., Collatz, G. J., Masek, J. G., and Goward, S. N.: Carbon consequences of forest disturbance and recovery across the conterminous United States, Global Biogeochem. Cy., 26, GB1005, doi:10.1029/2010GB003947, 2012.
Wolter, P. T. and White, M. A.: Recent forest cover type transitions and landscape structural changes in northeast Minnesota, USA, Landscape Ecol., 17, 133–155, 2002.
Zaehle, S., Medlyn, B. E., De Kauwe, M., Walker, A. P., Dietze, M. C., Hickler, T., Luo, Y., Wang, Y.-P., El-Masri, B., Thornton, P. E., Jain, A. K., Wang, S., Warlind, D., Weng, E., Parton, W. J., Iversen, C. M., Gallet-Budynek, A., McCarthy, H. R., Finzi, A. C., Hanson, P. J., Prentice, I. C., Oren, R., and Norby, R. J.: Evaluation of 11 terrestrial carbon–nitrogen cycle models against observations from two temperate Free-Air CO2 Enrichment stud-ies, New Phytol., 202, 803–822, doi:10.1111/nph.12697, 2014. Zhao, M., Xiang, W., Peng, C., and Tian, D.: Simulating