AUTOMATED DRUSEN GRADING
SYSTEM IN FUNDUS IMAGE USING
FUZZY C-MEANS CLUSTERING
Rama Prasath.A1,M.M.Ramya2
1,2
Chennai, India
Dept of Computer Applications, Hindustan Institute of Technology & Science 1
Abstract —Drusen are one of the early clinical findings in the development of age-related macular degeneration (ARMD), which causes irreversible vision loss. Automatic screening of individuals at risk may allow the detection of ARMD at an early stage, where it is curable. Detecting and locating the drusen in a color retinal image is a difficult task because they differ in shape, size, degree of confluence and texture. Hence, building a classifier for drusen identification is a challenging task. To address this difficulty an automated system for drusen detection is proposed with a goal of assessing the risk of the development of ARMD with increased accuracy while reducing the screening time. Our system was evaluated using fundus images, the proposed system initially detects and eliminates the optic disc as described in our previous work [1]. The system incorporates fundus image analysis techniques for image de-noising, illumination correction and normalization of contrast. A feature based fuzzy C-means clustering technique with a combination of multiresolution analysis using discrete wavelet transform (DWT), is proposed to improve the robustness of drusen detection. The gradient paths are labelled for calculating the area and location of the drusen spot. The proposed system was by comparing the drusen detected output images with the hand-labelled ground-truth images.
Keywords--Drusen Detection, Anisotropic diffusion filter, Adaptive histogram equalization, Discrete Wavelet Transform, Fuzzy C-means clustering
I. INTRODUCTION
ARMD is the most common cause of irreversible vision loss in people over the age of 65 around the world [2]. This disease progressively degrades macula, a specific part of the eye that allows us to see fine hidden details. The early stage of ARMD is drusen, accumulation of extra cellular materials under the retina. Though drusen are visible in fundus images the variation in size, shape and the intensity makes drusen in fundus image detection a challenging task. Their quantitative analysis is important in the follow up of ARMD. Evaluation in a sequence of images taken during a long-term treatment, helps to understand the progression of the disease and the effectiveness of treatment. This evaluation is difficult to reproduce manually. Drusen are categorized based on their size, (i) small drusen upto 63 µm, (ii) intermediate drusen, 63-125 µm and (iii) large drusen 125 µm [3]. The number, type and the area occupied by drusen yields important information about the ARMD severity.
Hence there is a need for an automated system that will enable to formulate a standard which in turn will improve the follow up of ARMD.
In the literature it has been found that there are various methods for detecting and quantizing drusen without human intervention. There are some methods which considers histogram based techniques for classification of drusen [4], where drusen are detected efficiently but it tends to over segment at the borders. Lee Brandon and Adam Hoover [5] classified an image using multilevel approach, that detects more evident drusen but more number of false positives arises at pixel level classification. A square region of interest with 400×400 pixels in the macula region is alone considered from an image size of 1000×650 based on image gradient that classifies drusen [6]. But, drusen above the boundary of macula region has not been considered for classification. Saurabh Garg et al. [7] used texture based drusen detection which is not reliable in detecting small and faint drusens. Levenberg-Marquardt methodology is used to model each drusen spot with a maximum processing time and it fails to model drusen when optic disc in the image is not clearly visible [8]. Konstantinos Rapantzikos et al. used Histogram based adaptive local thresholding technique to segment drusen spots but it fails to mark drusen that is located inside the bright background [9].
II. METHODS
Fig. 1. Block Diagram of Segmentation Algorithm
A. Channel Selection
The color fundus image is passed as an input to the proposed system. The channel with a maximum contrast will help in the detection of drusen, as drusen in a fundus image reside in the high frequency component. Therefore the channel which consist of more graininess passed as an input. Hence the contrast of each channel was calculated to decide upon the color channel selection for further processing. Contrast of R,G,B channels can be measured by low pass filtering an image using Weiner filter. Initially it tends to detect the blurriness of a picture which can be achieved by measuring the change in contrast of the original image and the low pass filtered image. In frequency domain the image can be expressed as
( )
( ) ( )
( ) ( )
u
v
H
u
v
S
( )
u
v
G
( )
u
v
S
v
u
S
v
u
H
v
u
f
n f
f
,
,
,
,
,
,
*
,
ˆ
2
+
=
( )1 Input Retinal ImageChannel Selection
Non-Uniform Illumination Correction
Contrast Enhancement
Highest graininess channel
Discrete Wavelet Transform
Fuzzy C-means Clustering
Cluster Labeling
Edge Detection
Image Fusion Small
Drusen
Intermediate Drusen
Large Drusen
Approximation Coefficient
( )
( )
( )
( )
( )
G
( )
u
v
v
u
S
v
u
S
v
u
H
v
u
H
v
u
f
f n,
,
,
,
,
*
,
ˆ
2
+
=
( )2
( )
( )
( )
( )
( )
( )
( )
u
v
G
v
u
S
v
u
S
v
u
H
v
u
H
v
u
H
v
u
f
f n,
,
,
,
,
,
1
,
ˆ
2 2
+
=
( )3where
H
( )
u
,
v
is a degradation function,H
*
( )
u
,
v
is a complex conjugate ofH
( )
u
,
v
,H
( )
u
,
v
2 is the product ofH
*
( )
u
,
v
andH
( )
u
,
v
,S
f( )
u
,
v
is the power spectrum of the undegraded image andS
n( )
u
,
v
isthe power spectrum of noise and
G
( )
u
,
v
is the transform of the degraded image. B. Non Uniform Illumination CorrectionThe images captured by the fundus camera normally suffer with non-uniform illumination. There are some factors that affect the detection of abnormalities, such as patient’s eye alignment, retina pigmentation, and presence of cataract. As a result drusen in one region are brighter than the other, which makes the classification difficult. The nonlinear diffusion process have been used in preserving edges. It reduces the diffusivity between the background and the drusen [10]. A non-linear diffusion equation proposed by Perona and Malik in the form of
(
g
u
)
u
div
u
t
=
∇
∇
∂
2( )4 with g being a decreasing function of the gradient,
∇
u
is the image gradient, t is an artificial time parameter,∇
u
is a gradient magnitude andg
∇
u
2 is an edge stopping function. The function should satisfy( )
x
→
0
g
whenx
→
∞
so the diffusion is stopped across edges. The diffusivity used is( )
;
(
0
)
1
1
2 2 2>
+
=
λ
λ
s
s
g
( )5where
λ
is a gradient threshold parameter. C. Contrast NormalizationThe non-uniform illumination corrected fundus image often has a low contrast due to various factors such as non-ideal acquisition condition. This is evident from their histogram that are concentrated only to certain gray levels. Due to the low contrast the drusen resemble to smudge with the background and hence are not clear to the doctors. This may lead to wrong diagnosis. Hence contrast normalization is necessarily considered to be an important pre-processing step. Histogram equalization, though widely, used was not preferred here as it does not focus on minor contrast differences which are very common in fundus images. Hence emphasis is more on local contrast than global contrast, to solve this problem an adaptive function is required to normalize the contrast [11, 12]. Hence contrast limited adaptive histogram equalization (CLAHE) is preferred for enhancing the contrast of the fundus image in proposed study. This techniques does not operate on an entire image rather it performs its operations on small regions in an image. It further redistributes the pixel intensities in order to equalize their distribution across the specified intensity range. Adaptive Histogram Equalization (AHE) helps to highlight the finer hidden details like drusen, and blood vessels present in a fundus image.
D. Discrete Wavelet Transform
( )
∑
( )
( )
∑∑
∞( )
= Ψ + = 0 00 , , ( )
j j k k j j k j
j k x d k x
c x
f ϕ ( )6 where j0 is an arbitrary starting scale, ψ(x) is the wavelet, φ(x) is the scaling function, cj0(k) is the approximation coefficient and dj
E. Fuzzy C-Means Clustering
(k) is the detail coefficient. If the function is expanded in discrete, the resulting coefficients are called discrete wavelet transform. The given function can be analyzed at various levels of resolution by using the wavelets. The retinal abnormalities can be efficiently analysed with different resolutions using the wavelets.
Fuzzy C-means clustering allows a single region of an image to be in two or more clusters by assigning varying degree of membership to each pixel of an image. It acts on minimizing the objective function and starts with fuzzy pixel classification to segment an image.
∞
≤
≤
−
=
∑
∑
= =m
c
x
u
J
ijm i jC
j N
i
m
,
1
2
1 1
( )7
Where m is any real number greater than 1,
u
ij is the degree of membership ofx
i in cluster j,x
i is the ith ofd-dimensional measured data,
c
jis the d-dimensional center of the cluster [14]. Algorithmic steps for Fuzzy C-Means clustering is listed below1. Randomly select clusters centers and Initialize
U
=
[ ]
u
ij matrix, U 2. Compute the fuzzy centre(0) j
c
using m ij N i i m ij N i ju
x
u
c
∑
∑
= ==
1 1.
( )8
3. Compute the fuzzy membership
u
ij, update U (k)and U (k+1) 1 2 1
1
− =
−
−
=
∑
m k i j i C k ijc
x
c
x
u
( )94. If
U
(k+1)−
U
(k)<
δ
whereδ
is a termination criterion between [0, 1] then stop, Otherwise return to step 2.Fuzzy C-means clustering gives a better segmentation in the regions where the drusens and the background overlap. The clustered image is then modelled for quantifying the drusen.
F. Drusen Labelling
The drusen with high intensity will normally fall in the last cluster two clusters and it should be properly labelled that helps to calculate the area of individual drusen. Labelling the binary image B can be written as
N
B
g
:
→
where g(x,y) is described as(
)
(
(
)
)
∈
=
=
k k b bC
y
x
p
if
l
F
y
x
B
if
F
y
x
g
,
,
,
( )10where k defines the total number of connected components,
l
k be a new label,C
k be the connectedcomponent, each pixels
p
∈
B
corresponds to the backgroundF
b or foregroundF
f respectively. Itproperly labelled then the number of drusen can be calculated using the area property of connected components
k
C
from the labelled matrix.The number of pixels that share a same label helps to calculate the area of each drusen. The overall sum of areas gives the information on the progression of disease. Drusen can be graded as large, medium and small drusen according to the area (number of pixels) that have been calculated from the labelled drusen.
III.RESULTS AND DISCUSSION
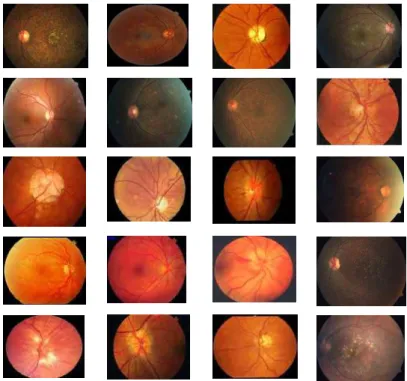
The images used for the proposed methodology were collected from Aravind Eye Hospital, Madurai. The proposed method is implemented in MATLAB. Fig.2 shows few images that were used for the proposed study.
Fig .2. Image used for drusen detection.
The contrast value of the RGB channel image enabled us to select the appropriate channel for further processing. Fig 3 shows the graininess value of R, G, B channels and their respective images.
Fig .3.Graininess value of R,G,B Channels.
A visual comparison of the images in Fig.3 shows that, the channel (Green) enables us to classify drusen efficiently from the background. The selected channel were pre-processed with CLAHE and anisotropic diffusion filter to enhance the contrast and correct the illumination. Due to the non-uniform illumination, drusen at the boundaries are not clearly visible. Fig.4 shows the image obtained after pre-processing. It is seen that drusen near the boundaries are clearly visible in the pre-processed image.
Red Channel Green Channel Blue Channel
Im
ag
e
G
r
a
ini
ne
ss
(a) (b)
Fig .4.Visual Comparision of Original and Pre-Processed Image.
Fig 4 shows the pre-processed image using anisotropic diffusion filtering with
λ
the gradient modulus threshold to be 20 and CLAHE.DWT seems to be more effective in analysis of retinal abnormalities for images captured with different resolution. LL sub band is an approximation coefficient where the Gaussian noise located in the fundus images are removed. The daubechies wavelet have finite vanishing moments and preserves the edges, which are useful for local analysis of an image. Fig.5 shows the approximation coefficient of wavelet transformed image.
Fig .5.Approximation Co-efficient.
It shrinks the transform coeffients in finer scales so the noise in the approximation subband is reduced which is considered for further processing. Clustering is then performed on the approximation channel to classify the regions of the retinal image into drusen, background, and blood vessels.
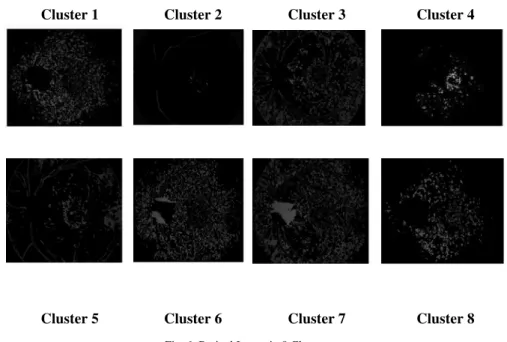
Fig .6. Retinal Image in 8 Clusters
Fig.6 shows various clusters obtained after classification. Fuzzy C-means clustering was used where each pixel is assigned with a degree of membership. Number of clusters was varied from 3 to 12 when the number of clusters was set to 12 it resulted in under segmented image whereas when it was tried with 3, it resulted in over
Cluster 1 Cluster 2 Cluster 3 Cluster 4
segmented image. On a trial and error basis the number of cluster was set to 8 which resulted in better classification.
The intensity of the regions which have been classified to be drusen in the last two clusters are improved by mapping the intensity to a new range. This automatically increases the contrast of the segmented image and the disjoined blobs are connected using the morphological operator. The intensity of the segmented drusen are enhanced and labelled based on the connected component properties. A sliding window technique is used to determine if a given pixel is a drusen or not. It results in a labelled image, where the pixels corresponding to a drusen share a common label while the background is labelled zero.
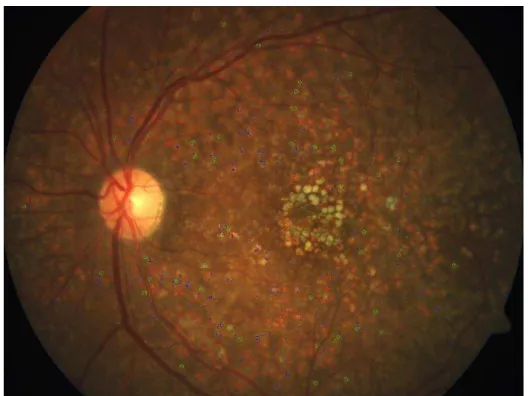
The area of the drusen can be calculated by combining the total number of pixels with a same label and the overall area can be calculated by combining the total number of drusen area pixels. Fig 7 shows the drusen detected image where large drusens are marked in red, medium drusen with green and small with blue edges.
Fig .7. Drusen Detected Image.
The number of drusen in an image helps assess the potential risk of ARMD. The proposed methodology is reliable in identifying maximum number of drusens. In the image shown in Fig.7, manual count shows 410 drusens, while the proposed approach was able to detect 387 drusens. Grading of drusen gives insight towards the progression of ARMD. Table I shows the number of drusen classified under each grade.
TABLEI Counts of Individual Drusen
Drusen Type
Number of Drusen Identified
Number of Drusen Available
Large Drusen 21 38
Medium Drusen 233 217
Small Drusen 133 155
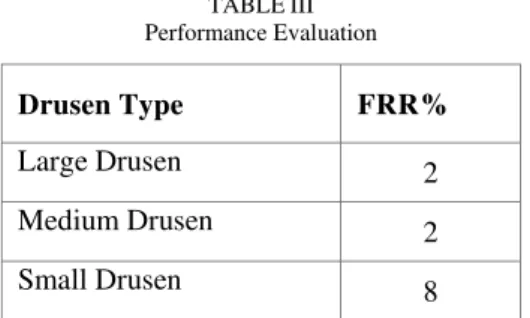
TABLEIII Performance Evaluation
Drusen Type FRR%
Large Drusen 2
Medium Drusen 2
Small Drusen 8
The proposed system is able to detect drusens with 94% accuracy. However, when grading of drusen is done, we are unable to achieve the same accuracy. Table I shows the number of drusen that are classified under each grade (large, medium and small). The number of drusen detected in each grade are compared with the number of drusen present in the ground truth images.
It is observed from the table that the proposed system has classified 21 drusen as large drusen. The count of large drusens in the ground truth image is 38. The reduction in the number of large drusen is because the neighbourhood drusens with the same intensity are combined to form a single drusen. Similar problem also arises when classifying medium drusens. The proposed system has graded 233 drusens as medium, while the ground truth images show only 217. There is an increase in the number of medium drusens. This is because the small drusen with minimum intensity variations from the background are smudged which resulted in misclassifying the small drusens into medium. Table II shows the proposed methodology has achieved FRR 2% for large drusen, 2% for medium drusen, and 8% for small drusen but FRR for the ungraded drusen is 2% which indicates most prominent drusen have been marked.
IV.CONCLUSION
This paper presents a novel automated method to quantitatively detect and grade drusen that will improve the quality of the follow up of ARMD. The algorithm involves pre-processing which is responsible for non-uniform illumination correction and contrast enhancement that are the common problems that are found in retinal images. The image was subjected to wavelet transform to reduce the noise and clustered using Fuzzy C-means based on the intensity values. The selected features of the cluster are labelled and quantized to measure the size and the counts of the drusen. The algorithm was tested with 40 images which shows 94% of accuracy in quantifying the relevant drusen. Future work will be focused towards reducing the processing time and classifying the drusen into soft and hard classes.
ACKNOWLEDGMENT
THE AUTHORS THANK THE MANAGEMENT OF HINDUSTAN INSTITUTE OF TECHNOLOGY AND SCIENCE FOR RENDERING THEIR CONTINUOUS SUPPORT, ENCOURAGEMENT AND COOPERATION THROUGHOUT THE PROGRESS OF THE WORK.WE WOULD ALSO LIKE TO THANK DR.KIM AND DR.RENU OF ARAVIND EYE HOSPITAL,MADURAI FOR PROVIDING DATASET.
REFERENCES
[1] Rama Prasath.A, Ramya.M.M,“Automatic Detection and Elimination of an Optic Disc for Improving Drusen Detection Accuracy”, 5th
[2] P. Checco, F. Corinto, “CNN-based algorithm for drusen identification”, in Proc. IEEE Int. Symp on Circuits and Systems, May 21-24, 2006, pp. 2181-2184.
International Conference on Signal and Image Processing-ICSIP 2014, pp.117-120.
[3] Bhuiyan A, Kawasaki R, Sasaki M, Lamoureux E, Ramamohanarao K, “Drusen Detection and Quantification for Early Identification of Age Related Macular Degeneration using Color Fundus Imaging”, J Clin Exp Ophthalmol 4:305,2013, doi:
[4] Rapantzikos K, Zervakis M, Balas K, “Detection and segmentation of drusen deposits on human retina: potential in the diagnosis of age-related macular degeneration”, Med Image Anal 7: (2003), pp. 95-108.
10.4172/2155-9570.1000305.
[5] MICCAI 1, Lecture Notes in
Computer Science vol. 2878, 2003, pp.
[6] A. Mora, P. Vieira, J. Fonseca, “DRUSEN DEPOSITS ON RETINA IMAGES: DETECTION AND MODELING”, 2
618-625.
nd
[7] Saurabh Garg, Jayanthi Sivaswamy and Gopal Datt Joshi, “Automatic drusen detection from color retinal image”, Indian Conference on Medical Informatics and Telemedicine-ICMIT-2006, pp. 84-89.
International Conference on Advances in Medical Signal and Information Processing - MEDSIP 2004, Malta, Sep 5-8, 2004.
[8] F. Moitinho, André Mora, Pedro Vieira, José Fonseca,“A Drusen Volume Quantification Method based on a Segmentation Algorithm”, In Proceedings of the 1st ECCOMAS Thematic Conference on Computational Vision and Medical Image Processing, Oct 17-19, 2007, pp.957-962.
[9] K. Rapantzikos and M. Zervakis, “Nonlinear enhancement and segmentation algorithm for the detection of age-related macular degeneration (AMD) in human eye’s retina,” in Proc.International Conference on Image Processing, vol. 3, 2001,pp. 1055-1058. [10] Black, M. J. and Sapiro, G,“Edges as outliers: Anisotropic smoothing using local image statistics, Scale-Space Theories in Computer
Vision”,
[11] N. Lee, A. F. Laine, and T. R. Smith, “Learning non-homogeneous textures and the unlearning problem with application to drusen detection in retinal images”, in 5
Second Int. Conf., Scale-Space 99, LNCS 1682, Sept 1999, pp. 259-270.
th
[12] Elisabeta Antonia Haller, “Adaptive histogram equalization in GIS” Annals of the University of Craiova, Mathematics and Computer Science Series vol. 3, 2011, pp 100-104.
[13] M. Kociołek, A. Materka, M. Strzelecki P. Szczypiński, “Discrete wavelet transform derived features for digital image texture analysis”, Proc. of Interational Conference on Signals and Electronic Systems, Sep 18-21, 2001, pp. 163-168.
[14]
[15] R. Walczyk, A. Armitage, and T.D. Binnie, ”Comparative Study on Connected Component Labeling Algorithms for Embedded Video Processing Systems”, Proceedings of the international journal on image processing,computer vision , pattern Recognition (IPCV’10), vol 2,July 2010, pp 853-859
Huan Wang, Wynne Hsu, Kheng Guan Goh, and Mong Li Lee, “An effective approach to detect lesions in color retinal images”, In Proc. of the IEEE Conf. on Computer Vision and Pattern Recognition (CVPR), 2000, pp 181–186.