ACPD
12, 26351–26400, 2012The dispersion characteristics of air
pollution from world’s megacities
M. Cassiani et al.
Title Page
Abstract Introduction
Conclusions References
Tables Figures
◭ ◮
◭ ◮
Back Close
Full Screen / Esc
Printer-friendly Version
Interactive Discussion
Discussion
P
a
per
|
Dis
cussion
P
a
per
|
Discussion
P
a
per
|
Discussio
n
P
a
per
Atmos. Chem. Phys. Discuss., 12, 26351–26400, 2012 www.atmos-chem-phys-discuss.net/12/26351/2012/ doi:10.5194/acpd-12-26351-2012
© Author(s) 2012. CC Attribution 3.0 License.
Atmospheric Chemistry and Physics Discussions
This discussion paper is/has been under review for the journal Atmospheric Chemistry and Physics (ACP). Please refer to the corresponding final paper in ACP if available.
The dispersion characteristics of air
pollution from world’s megacities
M. Cassiani, A. Stohl, and S. Eckhardt
1-NILU, Norwegian Institute for Air Research, 2027, Kjeller, Norway
Received: 7 June 2012 – Accepted: 11 August 2012 – Published: 5 October 2012
Correspondence to: M. Cassiani ([email protected])
ACPD
12, 26351–26400, 2012The dispersion characteristics of air
pollution from world’s megacities
M. Cassiani et al.
Title Page
Abstract Introduction
Conclusions References
Tables Figures
◭ ◮
◭ ◮
Back Close
Full Screen / Esc
Printer-friendly Version
Interactive Discussion
Discussion
P
a
per
|
Dis
cussion
P
a
per
|
Discussion
P
a
per
|
Discussio
n
P
a
per
|
Abstract
Megacities are extreme examples of the continuously growing urbanization of human population that pose (new) challenges to the environment and human health at a local
scale. However, because of their size megacities also have larger-scale effects and
more research is needed to quantify their regional and global scale impacts. We per-5
formed a study of the characteristics of plumes dispersing from a group of thirty-six of world’s megacities using the Lagrangian particle model FLEXPART and focusing on black carbon (BC) emissions during the years 2003–2005. BC was selected since it is representative of combustion-related emissions and it has a significant role as a short-lived climate forcer. Based on the BC emissions two tracers were modeled; a 10
purely passive tracer and one subject to wet and dry deposition. These tracers al-lowed us to investigate the role of deposition processes in determining the impact of megacities’ pollutant plumes. The particles composing the plumes have been sampled in space and time. The time sampling allowed us to investigate the evolution of the plume from its release up to 48 days after emission and to generalize our results for 15
any substance decaying with a time scale sufficiently shorter than the time window of
48 days. The physical characteristics of the time averaged plume have been investi-gated and this showed that although local conditions are important, overall the latitude of the city is the main factor influencing both the local and the regional-to-global dis-persion of the megacities’ plumes. We also repeated the calculations of some of the 20
regional-pollution-potential metrics previously proposed by Lawrence et al. (2007), thus extending their results to a depositing scalar and retaining the evolution in time for all the plumes. Noteworthy our results agreed well with the previous results despite being
obtained using a totally different modeling framework. For the environmental impact on
a global scale we focused on the export of mass from the megacities to the sensitive 25
ACPD
12, 26351–26400, 2012The dispersion characteristics of air
pollution from world’s megacities
M. Cassiani et al.
Title Page
Abstract Introduction
Conclusions References
Tables Figures
◭ ◮
◭ ◮
Back Close
Full Screen / Esc
Printer-friendly Version
Interactive Discussion
Discussion
P
a
per
|
Dis
cussion
P
a
per
|
Discussion
P
a
per
|
Discussio
n
P
a
per
lower troposphere of the Arctic is mainly generated by northern European sources. We also found that the deposition of BC in the Antarctic due to megacities is comparable to the emissions generated by local shipping activities. Finally multiplying population and ground level concentration maps, we found that the exposure of human population to megacities pollution occurs mainly inside the city boundaries and this is especially 5
true if deposition is accounted for. However, some exceptions exist (Beijing, Tianjin, Karachi) where the impact on population outside city boundary is larger than that in-side city boundary.
1 Introduction
More than 50 % of the human population is living in urban areas (United Nations Pop-10
ulation Fund report unit http://www.unfpa.org/swp/2007/english/introduction.html) and this fraction is still increasing, although urban areas currently cover only 0.5 % of the Earth’s land area (Schneider et al., 2009). Extreme examples of urbanization are the so-called megacities with a population of several million of people; ten millions are of-ten used as a threshold to define a megacity (Gurjar and Lelieveld, 2005). This large 15
concentration of human activity causes unprecedented pressure on the environment in-cluding the quality of air both inside the city (e.g. Gurjar et al., 2008) and on a regional and global scale. Some case studies (e.g. Guttikunda et al., 2003; Stohl et al., 2003; Real et al., 2008; Mena-Carrasco et al., 2009; Voss et al., 2010) have investigated regional and long range transport of megacity plumes and the associated chemical 20
processes, but more must be done to quantify the relative importance of their local versus large scale impacts.
In a relatively recent paper Lawrence et al. (2007, called L07 in the remainder of
the paper) investigated the differences and common features in the regional dispersion
characteristics of plumes from a collection of world’s largest cities. In that work three ar-25
ACPD
12, 26351–26400, 2012The dispersion characteristics of air
pollution from world’s megacities
M. Cassiani et al.
Title Page
Abstract Introduction
Conclusions References
Tables Figures
◭ ◮
◭ ◮
Back Close
Full Screen / Esc
Printer-friendly Version
Interactive Discussion
Discussion
P
a
per
|
Dis
cussion
P
a
per
|
Discussion
P
a
per
|
Discussio
n
P
a
per
|
gave significant information on the common regional features of dispersion from these megacities and identified cases where the dispersion was dominated by local condi-tions. It is well known that for studying dispersion characteristics of plumes originating from a relatively localized source, a modeling approach based on 3-D Lagrangian par-ticle models is a viable alternative to Eulerian models. Lagrangian models minimize, if 5
not completely erase, artificial numerical diffusivity effects and can account for various
sub-grid scale processes in an accurate way. Based on these premises we decided to use the Lagrangian particle model FLEXPART (Stohl et al., 2005) for simulating the dispersion from a group of world’s megacities during the year 2003–2005, as estab-lished within the framework of the European Union project MEGAPOLI (Megacities: 10
Emissions, urban, regional and Global Atmospheric POLlution and climate effects, and
Integrated tools for assessment and mitigation, http://megapoli.info/). Our investigation has a similar scope as the study of L07 but uses a Lagrangian particle model with a 4-D sampling grid. The extension into the time domain, allowed the use of additional metrics to describe the dispersion process of the plumes. Moreover, we specifically investigate 15
long range transport into the sensitive polar regions and into the upper layer of the tro-posphere and the stratosphere. Finally, we answer some of the question pointed out by L07 by investigating the behavior of a passive tracer versus an aerosol-like tracer sub-ject to removal processes by dry and wet deposition, and inferring information about population exposure by combining modeled near ground concentration and population 20
maps.
In the next section a brief description of the FLEXPART model, the emission inven-tory and the meteorological input data will be given. In Sect. 3 the mean transport char-acteristics of the megacity plumes will be discussed. In Sect. 4 some metrics originally proposed by L07 will be calculated and compared with their original results. The con-25
ACPD
12, 26351–26400, 2012The dispersion characteristics of air
pollution from world’s megacities
M. Cassiani et al.
Title Page
Abstract Introduction
Conclusions References
Tables Figures
◭ ◮
◭ ◮
Back Close
Full Screen / Esc
Printer-friendly Version
Interactive Discussion
Discussion
P
a
per
|
Dis
cussion
P
a
per
|
Discussion
P
a
per
|
Discussio
n
P
a
per
2 Methods
2.1 Model description
For this study, the Lagrangian particle dispersion model FLEXPART (Stohl et al., 2005) was run for the period November 2002 to December 2005. FLEXPART is an extensively validated transport model (e.g. Stohl et al., 1998) and the code and documentation are 5
freely available (see http://transport.nilu.no/flexpart/). It is worth to remind here that: (i) FLEXPART uses the well mixed criteria, introduced by Thomson (1987), to define
stochastic differential equations with a Gaussian velocity distribution to simulate the
effect of planetary boundary layer turbulence on particle dispersion and accounts for
the vertical air density gradient (Stohl and Thomson, 1999), (ii) it includes a horizon-10
tal mesoscale meandering parameterization through an additional Langevin equation for the mesoscale velocity, (iii) it simulates convective exchanges using the scheme of Emanuel and Zivkovic-Rothman (1999), and (iv) the model includes dry/wet deposition processes. Thanks to the Lagrangian particle representation the model does not
suf-fer of significant numerical diffusivity and the grid is used only to extract information
15
from the particle field which in general preserves very well any flow structures gen-erated during the advection and dispersion process. This last characteristic and the
superior accuracy in the representation of sub-grid dispersion processes differentiates
this class of models from Eulerian (fully grid based) chemistry transport models, and makes FLEXPART particularly suitable to study dispersion form localized sources in 20
the planetary boundary layer.
The model is driven here by operational meteorological data from the European Cen-tre for Medium-Range Weather Forecasts (ECMWF) retrieved with a horizontal
reso-lution of 1◦×1◦ and with 60 vertical levels in a hybrid coordinate system and a time
resolution of 3h. The model output grid has a horizontal resolution of 1◦×1◦and 25
ver-25
ACPD
12, 26351–26400, 2012The dispersion characteristics of air
pollution from world’s megacities
M. Cassiani et al.
Title Page
Abstract Introduction
Conclusions References
Tables Figures
◭ ◮
◭ ◮
Back Close
Full Screen / Esc
Printer-friendly Version
Interactive Discussion
Discussion
P
a
per
|
Dis
cussion
P
a
per
|
Discussion
P
a
per
|
Discussio
n
P
a
per
|
release, i.e. the time of emission. The age-classes duration used are expressed in days
as, 0≤t <1, 1≤t <3, 3≤t <6, 6≤t <9, 9≤t <14, 14≤t <20, 20≤t <27, 27≤
t <34, 34≤t <41, 41≤t <48. Note that, because of their different duration, the mass
content of a perfectly conserved tracer differs for the different age classes. When a
particle reaches 48 days of elapsed time it is removed from the simulation, therefore 5
even the conserved scalar (BCtr, see later) has a maximum time of residence in the atmosphere of 48 days. The model output is stored every 5 days as 5-day average
concentration c(x,y,z,t) or, written in a discretized, form ci jk,i t whereit is used as
index for the age andi, j, k are indices for the longitude, latitude and elevation above
terrain level (a.t.l.). 10
Aerosols are removed in FLEXPART by dry and wet deposition. The dry deposition is simulated according to a resistance approach (Wesely and Hicks, 1977) consid-ering the aerodynamic resistance, the quasilaminar sublayer resistance, and gravita-tional settling (Slinn, 1982). For the aerosols considered in our simulations (see be-low), we assumed a logarithmic diameter distribution with geometric mean diameter 15
2.5×10⁻⁷m and geometric standard deviation 1.25, and a density of 1.4×10³kg m−3.
Wet deposition distinguishes between in-cloud and below-cloud scavenging
(McMa-hon and Denison, 1979; Hertel et al., 1995). Scavenging coefficients are determined
primarily as a function of cloud liquid water content and precipitation rate, respectively. Notice that FLEXPART has no aerosol processing scheme and details such as the con-20
version of some aerosols from an initially hydrophobic to a hydrophilic state (Vignati et al., 2010) are ignored.
2.2 Megacity emissions and deposition time scales
The emission inventory is extracted from the original Representative Concentration Pathway (RCP) 8.5 emission scenario for the year 2005 developed by the MESSAGE 25
ACPD
12, 26351–26400, 2012The dispersion characteristics of air
pollution from world’s megacities
M. Cassiani et al.
Title Page
Abstract Introduction
Conclusions References
Tables Figures
◭ ◮
◭ ◮
Back Close
Full Screen / Esc
Printer-friendly Version
Interactive Discussion
Discussion
P
a
per
|
Dis
cussion
P
a
per
|
Discussion
P
a
per
|
Discussio
n
P
a
per
Riahi et al., 2007). The global emission data used here has a 1◦×1◦ resolution and
was obtained from the original data set at 0.5◦×0.5◦by T. M. Butler (personal
commu-nication, 2010) and provided to the MEGAPOLI project along with a mask defining the megacities’ extensions. Any simulated megacity occupies one or more grid cells of this emission data set as listed in Table 1 and illustrated in Fig. 1 and it is possible to see 5
that both single-grid-cell as well as multiple-grid-cell megacities are included. From the RCP 8.5 data set, the emissions of several compounds can be extracted.
A first estimate on the relative importance of megacity emissions on a global scale can be deduced immediately from Fig. 2, where the cumulative emission contribution for several chemical species (black carbon, BC; carbon monoxide, CO; nitrogen oxides, 10
NOx; sulfur dioxide, SO2) for all the megacities up to a given degree of latitude is scaled
with the total cumulative species emission (including non-megacity emission) to the same degree of latitude. For example the total cumulated emission, starting from the
South Pole and up to a specific latitudeilat, could be written as, CEilat=
iPlat
j=−90
360P
i=1
E(i,j),
whereE(i,j) is the emission in grid celli,j. Similarly, the cumulative contribution for all
15
the cities starting from the South Pole to latitude,ilat, could be written as,
CEMCilat=
NXcity
icity=1
ilat
X
j=−90
360 X
i=1
E(i,j)δ(j-l at(icity))δ(i-lon (icity))
Ncity is the number of cities considered andδ is a function with a value of one within
the city limits and zero outside.
The data have been separated in Northern and Southern Hemisphere (NH and SH) 20
and the cumulative contribution is calculated starting from the North and South Poles
respectively. No data are shown south of the latitude of 35◦S and north of the
lati-tude of 60◦N since there are no megacities. Further, the data are separated into
ACPD
12, 26351–26400, 2012The dispersion characteristics of air
pollution from world’s megacities
M. Cassiani et al.
Title Page
Abstract Introduction
Conclusions References
Tables Figures
◭ ◮
◭ ◮
Back Close
Full Screen / Esc
Printer-friendly Version
Interactive Discussion
Discussion
P
a
per
|
Dis
cussion
P
a
per
|
Discussion
P
a
per
|
Discussio
n
P
a
per
|
in the NH. In the NH, there is a strong seasonal variation at higher latitudes especially for CO and BC, which is due to intense open biomass burning in spring and summer, so that megacity emissions contribute less in summer. In the autumn and winter months, a single city (St. Petersburg) accounts for almost 10 % of the total emissions north of
about 60◦N for the BC considered in this study. It can be of interest to note that adding
5
to the list of cities an emitting area extending from a lower left corner of (59◦N, 10◦E)
to an upper right corner (61◦N, 26◦E) the emission fraction goes up to 36 % of the total
emission over 60◦N for BC in autumn and winter. This area contains five large urban
areas in the Baltic and Scandinavian countries: Tallinn (Estonia), Helsinki (Finland), Stockholm and Uppsala (Sweden), and Oslo (Norway). Since on the scale of this study 10
these cities are geographically close to the investigated megacity of St. Petersburg, the results obtained for this latter city could be of guidance for the behavior of emis-sions that in the autumn and winter contribute 36 % of the total world emisemis-sions north
of 60◦N. These cities’ contribution is lower in the summer but considering that during
these months the concentrations of BC in the Arctic lower atmosphere are lower due 15
to stronger deposition processes (e.g. Hirdman et al., 2010), the winter peak of these urban emissions could be significant.
The further discussion in this paper will be based only on the emissions of one com-pound, BC, which we consider as representative for all combustion-related emissions.
This compound will be used for two different scalar tracers: one considered as a
con-20
served tracer (BCtr) and not subject to any removal process and another one (BCdp) with dry and wet deposition processes included in the simulations.
For studying the impact of pollution on human population we used the GPWv3 data set of the Center for International Earth Science Information Network (CIESIN), Columbia University; available at http://sedac.ciesin.columbia.edu/gpw (Jan-25
ACPD
12, 26351–26400, 2012The dispersion characteristics of air
pollution from world’s megacities
M. Cassiani et al.
Title Page
Abstract Introduction
Conclusions References
Tables Figures
◭ ◮
◭ ◮
Back Close
Full Screen / Esc
Printer-friendly Version
Interactive Discussion
Discussion
P
a
per
|
Dis
cussion
P
a
per
|
Discussion
P
a
per
|
Discussio
n
P
a
per
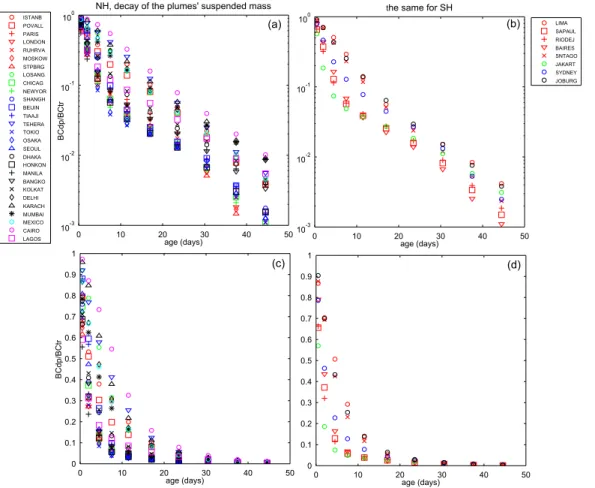
Before proceeding with a detailed analysis of the plume characteristics it is useful to
explore the effects of the modeled wet and dry deposition processes on the suspended
mass in the atmosphere as a function of time after emission (“age”). The deposition
processes reduce the mass content significantly with age but differently for the different
cities considered. In most figures in this paper, megacities have been divided in NH and 5
SH megacities and the results of these two groups will be in general plotted separately to improve the clarity and readability of the figures.
Figure 3a, b shows the three year averaged concentration (mid December 2002 to mid December 2005, see Sect. 3) of BCdp normalized for that of BCtr in any age class on a logarithmic scale, while Fig. 3c, d shows the same ratio on a linear scale. This in-10
dicates how dry and wet deposition processes deplete the atmospheric mass of BCdp with time. From Fig. 3c, d it is apparent how initially deposition processes are more ac-tive for European and tropical cities. However, after a few days the plumes originating from megacities located at midlatitudes in Asia are those characterized by the higher deposition rates, related to strong scavenging in the North Pacific stormtrack (Fig. 3a, 15
b). For the last few age classes, European and North American plumes have again
higher deposition rates. This complex behavior reflects the different three dimensional
distributions of the plumes originating from different geographical regions. For very
large ages, all the plumes should converge towards the same deposition rates typical of the Northern and Southern Hemisphere, while initially the deposition rate is strongly 20
influenced by the local processes close to the source. This can be better appreciated defining two time scales obtained by fitting an exponential decay to the data on a
log-arithmic scale,Tlo(based on Fig. 3a ,b) and to the data on a linear scale,Tli(based on
Fig. 3c, d). These time scales are reported in Table 1.Tlo is an estimate of the average
e-folding deposition time scale for the 48 days time window and the source location.Tli
25
gives a good idea on how fast the mass emitted from a specific source is depleted from the plume and it strongly depends on the local processes in the boundary layer close
ACPD
12, 26351–26400, 2012The dispersion characteristics of air
pollution from world’s megacities
M. Cassiani et al.
Title Page
Abstract Introduction
Conclusions References
Tables Figures
◭ ◮
◭ ◮
Back Close
Full Screen / Esc
Printer-friendly Version
Interactive Discussion
Discussion
P
a
per
|
Dis
cussion
P
a
per
|
Discussion
P
a
per
|
Discussio
n
P
a
per
|
and nine days, but with most of the cases between about six and eight days, indicating the approximate global annual e-folding lifetime of the BCdp aerosols in FLEXPART.
An important feature of including age classes in the analysis is that many of the re-sults reported here involving a mass assigned to the age classes, can be extended to
consider the effect of a superimposed decay process (e.g. radioactive decay, or
chem-5
ical destruction) just applying, a-posteriori, the decay – e.g. exponential characterized by an assigned time scale. This is true for both BCtr and BCdp. In the first case the su-perimposed decay is applied to a substance not undergoing deposition, in the second case to a substance undergoing wet and dry deposition.
3 Dispersion characteristics of transported plume
10
In this section we start the discussion about the megacity plumes with an analysis of their physical dispersion characteristics both horizontally and vertically. To characterize the horizontal dispersion of the plumes, the model output was first averaged over the time period of interest (e.g. three winter seasons or all three years)
˜
c(x,y,z,t)= 1 N
N
X
i=1
ci(x,y,z,t) 15
HereN indicates the number of 5 days output intervals in the period of interest,x, y,z
are the three space dimensions, andtindicates the elapsed time from the release (i.e.
the age). From this time averaged concentration a vertically integrated concentration field was introduced,
˜
cz(x,y,t)= Nz
X
k=1
˜
c(x,y,zk,t)∆zk 20
Here ∆zk indicates the vertical grid level extension and Nz (= 25) is the number of
ACPD
12, 26351–26400, 2012The dispersion characteristics of air
pollution from world’s megacities
M. Cassiani et al.
Title Page
Abstract Introduction
Conclusions References
Tables Figures
◭ ◮
◭ ◮
Back Close
Full Screen / Esc
Printer-friendly Version
Interactive Discussion
Discussion
P
a
per
|
Dis
cussion
P
a
per
|
Discussion
P
a
per
|
Discussio
n
P
a
per
obtained as the average distance of the mass from the source location, ¯d(t), in the
following called transport distance,
¯ d(t)=
360P
i=1
180P
j=1
di j( ˜cz(t))i j∆i j
360P
i=1
180P
j=1
( ˜cz(t))i j∆i j
wheredi j is used to indicate the distance, on the Earth sphere, of the center of the grid
point with indices (i, j) from the source position. Since some sources are composed
5
of more than one single grid cell element, the source position was defined as the grid element containing the maximum ground level concentration averaged over the
exten-sion of the first age class (i.e. 0< t <1 day). ∆i j is the area of a grid element with
indices (i, j), and ( ˜cz)i jis the concentration associated with the grid element. It should
be noticed again that, since the grid extends also in the time dimension, any of these 10
measures is defined as a function of age for the intervals defined above. In a similar
manner, the averaged vertical position, ¯h(t), of the horizontally integrated
concentra-tion ( ˜cxy)k as a function of time can be introduced, wherek is used for the vertical grid
cell index.
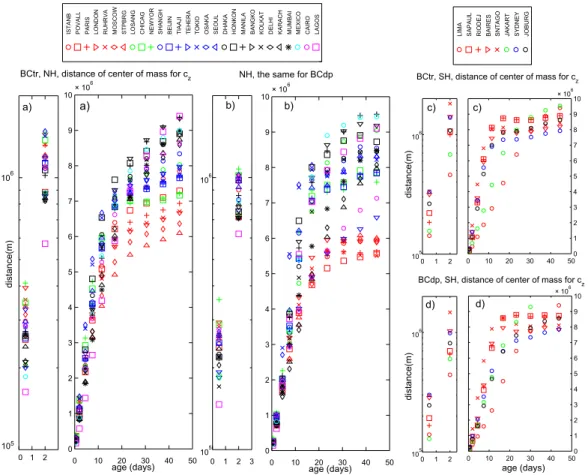
The results for the distance from the source location, ¯d(t), for BCtr are shown in
15
Fig. 4a and c, respectively for the NH and the SH and those for BCdp are shown in Fig. 4b and d. The smaller left panels are a zoom into the age classes 0–1 and 1–3 days and use a logarithmic scale for the plot. For BCtr in the NH, it can be seen that initially the plumes subject to the fastest advection are those emitted at higher lati-tude and associated therefore with European and North American megacities, while 20
ACPD
12, 26351–26400, 2012The dispersion characteristics of air
pollution from world’s megacities
M. Cassiani et al.
Title Page
Abstract Introduction
Conclusions References
Tables Figures
◭ ◮
◭ ◮
Back Close
Full Screen / Esc
Printer-friendly Version
Interactive Discussion
Discussion
P
a
per
|
Dis
cussion
P
a
per
|
Discussion
P
a
per
|
Discussio
n
P
a
per
|
transport distances. Asian megacities of intermediate latitude (blue symbols) have in general intermediate characteristics. The reason for this latitude-dependent behavior is influenced by three factors: (1) the plumes are transported preferentially zonally before spreading meridionally due to latitudinal transport barriers, and the length of a circle of latitude is largest at the equator, (2) cities at lower latitudes have a larger asymptotic 5
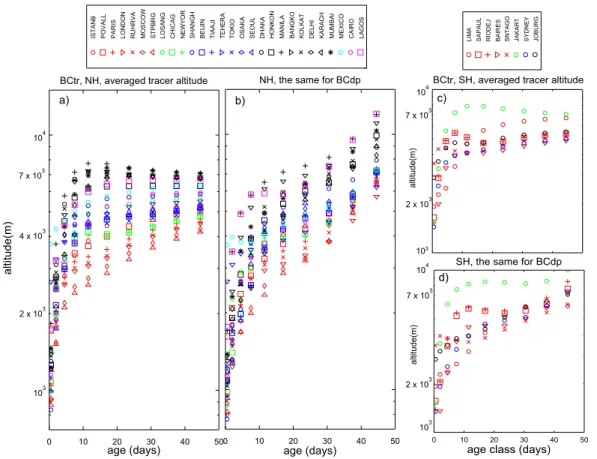
distance possible for a uniform scalar distribution on the hemisphere and (3) the tropics are characterized by lower near-surface wind speeds but a high frequency of deep con-vection, so that the dispersion is at first slower than for higher-latitude cities but after a few days significant amounts of tracer in the tropics are transported by deep convec-tion to the upper troposphere, where winds are faster. This is illustrated in Fig. 5a, c, 10
which shows that tropical cities and particularly south-east Asian cities (e.g. Manila) are associated with a very fast increase of the plume average elevation.
The zoom figures for the horizontal transport behavior between 1–3 days (Fig. 4), show that in the NH the cities with the initial fastest plume transport are London, New-York, Osaka and Tokyo. These are all cities close to the ocean which is therefore an 15
important factor in determining a fast early phase of plume transport. Among the Eu-ropean megacities the Po-valley shows a unique behavior since the tracer is trapped there by mountains on three sides, which strongly limits the early phase of transport. One consequence of this is the high pollution levels usually registered in this area (e.g. Bigi et al., 2012). However, overall in the NH the megacity with the slowest horizontal 20
transport up to 10 days is the tropical city of Lagos which also has severe air pollution problems (Baumbach et al., 1995).
Removal processes lead to a reduction of BC mass in the atmosphere. The lifetime
Tli of the BCdp tracer for the various megacities ranges from 1.0 days for Jakarta to
10.5 days for Cairo (Table 1), reflecting the very different efficiencies of wet scavenging
25
in tropical and desert regions. Removal processes also change the transport
charac-teristics of the BC plumes and these changes are sometimes difficult to understand
ACPD
12, 26351–26400, 2012The dispersion characteristics of air
pollution from world’s megacities
M. Cassiani et al.
Title Page
Abstract Introduction
Conclusions References
Tables Figures
◭ ◮
◭ ◮
Back Close
Full Screen / Esc
Printer-friendly Version
Interactive Discussion
Discussion
P
a
per
|
Dis
cussion
P
a
per
|
Discussion
P
a
per
|
Discussio
n
P
a
per
compared to BCtr (Fig. 5). As a consequence, initially the horizontal transport is dom-inated by the slower low-level winds, leading also to shorter horizontal transport dis-tances of BCdp compared to BCtr, see left panels in Fig. 4. After a few days, however, due to preferential wet scavenging in the lower troposphere versus lack of precipitation in the upper troposphere and lower stratosphere, for the remaining BCdp the fraction 5
located in the upper troposphere and stratosphere increases. Thus, the centroid alti-tude of the BCdp tracer increases throughout all remaining age classes (Fig. 5b, d) and the horizontal transport distance also catches up with that of BCtr (Fig. 4b). This is summarized in Fig. 6a, b which shows the ratio, for BCdp versus BCtr, of the
horizon-tal transport distances (D(t)=
NcitiesP
i=1
¯
di(t)/Ncities) and of the average megacities plume
10
altitude (H(t)=
NcitiesP
i=1
¯
hi(t)/Ncities) for all cities. Notice that these results forH(t) do not
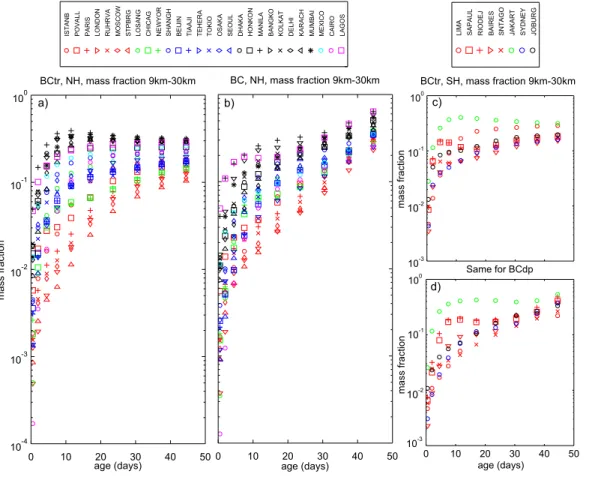
imply that a larger fraction of the total emissions can reach the upper troposphere for BCdp than for BCtr. However, after some time a larger relative fraction of the remaining BCdp than of the remaining BCtr resides in the upper troposphere, as demonstrated in Fig. 7, which shows the fraction of the total BCtr and BCdp mass suspended in 15
the atmosphere which is contained between 9 km and the top of our sampling domain (30 km). For BCdp, this fraction increases throughout the 48 days considered in our study and for some cities it approaches the value of 1 (Fig. 7b and d).
The SH megacity plumes have a similar behavior compared to their NH counterparts. Midlatitude megacity plumes show initially a faster horizontal transport while ultimately 20
the tropical and subtropical latitude megacity plume have a larger transport distance. However, the transport for mid latitude cities is here faster than in the NH and the plumes reach faster their hemispheric asymptotic distance. In fact Fig. 4c shows that for BCtr all the plumes but the Lima and Jakarta plumes are transported more rapidly compared to the NH plumes. This behavior is likely related to the stronger westerlies in 25
ACPD
12, 26351–26400, 2012The dispersion characteristics of air
pollution from world’s megacities
M. Cassiani et al.
Title Page
Abstract Introduction
Conclusions References
Tables Figures
◭ ◮
◭ ◮
Back Close
Full Screen / Esc
Printer-friendly Version
Interactive Discussion
Discussion
P
a
per
|
Dis
cussion
P
a
per
|
Discussion
P
a
per
|
Discussio
n
P
a
per
|
for the NH, while Lima shows the slowest horizontal transport speed of all the megacity plumes investigated.
4 Statistical measures of regional pollution export
L07 defined several metrics to characterize the dispersion of the megacity plumes and their potential impact on a regional scale. Here we will calculate within our model-5
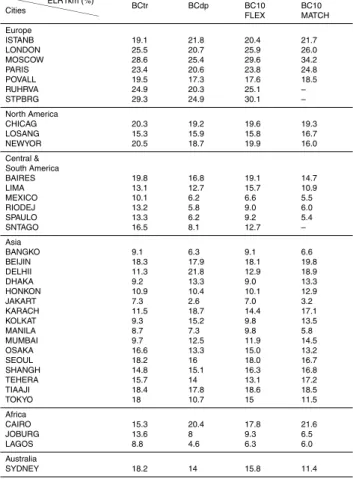
ing framework two of their metrics of pollutant Export over Long-Range (ELRcol and ELR1km), and compare our results with theirs. ELRcol is defined as the fraction of the total BC mass in the atmosphere which is more than 1000 km away from the source at any altitude. ELR1km is the same as ELRcol but for the mass contained in the first 1 km a.t.l. Contrary to L07 we considered only whole grid cells and did not split grid 10
cell according to their fractions within or beyond the 1000 km radius from the source,
however, our grid has finer resolution (1◦versus 1.9◦), which compensates for this less
accurate treatment. Also, the simulations of L07 were for the year 1995 while our
sim-ulations are for the years 2003–2005. Also, as before, we will investigate the effect of
the deposition thus extending the results of L07. 15
Our age class treatment generalizes these metrics to any decay time within the 48-day range considered. The ELR measure has been calculated as cumulated mass exported up to a specific age normalized with the total mass of the substance sus-pended in the atmosphere cumulated up to the same age. This means that the value of the last age class corresponds to the total exported mass fraction.
20
L07 report in detail the ELR1km values for a scalar with a ten days decaying time scale. Figure 8a shows that the value of ELR1km for BCtr becomes, after about one week, almost constant for most cities. This means that all tracers with a decay time scale larger than about one week will behave similarly to a purely passive tracer with-out decay. This simply reflects the partitioning of tracer between the lowest 1 km and the 25
ACPD
12, 26351–26400, 2012The dispersion characteristics of air
pollution from world’s megacities
M. Cassiani et al.
Title Page
Abstract Introduction
Conclusions References
Tables Figures
◭ ◮
◭ ◮
Back Close
Full Screen / Esc
Printer-friendly Version
Interactive Discussion
Discussion
P
a
per
|
Dis
cussion
P
a
per
|
Discussion
P
a
per
|
Discussio
n
P
a
per
the age class partitioning we can explicitly apply an exponential decay process with 10 day time scale to allow a more precise comparison of our results to those of L07. Table 2 compares the ELR1km results for the 48 days age class for a conserved tracer with those for a tracer with ten days lifetime (BC10). The results of L07 for BC10 are
also reported. It is possible to see that the difference between BC10 and the conserved
5
tracer, BCtr, is minor in most of the cases. However, in general and as expected, the results obtained for the decaying scalar agree better with the results reported by L07.
Considering that the results of L07 were for a different year, used different
meteoro-logical input data (NCEP reanalysis) and a different transport model (MATCH), the
agreement between the two studies is very good. The values of ELR1km obtained in 10
our study range from 6.3 % to 30.1 % compared with 3.2 % to 34 % in L07.
A scatter plot (Fig. 9) shows that the ELR1km values for European, North Amer-ican and mid latitude Asian cities agree reasonably well in the two studies. South-ern Hemisphere megacities have generally higher values in the present calculation based on FLEXPART. The worst agreement is achieved for Indian subcontinent, Asian 15
tropical, and South American megacities, although the differences are not systematic.
Jakarta stands out with ELR1km values of 7 % and 3.2 % in FLEXPART and MATCH,
respectively. This difference must be related to the different convection schemes used
in FLEXPART (Emanuel and Zivcovic – Rothman scheme, implemented by Forster et al., 2008) and MATCH (plume ensemble scheme, proposed by Lawrence and Rasch, 20
2005). The low fraction in MATCH means that in this model the BC10 tracer must have
been vented out of the boundary layer very efficiently, with only small compensating
downward fluxes. This result is obtained, in somewhat less extreme form, also for other tropical cities such as Manila, Bangkok, San Paulo and Rio de Janeiro. On the other hand, FLEXPART has lower ELR1km values than MATCH for the cities on the Indian 25
subcontinent. This is probably due to different representation of the winter monsoon in
ACPD
12, 26351–26400, 2012The dispersion characteristics of air
pollution from world’s megacities
M. Cassiani et al.
Title Page
Abstract Introduction
Conclusions References
Tables Figures
◭ ◮
◭ ◮
Back Close
Full Screen / Esc
Printer-friendly Version
Interactive Discussion
Discussion
P
a
per
|
Dis
cussion
P
a
per
|
Discussion
P
a
per
|
Discussio
n
P
a
per
|
Figure 8b reports the metric ELR1km computed for BCdp. The export efficiency for
the BCdp tracer depends not only on the combined action of horizontal wind and
ver-tical transport, but also on the removal rates. In general the effect of deposition is to
reduce the value of ELR1km and the reduction is stronger for higher local deposition
rates, i.e. low value ofTli. However, the megacities in the Indian subcontinent plus the
5
city of Cairo have a noticeable increase of ELR1km for BCdp with respect to that of BCtr. A possible mechanism for this happening is if precipitations act mainly on ris-ing air masses outside the 1000 km radius from the source. This is consistent with the winter monsoon behavior for the Indian subcontinent, as described above. The city of
Cairo is instead characterized by an arid local climate (it is the city with the highestTli)
10
and therefore, since there are very low precipitations close to the city, it is plausible that precipitations act mainly on rising air masses outside the 1000 km radius. In general this additional factor adds variability to the possible range of ELR1km for BCdp, with values spanning about a factor of ten, compared to only a factor of four for BCtr.
The two lowest total values of ELR1km for BCtr and BCdp are found for Jakarta and 15
Lagos (see Table 2) and it is interesting to examine why. Lagos is the city with the slowest horizontal transport of the plume during the first 3 days after tracer release
(Fig. 4a, b, left). Jakarta on the other hand is the second slowest in the range 3<t<14
days (Fig. 4a, b, right). This difference explain also why Jakarta has an initial peak in
the value of ELR1km for BCtr (Fig. 8a). When deposition is accounted for, Jakarta is 20
the city with the shortestTliand therefore the deposition generates a stronger decrease
of ELR1km compared to that of any other city (including Lagos). As a consequence the
difference between the two lowest values of ELR1km becomes more marked for BCdp.
It is also interesting to discuss why Mexico City has initially the lowest value of ELR1km and why it has a quite low overall ELR1km, despite having a quite fast overall horizontal 25
transport (Fig. 4a, b, right). This city is characterized by slow initial transport (t <1 day,
ACPD
12, 26351–26400, 2012The dispersion characteristics of air
pollution from world’s megacities
M. Cassiani et al.
Title Page
Abstract Introduction
Conclusions References
Tables Figures
◭ ◮
◭ ◮
Back Close
Full Screen / Esc
Printer-friendly Version
Interactive Discussion
Discussion
P
a
per
|
Dis
cussion
P
a
per
|
Discussion
P
a
per
|
Discussio
n
P
a
per
two top low level exporters irrespective of deposition are the cities of Moscow and Saint Petersburg and these are cities with a quite fast initial transport (Fig. 4) but also and especially very low average elevation (Fig. 5).
As previously reported by L07, results for the total mass exported to a distance of more than 1000 km (ELRcol) are considerably less variable. In particular for the 48 5
days age class we find a very narrow range of values from 85 % to 95 % (Fig. 10). This is expected since in this case the values should converge towards the same asymptotic limit of 98.8 % for a scalar well mixed in the hemisphere, where an area bounded by the 1000 km radius covers 1.2 % of the hemisphere. The values of ELRcol for BCtr in the two weeks age class goes from about 60 % to 85 %. This is indicative of the value of 10
a scalar subject to a superimposed decay of a similar duration, and indeed this range is quite similar to the cumulated value of ELRcol for BC10 which ranges from about 59 % to 82 %. The range of values of BC10 is again in good agreement with the results of L07 for the ten days decaying scalar for which they reported a range from 62 % to 84 %.
15
It is interesting to note that Lima, which has clearly the lowest value of ELRcol for any age, was not among the cities having a very low ELR1km. This city has an extremely slow horizontal transport (Fig. 4) which is perfectly reflected in the low ELRcol value. However, contrary to Jakarta and Lagos that have a very low ELR1km, Lima is not characterized by a very fast uplifting of the plume (Fig. 5) and this increases the value 20
of ELR1km. The deposition modifies again the picture by widening the range of values. However, in this case the interpretation is simpler with respect to ELR1km since depo-sition systematically decreases the value of ELRcol. The cities with the highest values
of ELRcol are those characterized by a high value ofTliand Cairo (which is the city with
the highestTli) becomes the top exporter. The fact that Cairo was not the top low level
25
ACPD
12, 26351–26400, 2012The dispersion characteristics of air
pollution from world’s megacities
M. Cassiani et al.
Title Page
Abstract Introduction
Conclusions References
Tables Figures
◭ ◮
◭ ◮
Back Close
Full Screen / Esc
Printer-friendly Version
Interactive Discussion
Discussion
P
a
per
|
Dis
cussion
P
a
per
|
Discussion
P
a
per
|
Discussio
n
P
a
per
|
5 Air pollution and BC deposition in the polar regions
Analysis of BC concentration in the polar regions is important due to the positive radiative forcing of this compound both in the atmosphere and when deposited on
snow or ice and the high efficacy of this forcing for climate warming (e.g. Hansen and
Nazarenko, 2004; Flanner et al., 2009). Our simulations allow us to quantify the ef-5
ficiency with which BC originating from megacities in different parts of the world can
reach the polar atmosphere and deposit on the ice/snow cover. This study is somewhat complementary to the works of Stohl (2006), Stohl and Sodemann (2010) and Hirdman et al. (2010) who studied the possible sources of BC in the Arctic and Antarctic atmo-sphere from a receptor-oriented perspective. Here, we take a source-oriented view by 10
following the emissions from the world’s megacities.
5.1 Air pollution
Figure 11a, b shows the total BCtr and BCdp mass in the lowest 1 km a.t.l. of the NH
po-lar atmosphere (north of 66◦N), scaled for the mass emitted in the respective age class
interval, while Fig. 11c, d provides the same information for the SH (south of 66◦S). As
15
discussed extensively in Stohl (2006), the contribution to mass in this layer in the NH depends mainly on the latitude of the source, with largest contributions from northern Eurasia. This is confirmed here for the BCtr results. Specifically, we find that releases from Saint Petersburg give the largest fractional contributions of all megacities and for all age classes. As much as 10 % of the emissions can be located in the Arctic already 20
as early as about 2 days after the emission. In fact, the contribution decreases after about 2 weeks, as the Saint Petersburg plume is initially preferably transported to the north and subsequently disperses into the entire NH. Similar behavior can be expected for pollution export from other Baltic and Scandinavian cities that are relatively close to Saint Petersburg and jointly contribute up to 36 % of the total BC emissions north of 25
60◦N. This group of cities is consequently likely to be the largest “localized” contributor
ACPD
12, 26351–26400, 2012The dispersion characteristics of air
pollution from world’s megacities
M. Cassiani et al.
Title Page
Abstract Introduction
Conclusions References
Tables Figures
◭ ◮
◭ ◮
Back Close
Full Screen / Esc
Printer-friendly Version
Interactive Discussion
Discussion
P
a
per
|
Dis
cussion
P
a
per
|
Discussion
P
a
per
|
Discussio
n
P
a
per
with lifetimes on the order of days to a few weeks. Furthermore, while Moscow makes a smaller BCtr fractional contribution to the pollution in the Arctic atmosphere during the first 3 days after emission, the contributions at later times are almost identical to those of Saint Petersburg. The age class sampling allows appreciating that, for any substance with a decaying time scale of less than about 10 days, the contributions 5
from non European cities are very small. Only after this elapsed time, contributions from North American megacities start to be more relevant and soon after also from East Asian mid latitude cities. Contributions from tropical locations are even for the last age class considered (48 days) an order of magnitude smaller than contributions from Saint Petersburg. Table 3 (column 1 and 3) reports the cumulative amount of mass 10
irrespective of the age classes and expressed both as mass and as a percentage of total emitted mass. The table confirms that cities in Europe have significantly larger fractional contributions but in terms of absolute numbers (i.e. taking into account also
the different emission strengths), New York is the largest contributor and Tokyo, Seoul
and Beijing have numbers comparable to those of most European cities. However, we 15
remind the reader that, as shown by the age class plots, these cities have smaller con-tributions relative to European cities when the lifetime is significantly shorter than 48 days.
When taking into account deposition processes (BCdp), the fractional contributions from all cities become much smaller (Fig. 11b). However, the reductions are particularly 20
large for non-European cities and, thus, significant contributions to the BCdp loading in the lowest 1 km of the Arctic atmosphere are confined to Northern European sources with small contributions from North American cities. Saint Petersburg and Moscow give similarly high contributions in the age classes going from 2 to 20 days, although both London and Ruhr valley are also relevant. The cumulative numbers reported in Table 3 25
ACPD
12, 26351–26400, 2012The dispersion characteristics of air
pollution from world’s megacities
M. Cassiani et al.
Title Page
Abstract Introduction
Conclusions References
Tables Figures
◭ ◮
◭ ◮
Back Close
Full Screen / Esc
Printer-friendly Version
Interactive Discussion
Discussion
P
a
per
|
Dis
cussion
P
a
per
|
Discussion
P
a
per
|
Discussio
n
P
a
per
|
Figure 12 reports the fraction of mass of BCdp and BCtr in the Arctic free tropo-sphere, 2–9 km (a, b), and stratotropo-sphere, 9–30 km (c, d) above sea level. For Bctr, the contributions in the free troposphere are similar to those observed in the first layer (0–1 km) but with higher values from mid-latitude Asian and North American cities, which are as large as that of European cities as early as two weeks after the release. 5
Also, with the increase of the plume age, the contributions from sources in the trop-ics become noticeable. This again suggests that if a superimposed decay process is investigated, a decaying timescale of about a week would give clearly the largest con-tributions from European and North America cities, while longer decaying timescales would give substantial contributions from Asian megacities. If deposition is accounted 10
for (Fig. 12b) the contribution from European megacities becomes more significant even for longer superimposed decaying time scales. However, only in the case of sub-stances with a superimposed decay of less than 3 days the contribution from mid-latitude Asian cities would be negligible. This is in contrast to the 0–1 km a.t.l. layer, where European sources are totally dominant.
15
Moving to the stratosphere, Fig. 12c shows the most efficient transport of BCtr mass
into the Arctic stratosphere is from the mid-latitude Asian and North American
megac-ities. The difference between these and other sources are better appreciated on a
linear scale (insert in Fig. 12c). Looking in more detail it is possible to see that
ini-tially (age class of up to 3 days) the most efficient in contributing to the BCtr mass in
20
this upper layer are Northern European cities but soon after middle-latitude Asian and
North American cities become noticeably more efficient. This suggests a quite
com-plex scenario in case a superimposed decay is considered, with dominant contribution
from different regions of the NH depending on the lifetime of the chemical compound.
Similar lifetime dependence could be observed in the case of BCdp, although in this 25
case the fractions of mass reaching these layers of the atmosphere are much lower.
Interestingly the Po-Valley megacity becomes in this case the most efficient source in
ACPD
12, 26351–26400, 2012The dispersion characteristics of air
pollution from world’s megacities
M. Cassiani et al.
Title Page
Abstract Introduction
Conclusions References
Tables Figures
◭ ◮
◭ ◮
Back Close
Full Screen / Esc
Printer-friendly Version
Interactive Discussion
Discussion
P
a
per
|
Dis
cussion
P
a
per
|
Discussion
P
a
per
|
Discussio
n
P
a
per
possible to see how the Po-valley stands out as the largest contributor to BCdp in the Arctic stratosphere.
The current results reporting a contribution mainly from European megacities to the mass of BC in the lowest kilometer of the Arctic atmosphere and a progressively in-creasing contribution of North American and East Asian megacities when moving up to 5
the free troposphere and the stratosphere is in agreement with the findings of Hirdman et al. (2010), which reported a substantial contribution to BC measurements at lower altitude stations only from northern Eurasian sources, while significant contributions from more remote sources (e.g. East Asian) was observed for measurements on top of the Greenland ice sheet.
10
5.2 Deposition
For quantifying BC deposition in the Polar Regions we consider the accumulated mass over an area of interest during a period (i.e. year, season). When normalized quanti-ties are shown this is done considering the total mass available for deposition during the period considered, given by the initial mass suspended in the atmosphere at the 15
beginning of the period plus the mass emitted during the period. Figure 13 shows the normalized (left panels) and un-normalized (right panels) deposition north/south of
66◦N/66◦S within 48 days from the release. The values cumulated over all age classes
are reported in Table 3. Saint Petersburg has the largest fraction of its BCdp emissions deposited in the Arctic (9.4 %), followed by Moscow (5.6 %) and the Ruhr valley and 20
London (both about 4 %). However, the absolute deposition in the Arctic is comparable for these cities and also the Po-valley and Paris cause significant deposition values. The North American megacities of New York and Los Angeles give normalized deposi-tion values that are more than an order of magnitude smaller, but because of the larger BC emissions of these American cities, the actual deposition values are only about 2 to 25
ACPD
12, 26351–26400, 2012The dispersion characteristics of air
pollution from world’s megacities
M. Cassiani et al.
Title Page
Abstract Introduction
Conclusions References
Tables Figures
◭ ◮
◭ ◮
Back Close
Full Screen / Esc
Printer-friendly Version
Interactive Discussion
Discussion
P
a
per
|
Dis
cussion
P
a
per
|
Discussion
P
a
per
|
Discussio
n
P
a
per
|
BCdp deposition in the Arctic that is marginally larger, than the BCdp deposition from all the megacities in Asia (population roughly 500 million). This shows again that most of the Arctic BC deposition from megacities must be attributed to northern Eurasian sources.
The BCdp deposition over land during the winter season for latitudes north of 40◦
5
is also reported in Table 3 (columns 7 and 8). During winter, a significant fraction of land above this latitude may be covered by snow and the BC deposited may have an influence in accelerating the melting of the snow in spring (e.g. Quinn et al., 2008; Flan-ner et al., 2009). For this region, the fractional contributions from European and North American megacities are comparable, and the Asian megacities of Bejing, Tianjing, 10
and Teheran give significant fractional contribution followed by Cairo in North Africa. Similar considerations are valid for the absolute mass deposition and in this case New York City emerges as the largest contributor to deposited BCdp.
5.3 The Southern Hemisphere
Although there are just eight megacities in the SH, they represent about 12 % of the 15
total emission (see Fig. 2) in the SH from the south pole to a latitude of 25◦S. The export
of BCtr and BCdp from SH megacities to the Antarctic region is much smaller than
from NH megacities to the Arctic, and even export efficiencies relative to the emission
strength are lower. In fact, due to the generally longer distances of the SH megacities to the Antarctic region, the fraction of BCtr mass transported to the lower layer of the 20
Antarctic atmosphere (0–1 km) reaches maximum values of 2×10⁻²(Fig. 11c) in the
last age class. Values for ages of less than about 20 days are lower and there is no peak in the early age class, again due to the considerable distance of the sources from the polar region. Moreover, these values are reached only for Buenos Aires and Sidney while the other megacities and especially Lima and Jakarta, give substantially 25
lower contributions. For the depositing tracer BCdp, no more than a fraction of 10−4
ACPD
12, 26351–26400, 2012The dispersion characteristics of air
pollution from world’s megacities
M. Cassiani et al.
Title Page
Abstract Introduction
Conclusions References
Tables Figures
◭ ◮
◭ ◮
Back Close
Full Screen / Esc
Printer-friendly Version
Interactive Discussion
Discussion
P
a
per
|
Dis
cussion
P
a
per
|
Discussion
P
a
per
|
Discussio
n
P
a
per
Table 3 for both BCtr and BCdp. They show that for BCtr the total megacities emissions in the SH generate a suspended mass in the Antarctic atmosphere comparable to that produced by the single city of St. Petersburg in the Arctic. If deposition is furthermore taken into account, the suspended mass is entirely negligible with less than 100 kg of suspended mass overall.
5
The fraction of BCdp mass depositing south of 66◦S is as well very low. Our
simula-tions estimate a total annual deposition of BCdp in the Antarctic by all the megacities of about 45 tons (see Table 3), and most of it is coming from just four megacities, Sid-ney, Johannesburg, Santiago and Buenos Aires, with a marginal contribution from San Paulo and Rio de Janeiro. The comparison with the total deposition of 2330 tons of 10
BCdp from NH megacities in the Arctic shows that this deposition is very small, also considering that the total emission from NH megacities is just about 5.5 times the SH megacity emissions. However, this 45 tons of deposition is comparable to the local
emissions, below 60◦ south, of BC from shipping (100 tons) as reported by Stohl and
Sodemann (2010) based on the emission inventory of Bond et al. (2007), with tourist 15
ships contributing about 20 tons (Stohl and Sodemann, 2010). Also, if we consider the
12 % megacity emissions representative of all SH emissions south of 25◦S, we can
estimate that less than 400 tons of BCdp are deposited in the South Pole region from all continental sources.
6 Exposure of human population
20
In this section, population (P) and annual mean ground level concentration (GLC) maps
are combined to derive simple but quantitative measures of the exposure of the human population to air pollution from megacities. Particular focus will be on the relative im-portance of population exposure inside and outside the megacity. We use the GLC multiplied by population (CmP) as a measure of total population exposure to air pollu-25
ACPD
12, 26351–26400, 2012The dispersion characteristics of air
pollution from world’s megacities
M. Cassiani et al.
Title Page
Abstract Introduction
Conclusions References
Tables Figures
◭ ◮
◭ ◮
Back Close
Full Screen / Esc
Printer-friendly Version
Interactive Discussion
Discussion
P
a
per
|
Dis
cussion
P
a
per
|
Discussion
P
a
per
|
Discussio
n
P
a
per
|
CmP (t)=CmPi t= X
alli j
Pi j i t
X
l=1
GLCi j,l.
Herei, j are grid indices, indicating that the metric is integrated over the entire globe,
and it is the index of the age class considered. Therefore, CmP is a function of time
since emission and the concentration used is given by the summation of the concen-tration associated with the current and the previous age classes. The values computed 5
for the 48 days age class are reported in Table 1 for both BCtr and BCdp. Notice that since the lifetime of BCdp is substantially shorter than 48 days for all cities, the metric measures the total impact of BCdp. The table shows that the largest values of CmP are reached for the megacities in Asia, with Dhaka setting the records of 149 and 104
(1010ng m−3 people) respectively for BCtr and BCdp. The first non Asian megacity is
10
the extended New York area which ranks seventh, with values of 40 and 22 for BCtr and BCdp, while the first-ranking European city is Moscow with CmP values of 19 and 14.
Figure 14 shows the values for all the age classes, and it can be seen that when deposition is considered the CmP exposure metric for BCdp (Fig. 14, right) is quite 15
flat and determined mainly by the exposure on the very first day. This is due to a combination of three factors: (i) the highest population density at the location of the release (i.e. within the megacity), (ii) all BCdp is initially located near the surface, and (iii) the quick loss of BCdp mass with time. This suggests that most of the population exposure to BCdp occurs within or very close to the megacity. Also for the conserved 20
tracer BCtr, CmP values do not grow substantially after the first day (Fig. 14, left), suggesting that even for long-lived pollutants most of the population exposure occurs in the city or its vicinity. This is also the reason why the CmP values for BCtr and BCdp are quite similar for most cities, suggesting that population exposure is not very sensitive to a substance’s lifetime, if it is longer than a day.
ACPD
12, 26351–26400, 2012The dispersion characteristics of air
pollution from world’s megacities
M. Cassiani et al.
Title Page
Abstract Introduction
Conclusions References
Tables Figures
◭ ◮
◭ ◮
Back Close
Full Screen / Esc
Printer-friendly Version
Interactive Discussion
Discussion
P
a
per
|
Dis
cussion
P
a
per
|
Discussion
P
a
per
|
Discussio
n
P
a
per
In Table 1 we also report the population weighted concentration for the city (PWCcity)
for BCtr and BCdp:
PWCcity=
1 Pcity
X
i j∈city
Pi j Na X
l=1
GLCi j,l,
i.e. the same as the CmP metric but computed only for the grid cells defining each
megacity, with GLC integrated over all the age classes (Na=10), and normalized with
5
the megacity’s total population (Pcity). This metric measures the concentration to which
the population inside the city is exposed to, on average. Some interesting features arise when comparing the megacities. The highest value of PWC can be found in Asian
megacities with Seoul having value of 1621 and 1535 ng m−3respectively for BCtr and
BCdp. The lowest values are registered for Istanbul, respectively 64 and 61 ng m−3for
10
BCtr and BCdp. It should be noted that for cities covering only one cell this value is the same as the maximum concentration in the domain, while it can be significantly lower for larger megacities.
A further parameter of interest is CmP normalized by CmP obtained when integrating
only over the megacity grid cells, called here CmPc. This metric (CmP/CmPc) measures
15
the total population exposure relative to the exposure inside the city. These values are plotted as a function of the age in Fig. 15. First, we note that for the non depositing tracer BCtr, several cities have an impact on surrounding regions which is at least half
as large as on the population of the city itself (i.e. CmP/CmPc>1.5), but few cities
have an impact outside the city’s boundaries larger than the impact inside the city 20
boundary (i.e. CmP/CmPc>2) and only three cities reach this thresholds if deposition
is taken into account (Fig. 15, right panel). For BCtr, Saint Petersburg shows the largest
CmP/CmPcvalues but only for ages greater than 10 days. This is due both to the fact
that it is surrounded but not closely surrounded, by relatively densely populated areas and that it has the smallest population among the cities considered (thus, reducing the 25
ACPD
12, 26351–26400, 2012The dispersion characteristics of air
pollution from world’s megacities
M. Cassiani et al.
Title Page
Abstract Introduction
Conclusions References
Tables Figures
◭ ◮
◭ ◮
Back Close
Full Screen / Esc
Printer-friendly Version
Interactive Discussion
Discussion
P
a
per
|
Dis
cussion
P
a
per
|
Discussion
P
a
per
|
Discussio
n
P
a
per
|
Paulo, since these are densely populated areas surrounded by relatively sparsely pop-ulated areas and are close to the ocean. In the NH, Tokyo stands out with the lowest value of the ratio, since most of its pollution is exported to the ocean. If deposition is
accounted for (BCdp) Sydney also has a very low CmP/CmPc ratio while the cities
showing highest values of CmP/CmPc are the densely populated Chinese megacities
5
of Tianjin and Beijing, which are actually surrounded by regions with extremely high population density outside the city boundaries, and the city of Karachi. This last city shows high impact only after about 5 days, thus this should be due to the Karachi’s plume impacting on densely populated Indian urban areas. It is interesting to note that
the cities with high CmP/CmPc ratio also have a quite high index of low level BCdp
10
export (ELR1km, Fig. 8b).
In general and especially for the BCdp tracer, it seems that the impact of megacities on population outside their boundaries relative to their impact inside city boundaries is low, with only three of the megacities (Tianjin, Beijing and Karachi) showing an im-pact comparable or greater than the imim-pact inside the cities, while most of the cities 15
have CmP/CmPc<1.4. It is also of some interest to note that based on the time related
behavior of this index one could speculate whether the impact on population is transna-tional. For example when deposition is involved the Chinese megacities of Tianjin and
Beijing have an index CmP/CmPc>1.6 already in the first age class (less than a day)
and this value does not grow substantially with age. Therefore, most of their influence 20
is on national population. On the contrary, Karachi reaches a similar index only in the second age class (3 days) so it is probably related to transboundary pollution transport. Based on the age class spectrum it is also easily possible to extrapolate the behavior for decaying scalars but in case of BCdp any superimposed decay with characteristic time greater than about ten days would basically leave the results unchanged.