www.atmos-chem-phys.net/14/3843/2014/ doi:10.5194/acp-14-3843-2014
© Author(s) 2014. CC Attribution 3.0 License.
Atmospheric
Chemistry
and Physics
On the variability of atmospheric
222
Rn activity concentrations
measured at Neumayer, coastal Antarctica
R. Weller1, I. Levin2, D. Schmithüsen2, M. Nachbar2, J. Asseng1, and D. Wagenbach2
1Alfred-Wegener-Institut Helmholtz-Zentrum für Polar- und Meeresforschung, Am Handelshafen 12,
27570 Bremerhaven, Germany
2Institut für Umweltphysik, Heidelberg University, Im Neuenheimer Feld 229, 69120 Heidelberg, Germany
Correspondence to:R. Weller ([email protected])
Received: 15 November 2013 – Published in Atmos. Chem. Phys. Discuss.: 13 December 2013 Revised: 18 February 2014 – Accepted: 20 March 2014 – Published: 17 April 2014
Abstract. We report on continuously measured 222Rn
ac-tivity concentrations in near-surface air at Neumayer Sta-tion in the period 1995–2011. This 17-year record showed no long-term trend and has overall mean ±standard devi-ation of (0.019±0.012) Bq m−3. A distinct and persistent seasonality could be distinguished with maximum values of (0.028±0.013) Bq m−3 from January to March and mini-mum values of (0.015±0.009) Bq m−3from May to Octo-ber. Elevated222Rn activity concentrations were typically as-sociated with air mass transport from the Antarctic Plateau. Our results do not support a relation between enhanced222Rn
activity concentrations at Neumayer and cyclonic activity or long-range transport from South America. The impact of oceanic222Rn emissions could not be properly assessed but
we tentatively identified regional sea ice extent (SIE) vari-ability as a significant driver of the annual222Rn cycle.
1 Introduction
The radioactive noble gas radon, specifically the isotopes
222Rn and220Rn are the sole gaseous progenies of the238U
and232Th radioactive series, respectively. Both natural
ac-tinides are trace elements omnipresent in all minerals and soils (Nazaroff, 1992).222Rn is a direct product of the α
-decay of226Ra about a factor of 10−4less abundant in
sur-face ocean waters compared to terrestrial soils (Wilkening and Clements, 1975) making the ocean only a minor222Rn
source. From these global surface sources, the gaseous de-cay product222Rn (and to a lesser extent220Rn because of
its much shorter radioactive half-life timeT1/2of 56 s
com-pared to 3.82 d for222Rn) are continuously emitted into the
atmosphere. Apart from local mineralogy and element com-position of the soil, continental emission rates depend on soil texture and soil humidity and typically range between 0.005 and 0.050 Bq m−2s−1(Nazaroff, 1992; Karstens et al.,
2013), about two orders of magnitude higher than oceanic emissions (e.g. Schery and Huang, 2004). For the latter a re-cent study derived from long-term222Rn observation at Cape Grim (Tasmania) an oceanic222Rn emission rate of around 2.7×10⁻⁴Bq m−2s−1(Zahorowski et al., 2013).
There are three main issues attracting some attention to at-mospheric222Rn, usually specified as activity concentrations
in units of Bq m−3: (i) being anα-emitter,222Rn is a potential
health hazard, particularly in certain regions with elevated
226Ra occurrence and in poorly ventilated buildings built
with 226Ra rich stonework (Nazaroff, 1992); (ii) in terms
of atmospheric chemistry, ionizing radiation emanated from
222Rn entails ion mediated particle nucleation, preferentially
within the continental planetary boundary layer (PBL; Har-rison and Carslaw, 2003; Hirsikko et al., 2011; Zhang et al., 2011); there,222Rn could exceed the impact of cosmic radi-ation on particle nucleradi-ation (Zhang et al., 2011); (iii) con-sidering the relatively short radioactive half-life of 3.82 d combined with chemical inertness, the atmospheric and ra-dioactive lifetimes of222Rn are identical. Hence,222Rn is a
(e.g. Law et al., 2010). Due to these attributes, observed atmospheric 222Rn activity concentrations were frequently
used to validate global atmospheric circulation models (e.g. Jacob et al., 1997). Basically all these applications of atmo-spheric222Rn activity concentrations broadly presume
neg-ligible oceanic 222Rn emissions. Interestingly, in a recent
study long-term222Rn observations from the remote station
Cape Grim were employed to derive oceanic222Rn emission
rates by carefully screening the data set, mainly with the help of a thorough backward trajectory analysis (Zahorowski et al., 2013). In addition, Taguchi et al. (2013) assessed222Rn
air–sea transfer rates derived from ship-borne 222Rn mea-surements with the help of a global atmospheric transport model. Both approaches illustrated that in certain remote ma-rine regions the impact of mama-rine222Rn emissions may be
de-cisive. Among such regions, notably Antarctica and the sur-rounding Southern Ocean have to be considered, particularly with regard to the fact that the ice covered Antarctic conti-nent is virtually free from222Rn emissions. Moreover, due to
the fact that air–sea exchange is highly dependent on surface wind velocity, specifically the stormy Southern Ocean could be a significant 222Rn source (Schery and Huang, 2004;
Taguchi et al., 2013). Previous measurements from that re-gion revealed extremely low 222Rn activity concentrations
(Maenhaut et al., 1979; Polian et al., 1986; Pereira, 1990; Lambert et al., 1990; Wyputta, 1997; Ili´c et al., 2005), which may be hypothetically consistent with recently ascertained marine emissions there (Zahorowski et al., 2013). Modelling studies by Heimann et al. (1990) predicted for instance in the case of Neumayer a contribution of oceanic222Rn
emis-sions to be around 28 % (derived from Table 2 therein). Nev-ertheless, data evaluation and discussion presented in previ-ous studies implied that background222Rn activity
concen-trations in this region were mainly determined by long-range transport from continental region, i.e. for the Atlantic sector of Antarctica dominantly from South America (Polian et al., 1986; Pereira, 1990; Lambert et al., 1990; Wyputta, 1997). Observed spikes in222Rn activity concentrations, so-called
radon storms frequently exceeding background activity con-centrations by about an order of magnitude for several hours, were usually attributed to efficient long-range transport by cyclonic activity from South America (Polian et al., 1986; Wyputta, 1997). Apart from an only local impact of Antarc-tic222Rn emissions from very few ice-free regions situated mainly on the Antarctic Peninsula (Pereira, 1990) but prob-ably also in coastal dry valleys and high mountain ranges, recent investigations of Taguchi et al. (2013) suggested a per-ceptible contribution of these sources for the remote South-ern Ocean. However, considering the extremely small all-up area of insularly distributed rocky places in continental Antarctica, this appears somewhat arguable.
In this paper we present an analysis of long-term222Rn
activity concentrations recorded continuously at the German Antarctic Station Neumayer (NM) from 1995 to 2011. We shall discuss the variability of this time series on
differ--150° -120°
-90° -60°
-30° 0° 30°
60°
90°
120°
150° 180°
-90°
-60°
-30°
Neumayer
HalleyMawson
Dumont d’Urville Iles Crozet
Iles Kerguelen
Ile Amsterdam Vernadsky
Fig. 1.Map of the high-latitude Southern Hemisphere showing the
locations of the measuring sites discussed in the text.
ent timescales, especially focusing on its distinct seasonal-ity. The central topic guiding us through the analysis is the question of to what extent marine, in contrast to continen-tal,222Rn emissions were responsible for the observed
vari-ability, bearing in mind that marine222Rn emissions should
be decisively governed by the seasonal wax and wane of sea ice. Our evaluation is further supported by local mete-orological observations, backward trajectories, sea ice ex-tent records and finally long-term210Pb measurements
(El-sässer et al., 2011), a222Rn progeny with a half-life time of
T1/2= 22.3 years.
2 Experimental techniques and data evaluation
methods
2.1 Site description
222Rn measurements were conducted during the period 1995
2.2 Atmospheric222Rn activity measurements
The activity concentration of the noble gas222Rn was
indi-rectly determined by measuring the activity of the short-lived metallic daughters, namely 218Po (T1
/2= 3 min) and 214Po
(T1/2= 162 µs−1) which are attached to sub-µm aerosol
parti-cles immediately after generation (Porstendörfer, 1994). We used a well-established home-made222Rn monitor based on the static filter method (Levin et al., 2002). In short, the ba-sic components of this monitor comprised an adapted fil-ter holder equipped with quartz fibre filfil-ter (Whatman QMA, ∅47 mm), anα-detector with pre-amplifier and required data
acquisition electronics. A continuously monitored flow of ambient air was pumped through the quartz filter, enabling a complete interception of all particle-bound222Rn progenies.
At the same time, the overlappingαactivity spectra of218Po
(αE= 6.0 MeV) and214Po (αE= 7.7 MeV), were measured in
situ with a surface barrier detector (Canberra CAM AB 900 mm2active surface, energy resolution 50 keV at 5.486 MeV).
At NM, the meanα-activity of the222Rn daughters was
de-termined in 3 h intervals. From the measured214Po activity
we then estimated the atmospheric222Rn activity
concentra-tion, assuming radioactive equilibrium between222Rn and its daughter214Po. The overall accuracy of our222Rn activ-ity concentrations measured at NM was estimated to be about ±(25–30) %. This estimate includes the uncertainties of flow rate, detection noise and counting statistics as well as the po-tential disequilibrium between222Rn and214Po. For the
lat-ter, we considered the fact that disequilibrium effects were not determined at NM. The reproducibility of our measure-ments at NM has been determined to better than 15 % based on parallel measurements of two independent monitors over a period of more than 6 months. Continuous222Rn
obser-vation started at NM in February 1983. The respective data set prior to 1995 is not included here, since the assimilation of the counts has been achieved via pre-set energy windows rather than ADC-based spectrum assay. The lower quality in the raw count data evaluation allows us to refrain from dis-cussing the entire NM radon record, although mean222Rn levels in the pre-1995 period are quite comparable to those presented here (see Wyputta, 1997).
2.3 Evaluation methods and auxiliary data sources
In order to study the origin of the advected air masses we rely on 10-day backward trajectories provided by the HYS-PLIT 4.0 (Hybrid Single-Particle Lagrangian Integrated tra-jectory; http://www.arl.noaa.gov/documents/reports/hysplit_ user_guide.pdf). For all trajectory calculations we used NCAR/NCEP reanalysis meteorological data with a spatial resolution of 2.5◦×2.5◦(longitude×latitude grid). Calcula-tions were executed in 1-hour time steps. Due to the fact that vertical wind components in reanalysis data could be some-what problematic especially for regions with sparse meteo-rological input data (like the Southern Ocean; Harris et al.,
2005), all trajectories were calculated using the 3-D wind fields of the reanalysis data as well as employing the isen-tropic approximation. There were significant differences be-tween individual 10-day back trajectories calculated either under 3-D (wind vector from meteorological data) or isen-tropic approximation, but the general advection characteris-tic on which our conclusions were finally based appeared ro-bust. More information on the accuracy of back trajectory estimates can be found in a review by Stohl (1998). There-fore we conclude that the simple backward trajectory anal-yses used here are appropriate for our purpose, particularly with regard to the sparse underlying meteorological data for high southern latitudes. For the same reason the validity of back trajectories exceeding 10 days appeared little conclu-sive due to their large spatial uncertainty.
In contrast to ice-free terrestrial surfaces, the Antarctic continent can be regarded as virtually 222Rn source-free,
more precisely222Rn emissions are restricted to a few
out-cropping rocks (so-called nunataks) especially on the Antarc-tic Peninsula, bare soil and rocky terrains at the coastal ice edge and in dry valleys. Irrespective of the fact that the sur-face could be a222Rn source or sink (the latter for
particle-bound 222Rn progenies), the characteristics of the
bound-ary layer, in particular the depth of the mixing layer, co-determines the actually measured atmospheric222Rn
activ-ity concentration. Surface inversions are prevalent in Antarc-tica extending up to about 2 km during winter while from November to February inversions are rare and confined to heights of less than 1 km (König-Langlo et al., 1998). How-ever, for most of the time an at least moderately stable bound-ary layer (SBL) is present, whose thickness can be estimated as the lowest altitude above ground where the vertical heat flux ceased to a small fraction of its surface value (typically 5 %, Caughey et al., 1979). According to Handorf (1996) the SBL at NM typically ranged between 10 m and 50 m, consis-tent with tethersondes and sodar results from Halley Station (Anderson and Neff, 2008; Jones et al., 2010), like NM a site on the ice shelf with comparably flat surface topography. Al-though vertical mixing depth is not well characterized in a SBL (Anderson and Neff, 2008), we tried to gauge vertical mixing in that layer like in Weller et al. (2011a) by using the local bulk Richardson number (Stull, 1988):
RiB= g1θ/1z
θh(11zU)2+(11zV)2i
, (1)
withg the gravitational constant (9.81 m s−2),zthe height
above ground, θ the dry potential temperature, and U and V the horizontal wind vectors inx andy direction, respec-tively. Gradients were approximated by the difference of the measured temperatures and wind velocities at 2 m and 10 m height. Note that at least for small Richardson numbers (well below 1.0), fluxes within the SBL appear to be a continuous function of RiB (Fernando and Weil, 2010, Mauritsen and
Fig. 2.222Rn activity time series based on daily means; red circles
refer to summer (JFM) values.
Fig. 3.222Rn activity time series based on monthly means.
Finally we used sea ice extent (SIE; i.e. sea ice area in units 106km2) data from the National Snow and Ice Data Center
(NSIDC, http://nsidc.org/) with an original grid resolution of 25×25 km2 until 2002 and from then on 6.25×6.25 km2. Our analysis was based on a resampled data set with a longi-tudinal resolution of 10 degrees (Weller et al., 2011b).
3 Results
3.1 Data presentation
Figure 2 presents an overview of the daily mean222Rn
activ-ity concentration time series continuously recorded between 1995 and 2011 at NM. In addition, monthly means of the time series are depicted in Fig. 3 (Supplement data are avail-able at http://doi.pangaea.de/10.1594/PANGAEA.822027). At first glance, overall222Rn levels at NM appeared constant throughout the observation period, with a long-term median of 0.016 Bq m−3 (mean = 0.019 Bq m−3, standard deviation
SD = 0.012 Bq m−3). Indeed, a statistical trend analyses,
ei-ther by simple linear regression or non-parametric rank-order Mann–Kendall test with Sen’s slope estimate (Hirsch et al., 1982), revealed no meaningful long-term trend. Neverthe-less, there seems to be a broad and gentle maximum between 1998 and 2006, especially discernible in Fig. 3.
Apart from the latter rather marginal and yet unex-plained finding, the salient feature is a striking season-ality with a maximum around austral summer (Fig. 4).
Fig. 4.Box plots for the mean seasonality of222Rn activity
ob-served from 1995 to 2011. Lines in the middle of the boxes repre-sent sample medians (mean: red line), lower and upper lines of the boxes are the 25th and 75th percentiles; whiskers indicate the 10th and 90th percentiles, dots 5th and 95th percentiles.
This summer maximum appears uniformly each year between January and March with a mean ±SD of (0.028±0.013) Bq m−3and these three months (JFM) will be henceforth defined as (local) “summer”. A broad mini-mum of (0.015±0.009) Bq m−3emerged from May to Octo-ber (MJJASO) and this period will be termed (local) “winter” throughout the paper. Finally we address here the variability on smaller timescale and inspect to this end the222Rn time
series in the highest available temporal resolution (3 h bins) separately for summer and winter; however, we cannot detect any significant diurnal cycle in either case.
3.2 Impact of local meteorology and long range
transport
In contrast to aerosol-bound radionuclides like 210Pb, the
sole222Rn sink is radioactive decay which occurs
homoge-neously throughout a vertical air column while for the for-mer a vertical gradient caused by the surface sink is typi-cal. Taking into account that the ice shelf is definitely222Rn source-free, a given222Rn reservoir below a surface inver-sion layer should be more or less depleted by radioactive decay, provided this inversion layer is isolated from the at-mosphere above. In this regard we have to consider that dur-ing summer a nocturnal inversion layer, largely preventdur-ing vertical mixing, could be frequently observed at NM. Re-garding the radioactive decay time, we may barely expect a significant diurnal222Rn cycle, since an even 12 h lasting
surface inversion would at most cause 14 %222Rn depletion.
This conclusion, which is consistent with our observations, was further supported by an analysis in terms of PBL sta-bility, assessed by bulk Richardson numberRiB(accordingly
defined as turbulent PBL forRiB<0.25 compared to
no significant difference (p=0.9) in 222Rn activity
con-centrations could be verified between both stability cases (0.0279 Bq m−3compared to 0.0283 Bq m−3for laminar and
turbulent conditions, respectively). The situation is differ-ent for polar night where222Rn activity concentrations
ap-peared significantly higher (p=0.0002) in a well-mixed,
turbulent boundary layer (0.0157 Bq m−3,N=8726)
com-pared to laminar flow conditions (0.0135 Bq m−3,N=228).
During that period, vertical mixing should usually be much longer suppressed by persistent surface inversions, occasion-ally lasting for several days compared to only some hours during polar day. A more detailed inspection revealed, how-ever, that distinct222Rn depletion events are rarely observed under such lasting stagnant flow condition, indicating that an effective isolation of near-surface air masses at NM was usu-ally not given. Nevertheless, we tentatively argue that on the whole, stagnant conditions (characterized byRiB>1)
proba-bly caused on average appreciaproba-bly lower222Rn activity
con-centrations within the SBL during winter.
In a further attempt we examined the prevalent assump-tion that222Rn-rich air masses are efficiently advected by
cyclonic activity from northerly continents (mainly South America in the case of NM) towards Antarctica (Polian et al., 1986; Pereira, 1990; Wyputta, 1997). To this end we relied on long-term meteorological observations at NM (König-Langlo et al., 1998), and categorized the general weather sit-uation into “marine cyclonic” with high wind velocities>15
m s−1 associated with easterly wind directions within the sector 60◦–120◦ in contrast to “continental”, characterized by low wind velocities<8 m s−1and southerly wind
direc-tions between 140◦ and 200◦. Again, we examined 222Rn
activity concentrations under these weather conditions sep-arately for summer and winter. Contrary to our expecta-tions, daily mean 222Rn activity concentrations were
sig-nificantly higher (p <10−88) under continental advection
from the interior ice sheet during summer (0.0326 Bq m−3,
N=5428, compared to 0.0246 Bq m−3, N=1972 for ma-rine cyclonic conditions), while for winter virtually no dif-ference was discernible (p=0.5; 0.0155 Bq m−3compared
to 0.0150 Bq m−3for continental and marine cyclonic
condi-tions, respectively).
This rather simple evaluation was further supported by more detailed trajectory analyses. First we calculated 10-day backward trajectories for 10-days with the 10 highest mean
222Rn activity concentrations (so-called radon storms)
try-ing to identify long-range transport from northward conti-nents, especially South America. Surprisingly, the result pre-sented in Fig. 5 did not show any “radon storm trajectory” originating from South America or any other northern con-tinent. In a next attempt, the same procedure was done for the 10 lowest daily222Rn activity concentrations (Fig. 6).
In contrast to highest222Rn events, lowest values could be
observed throughout the year without a distinct seasonal preference. In conclusion, neither the highest nor the low-est observed222Rn activity concentrations were linked with
-150° -120°
-90° -60°
-30° 0° 30°
90°
120° 150°
180° -90° -75° -60°
-45° 1999/03/10_72.5 mBq/cbm2000/03/05_96.9 mBq/cbm 2001/03/29_75.4 mBq/cbm 2001/03/30_80.2 mBq/cbm 2002/05/02_82.9 mBq/cbm 2003/12/17_288.7 mBq/cbm 2004/03/08_93.2 mBq/cbm 2005/07/24_254.9 mBq/cbm 2008/01/15_70.5 mBq/cbm 2009/02/04_71.6 mBq/cbm 2009/03/10_111.7 mBq/cbm
Fig. 5.The 10-day back trajectories for highest222Rn activity
con-centrations.
-150° -120°
-90° -60°
-30° 0° 30°
90°
120°
150° 180°
-90° -75° -60° -45°
2001/01/01_2.4 mBq/cbm 2001/02/02_0.24 mBq/cbm 2001/06/23_0.26 mBq/cbm 2001/11/15_2.8 mBq/cbm 2001/11/21_2.8 mBq/cbm 2001/12/07_2.3 mBq/cbm 2001/12/08_1.2 mBq/cbm 2001/12/20_1.5 mBq/cbm 2002/02/01_2.9 mBq/cbm 2011/12/01_2.3 mBq/cbm
Fig. 6.The 10-day back trajectories for lowest222Rn activity
con-centrations.
a characteristic advection scheme. In addition most of the shown trajectories implied long-range transport. Considering in summary all daily trajectories in conjunction with the NM
222Rn time series, during summer 10-day backward
trajecto-ries related to low222Rn events (below 1 SD of the mean,
i.e.< 0.013 Bq m−3, N = 139) seem mainly localized at distances less than 1000 km to NM. Corresponding trajecto-ries linked with elevated222Rn activity concentrations (1 SD
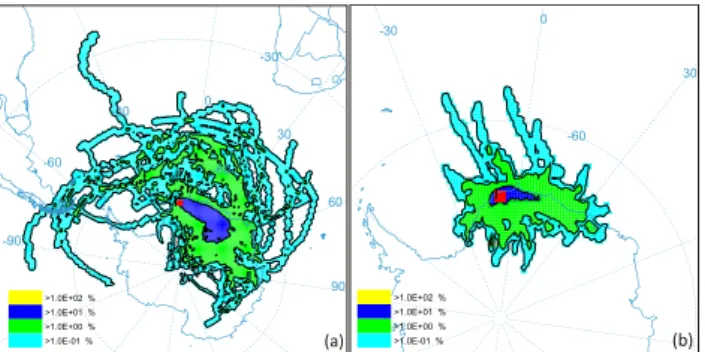
above of the mean, i.e.>0.043 Bq m−3,N=188) frequently indicated long-range transport (Fig. 7). Remarkably in this case, a large part of the trajectories move across the Antarc-tic plateau (Fig. 7a; blue region showing the highest relative number of trajectories intersecting with a 1◦×1◦grid cell), contrary to the case of low222Rn conditions (Fig. 7b).
Fi-nally, we note that immediate air mass transport from South America was found to be generally rare: less than 5 % of all 10-day backward trajectories eventually originated from this radon source region. Concerning winter, no meaningful dif-ferences in the trajectory pattern between high (above 1 SD of the mean, i.e> 0.023 Bq m−3in this case,N=257) and low (below 1 SD of the mean, i.e.<0.007 Bq m−3,N=209)
-90 -60
-30 0
30
60
90 -60
-30
I
>1.0E+02 % >1.0E+01 % >1.0E+00 %
>1.0E-01 % (a)
-30 0
30
-60
I
>1.0E+02 % >1.0E+01 % >1.0E+00 %
>1.0E-01 % (b)
Fig. 7.Daily 10-day back trajectories for summer. Shown is the
rel-ative (percentage) number of trajectory intersection on a given grid cell (resolution 1◦×1◦). The left-hand plot
(a)presents all 10-day
back trajectories for222Rn activity concentrations above 1 SD of the mean (>0.043 Bq m−3,N=188), while on the right(b)the corre-sponding 10-day back trajectories for222Rn activity concentrations below 1 SD of the mean (<0.013 Bq m−3,N=139) are shown.
In summary, elevated222Rn activity concentrations at NM
tended to be typically linked with southerly air mass flow from the Antarctic Plateau and especially during winter, to a transiently turbulent (local) PBL. Based on our observa-tions, the role of222Rn emissions from ice-free regions in
Antarctica could not be assessed, though the fact that222Rn
levels at NM were comparable to the rocky site DDU cast into doubt a significant contribution of ice-free regions. Sur-prisingly and in contrast to previous reporting on Antarctic radon (Antarctic Peninsula: Polian et al., 1986 and Pereira, 1990; NM data from 1984 to 1989: Wyputta, 1997), at least for summer222Rn levels at NM appeared to be relatively low during stormy conditions, i.e. when NM was governed by northerly passing cyclones. As for winter, a cyclonic impact on222Rn levels was not apparent at all.
4 Discussion
4.1 Seasonal aspects: impact of transport efficiency
Previous measurements indicated that atmospheric222Rn
ac-tivity concentrations decrease distinctly from temperate re-gions of the Southern Ocean towards Antarctica (Polian et al., 1986, Lambert et al., 1990). Highest mean values were observed on the sub-polar sites Îles Crozet, Îles Kerguelen, and Amsterdam Island (annual mean around 0.04 Bq m−3).
At these sites222Rn time series were accompanied by a
sea-sonal maximum between May and August (Polian et al., 1986). For coastal Antarctica annual mean 222Rn activity
concentrations measured at Dumont d’Urville (DDU) ap-peared comparable to NM, but were about a factor of two lower at Mawson. Although the reported222Rn seasonality at
DDU and Mawson was similar to NM and characterized by a marked maximum during polar day (summer), the seasonal amplitude at Mawson was much lower (Polian et al., 1986;
Lambert et al., 1990). Note, however, that the distinct dis-crepancy in the summer maximum between DDU and Maw-son is not supported by more recent observations from the latter site (Zhang et al., 2011, Fig. 11 therein). At the Antarc-tic Peninsula (Vernadsky Station, 65◦15’S, 64◦ 16’W) the
222Rn maximum was shifted to April (Ili´c et al., 2005).
Obvi-ously,222Rn seasonality at sub-Antarctic islands showed the
exact opposite to those of coastal Antarctica. Lowest222Rn
levels were reported from the South Pole (typically between 0.011 and 0.015 Bq m−3), but here the reported data set was
too short to derive an annual cycle (Maenhaut et al., 1979). The different seasonality and higher222Rn levels within the temperate zone of the Southern Ocean compared to Antarc-tica has been explained by (i) a closer proximity to the north-ern source continents and (ii) efficient long-range transport from these sources by cyclonic activity peaking in the win-ter season (Polian et al., 1986). For Antarctica, on the other hand, the persistence of the surface inversion layer during po-lar night prevents down-mixing of air masses from northerly regions and shifts the seasonal maximum towards polar sum-mer (Polian et al., 1986). These assumptions definitely ne-glected the impact of regional or even nearby oceanic222Rn
emissions. Model simulations by Heimann et al. (1990) con-sidering merely long-range 222Rn transport from northerly
continents to Antarctica essentially failed in describing the annual222Rn cycle observed at DDU.
In discussing the pronounced 222Rn seasonality at NM, we have first to consider a potential impact of the disequi-librium between 222Rn and the (measured) 214Po activity, discussed by Levin et al. (2002), as well as a potential loss of un-attached222Rn progeny in the aerosol-based sampling
system. The apparent resemblance of the mean222Rn
sea-sonality (Fig. 4) with the mean annual cycle of condensa-tion particle (CP) concentracondensa-tions at NM (Weller et al., 2011a, Fig. 4 therein) suggests such an interference. Unlike the no-ble gas222Rn the metal214Po is attached to sub-µm aerosol
particles and hence the disequilibrium could be higher at low particle concentrations during winter. To clarify this point, we investigated the relation between CP concentrations and
222Rn activity concentrations. The result is shown in Fig. 9.
We calculated a Pearson correlation coefficientrto be 0.213
(r2= 0.045; N=42 434) for the highest available tempo-ral resolution of the data (3-hour means), and somewhat higher for daily mean values (r2= 0.076;N=5365). In addi-tion we repeated the correlaaddi-tion analysis with corresponding monthly anomalies of the measured CP concentrations and
222Rn activity concentrations (for calculation of anomalies
see Weller et al., 2011b). No statistically significant corre-lation (r2= 0.02,p=0.084;N=206) could be detected in this case. We reason that at most less than about 7.6 % of the 222Rn variability could be explained by CP
concentra-tion variability, excluding a relevant impact of particle num-ber concentrations on observed222Rn activity (note that the
peak-to-valley ratio of the annual222Rn cycle is around a
-60
I
>1.0E+02 % >1.0E+01 % >1.0E+00 %
>1.0E-01 % (a)
-60
I
>1.0E+02 % >1.0E+01 % >1.0E+00 %
>1.0E-01 % (b)
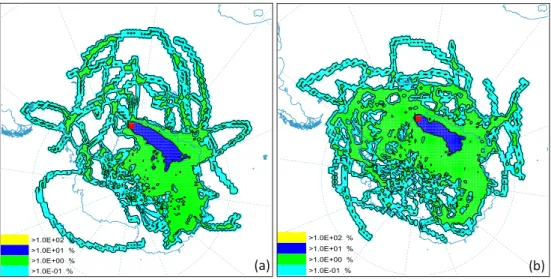
Fig. 8.The same presentation as in Fig. 7, but now for winter:(a)all 10-day back trajectories for222Rn activity concentrations above 1 SD
of the mean (>0.023 Bq m−3,N=257) and(b)for222Rn activity concentrations below 1 SD of the mean (<0.007 Bq m−3,N=209).
(a)
(b)
Fig. 9.Relation between CP concentrations presented on(a)linear as well as(b)on logarithmic scale and222Rn activity concentrations. Data
points correspond to 3 h means, i.e. the highest available temporal resolution of the measured222Rn activity concentrations. The calculated Pearson correlation coefficient isr=0.213 (r2=0.045;N=42 434).
significant impact of potentially aerosol-depleting weather conditions like snow drift, precipitation or (very rare) fog events on observed 222Rn activity concentrations at NM.
Concerning inlet efficiency, test measurements indicate only minor222Rn losses, typically within 5–10 %.
Consequently other potential reasons for the observed
222Rn seasonality have to be examined. With the tentative
assumption that in our case a southern hemispheric conti-nent north of Antarctica is the main source region for atmo-spheric222Rn, a comparison with the mean annual cycle of
the following tracers and parameters also measured at NM appeared worthwhile and is summarized in Fig. 10: (a) the
222Rn progeny210Pb (Elsässer et al., 2011), (b) the mineral
dust tracer Lanthanum (La) for which the main source re-gion is again South America (Weller et al., 2008), (c) the bulk Richardson number as a measure for boundary layer sta-bility, and finally (d) SIE. Obviously, amplitude and narrow
width of the seasonal222Rn maximum were clearly
outstand-ing among all the other atmospheric tracers. Only regional SIE showed a strong and narrow minimum coinciding with the222Rn maximum (Fig. 10d).
A potential cause of the different seasonality observed for
222Rn and its progeny210Pb could be wet and dry
deposi-tion, which is almost irrelevant for the noble gas222Rn but
crucial for the particle-bound 210Pb isotope. But from this
point of view, it is hard to explain why210Pb was apparently
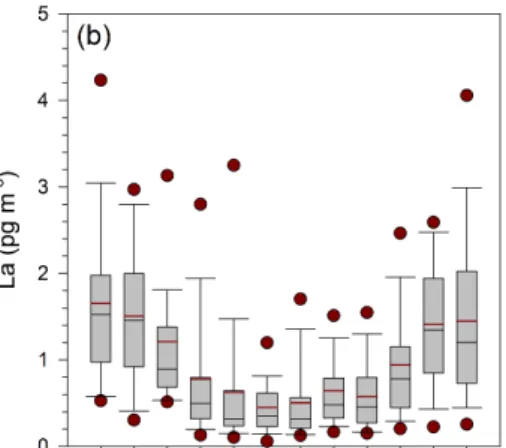
much more efficiently depleted during mid-summer (JFM) compared to spring (Figs. 4 and 10a). The situation is differ-ent at DDU where222Rn and210Pb seasonality coincided as expected (Lambert et al., 1990). Similar to210Pb the mineral dust tracer La showed at NM a rather broad annual cycle, in contrast to222Rn and210Pb (Figs. 4, 10a and b). As
Fig. 10.Box plots for the mean seasonality of(a)210Pb concentration,(b)La concentration,(c)bulk Richardson numberRiBand(d)SIE for the sector 20◦–30◦. For description of symbols see Fig. 4.
seasonality of the mineral dust source strength and higher at-mospheric residence time of210Pb compared to the primarily
large mineral dust particles (Elsässer et al., 2011). Finally, the seasonality of boundary layer stability estimated byRiB
appeared as the less pronounced and most dissimilar com-pared to222Rn (Fig. 10c). Consequently, in terms of source
strength and atmospheric transport efficiency we would ex-pect a much broader and less pronounced seasonal 222Rn
maximum at NM provided that South America was the main source region.
4.2 Seasonal aspects: impact of marine emissions and
SIE
There are marked similarities between the seasonality of
222Rn and SIE indicating oceanic222Rn emissions as main
source. In this case only open water comes into considera-tion, because the ice shelf itself and also the sea-ice-covered
ocean can be regarded as negligible 222Rn sources. This
source should be dominant during SIE minimum concur-rently with the annual222Rn summer maximum (Figs. 4 and
10d). Notwithstanding, a statistical analysis based on daily SIE data in 10◦longitude resolution along with222Rn activity
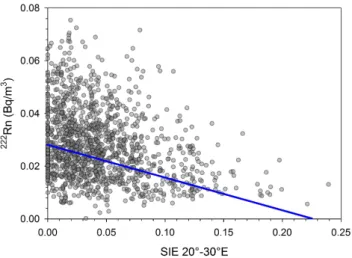
concentrations generally revealed an only weak correlation. Regarding summer, the correlation between both parameters, calculated by a bivariate regression considering the uncer-tainties of both variables (Cantrell, 2008), was actually high-est for the SIE sector 20◦E to 30◦E whereby about 8.1 % (p <10−20) of the 222Rn variability could be explained by
SIE variability (Fig. 11). For winter, we did not detect any significant correlation. Finally, we found an only minor im-pact of nearby oceanic222Rn emissions (and consequentially
local SIE variability): During summer, we measured defi-nitely lower 222Rn activity concentrations under northerly
Fig. 11. Correlation between 222Rn activity and SIE (unit:
106km2) between 20◦E and 30◦E for summer (JFM) based on respecting daily mean values. Regression (blue line) cal-culated by the Williamson–York method (Cantrell, 2008) with slope =−(0.124±0.028)×10−6Bq m−3km−2, inter-cept = (0.028±0.001) Bq m−3.
wind direction between 300◦and 60◦,N=293 cases, com-pared to 0.0286 Bq m−3 for remaining wind directions
be-tween 60◦and 300◦,N=9460,p <10−7). Hence a
signif-icant influence of SIE modulated oceanic222Rn emissions appeared arguable.
Nevertheless, considering and balancing all findings pre-sented above, we tentatively suggest the regional SIE vari-ability as a significant driver of the observed222Rn
season-ality. The moderate correlation between both parameters ap-pears not so surprising, keeping in mind that oceanic222Rn
emission strength is (apart from SIE) highly dependent on surface wind velocity (Schery and Huang, 2004; Taguchi et al., 2013). Source strength and also transport efficiency asso-ciated with air mass history determined222Rn activity
con-centrations eventually measured at NM. The impact of these different processes may have blurred an inherently more pro-nounced correlation with SIE data. Most probably the main oceanic source regions were some 1000 km away from NM, as supported by trajectory analyses which indicate as well a main transport route via the Antarctic continent (Fig. 7a). In addition, the long transport routes indicated in Fig. 7a im-ply high wind velocities and efficient sea–air exchange pro-cesses. The exceptionally low222Rn activity concentrations
measured under advection from open water ahead of NM may be a consequence of the generally very low wind ve-locities (4±3 m s−1) and hence minimized sea–air exchange under these conditions.
5 Conclusions
222Rn activity levels measured at NM were in principle
consistent with those observed at Cape Grim provided that the latter site was governed by advection of clean ma-rine air masses. Following the arguments of Zahorowski et al. (2013), in such air masses 222Rn levels should be
de-termined by marine emissions. This finding motivated the attractive hypothesis that also222Rn activity concentrations
at NM and in particular their distinct seasonality may be largely caused by marine emissions and inherently linked with the annual cycle of SIE. In addition, sporadic radon storms should have been caused by long-range transport of continental air masses from South America. Actually, based on our present evaluation, a more complicated and somewhat ambiguous general view emerged. Although we could not properly assess the contribution of oceanic222Rn emissions
to the observed222Rn activity concentrations at NM, we can
state that the marine 222Rn source and the impact of SIE
should be of significant importance in particular concern-ing the distinct seasonal maximum in February coincidconcern-ing with the regional SIE minimum. Regarding trajectory anal-yses and local meteorology, there was a distinct difference during summer in air mass characteristics between high and low222Rn activity concentrations: high222Rn activity
con-centrations were generally associated with long-range trans-port, while advection during low 222Rn activity concentra-tions was more regionally confined (less than 1000 km am-bit). Long-range transport is typically associated with high wind velocities promoting sea–air exchange processes. Fur-thermore, air masses with high222Rn activity concentrations
seem to arrive at NM preferentially via the Antarctic plateau, probably after down-mixing of free tropospheric air masses. At first sight, these latter findings seem also to be consis-tent with the previously raised assumption that 222Rn
ac-tivity at coastal NM should be governed by long-range air mass transport from South America and modulated by the efficiency of downward mixing into the PBL over Antarctica (Polian et al., 1986). Nevertheless, in our case the distinct seasonality of222Rn levels (and especially the divergent
an-nual cycle of210Pb concentrations) could not satisfactorily
be explained with it. Lastly, we found that high222Rn activ-ity concentrations were usually not associated with cyclonic activities and, on the whole, the impact of immediate long-range transport from the South American continent emerged as marginal. Consequently, at least for NM but most probably also for other Antarctic sites, the usage of222Rn activity
con-centrations to assess air mass history remains ambiguous. To clarify this crucial point, there is a need for extensive mea-surements of vertical222Rn profiles above Antarctica and the
significantly improve our knowledge about processes gov-erning the spatial and temporal variability of the Antarctic
222Rn inventory.
Acknowledgements. The authors would like to thank the many technicians and scientists of the Neumayer overwintering crews, whose outstanding commitment has enabled the achievement of continuous, high quality aerosol and trace gas records since 1982. Special thanks go to Holger Schmithüsen and Gert König-Langlo for their effort in compiling meteorological data for our purpose. We are thankful to NOAA Air Resources Laboratory for having made available the HYSPLIT trajectory calculation program as well as all input data files used. We also acknowledge partial funding of the initial phase of the air chemical NM Observatory programme by the German Science Foundation (DFG) as well as financial support obtained within the European Community STEP programme within the project Polar Atmospheric Chemistry.
Edited by: M. Heimann
References
Anderson, P. S. and Neff, W. D.: Boundary layer physics over snow and ice, Atmos. Chem. Phys., 8, 3563–3582, doi:10.5194/acp-8-3563-2008, 2008.
Cantrell, C. A.: Technical Note: Review of methods for linear least-squares fitting of data and application to atmospheric chemistry problems, Atmos. Chem. Phys., 8, 5477–5487, doi:10.5194/acp-8-5477-2008, 2008.
Caughey, S. J., Wyngaard, J. C., and Kaimal, J. C.: Turbulence in the Evolving Stable Boundary Layer, J. Atmos. Sci., 6, 1041–1052, 1979.
Elsässer, C., Wagenbach, D, Weller, R., Auer, M., Wallner, A., and Christl, M.: Continuous 25-years aerosol records at coastal Antarctica: Part 2: variability of the radionuclides7Be,
10Be and 210Pb, Tellus, 63B, 920–934,
doi:10.1111/j.1600-0889.2011.00543.x, 2011.
Fernando, H. J. S. and Weil, J. C.: Whither the Stable Boundary Layer? A Shift in the Research Agenda, B. Am. Meteor. Soc., 91, 1475–1484, doi:10.1175/2010BAMS2770.1, 2010.
Handorf, D.: Zur Parametrisierung der stabilen atmosphärischen Grenzschicht über einem antarktischen Schelfeis, in Reports on Polar and Marine Research, 204, edited by: Riemann, F., Alfred-Wegener-Inst. for Polar and Marine Res., Bremerhaven, 1996. Harris, J. M., Draxler, R. R., and Oltmans, S. J.:
Trajec-tory model sensitivity to differences in input data and ver-tical transport method, J. Geophys. Res., 110, D14109, doi:10.1029/2004JD005750, 2005.
Harrison, R. G. and Carslaw, K. S.: Ion-aerosol-cloud pro-cesses in the lower atmosphere, Rev. Geophys., 41, 1012, doi:10.1029/2002RG000114, 2003.
Heimann, M., Monfray, P., and Polian, G.: Modeling the long-range transport of 222Rn to subantarctic and Antarctic areas, Tellus, 42B, 83–99, 1990.
Hirsch, R. M., Slack, J. R., and Smith, R. A.: Techniques of trend analysis for monthly water quality data, Water Resour. Res. 18, 107–121, 1982.
Hirsikko, A., Nieminen, T., Gagné, S., Lehtipalo, K., Manninen, H. E., Ehn, M., Hõrrak, U., Kerminen, V.-M., Laakso, L., McMurry, P. H., Mirme, A., Mirme, S., Petäjä, T., Tammet, H., Vakkari, V., Vana, M., and Kulmala, M.: Atmospheric ions and nucle-ation: a review of observations, Atmos. Chem. Phys., 11, 767– 798, doi:10.5194/acp-11-767-2011, 2011.
Ili´c, R., Rusov, V. D., Pavlovych, V. N., Vaschenko, V. M., Hanžiˇc, L., Bondarchuk, Y. A.: Radon in Antarctica, Radiat. Meas., 40, 415–422, 2005.
Jacob, D. J., Prather, M. J., Rasch, P. J., Shia, R.-L., Balkanski, Y. J., Beagley, S. R., Bergmann, D. J., Blackshear, W. T., Brown, M., Chiba, M., Chipperfield, M. P., de Grandpré, J., Dignon, J. E., Feichter, J., Genthon, C., Grose, W. L., Kasibhatla, P. S., Köhler, I., Kritz, M. A., Law, K., Penner, J. E., Ramonet, M., Reeves, C. E., Rotman, D. A., Stockwell, D. Z., Van Velthoven, P. F. J., Verver, G., Wild, O., Yang, H., and Zimmermann, P.: Evaluation and intercomparison of global atmospheric transport models us-ing222Rn and other short-lived tracers, J. Geophys. Res., 102, 5953–5970, doi:10.1029/96JD02955, 1997.
Jones, A. E., Anderson, P. S., Wolff, E. W., Roscoe, H. K., Mar-shall, G. J., Richter, A., Brough, N., and Colwell, S. R.: Verti-cal structure of Antarctic tropospheric ozone depletion events: characteristics and broader implications, Atmos. Chem. Phys., 10, 7775-7794, doi:10.5194/acp-10-7775-2010, 2010.
Karstens, U., Schmithüsen, D., Schwingshackl, C., and Levin, I.: A process-based 222Radon flux map for Europe and its verifica-tion by long-term observaverifica-tions, to be submitted to Atmos. Chem. Phys. Discuss., 2014.
König-Langlo, G., King, J. C., and Pettré, P.: Climatology of the three coastal Antarctic stations Dumont d’Urville, Neumayer and Halley, J. Geophys. Res., 103, 10935–10946, 1998.
Lambert, G., Ardouin, B., and Sanak, J.: Atmospheric transport of trace elements toward Antarctica, Tellus, 42B, 76–82, 1990. Law, R. M., Steele, L. P., Krummel, P. B., and Zahorowski, W.:
Synoptic variation in atmospheric CO2at Cape Grim: a model
intercomparison, Tellus, 62B, 810–820, doi:10.1111/j.1600-0889.2010.00470.x, 2010
Levin, I., Born, M., Cuntz, M., Langendörfer, U., Mantsch, S., Nae-gler, T., Schmidt, M., Varlagin, A., Verclas, S., and Wagenbach, D.: Observations of atmospheric variability and soil exhalation rate of radon-222 at a Russian forest site, Tellus, 54B, 462–475, 2002.
Liu, S. C., McAfee, J. R., and Cicerone, R. J.: Radon 222 and tro-pospheric Vertical Transport, J. Geophys. Res., 89, 7291–7297, 1984.
Maenhaut, W., Zoller, W. H., and Coles, D. G.: Radionuclides in the South Pole Atmosphere, J. Geophys. Res., 84, 3131–3138, 1979. Mauritsen, T. and Svensson, G.: Observations of stably stratified shear-driven atmospheric turbulence at low and high Richardson numbers, J. Atmos. Sci., 64, 645–655, 2007.
Nazaroff, W. W.: Radon Transport From Soil to Air, Rev. Geophys., 30, 137–160, 1992.
Pereira, E. B.: Radon-222 time series measurements in the Antarctic peninsula (1986–1987), Tellus, 42B, 39–45, 1990.
Porstendörfer, J.: Properties and behaviour of Radon and Thoron and their decay products in the air, J. Aerosol Sci., 25, 219–263, 1994.
Schery, S. D. and Huang, S.: An estimate of the global distribu-tion of radon emissions from the ocean, Geophys. Res. Lett., 31, L19104, doi:10.1029/2004GL021051, 2004.
Slemr, F., Brunke, E.-G., Whittlestone, S., Zahorowski, W., Ebing-haus, R., Kock, H.H., and Labuschagne, C.:222Rn-calibrated mercury fluxes from terrestrial surface of southern Africa, At-mos. Chem. Phys., 13, 6421–6428, doi:10.5194/acp-13-6421-2013, 2013.
Stohl, A.: Computation, accuracy and applications of trajectoriesa review and bibliography, Atmos. Environ., 32, 947–966, 1998. Stull, R. B.: An Introduction to Boundary Layer Meteorology,
Kluwer Academic Publishers, Dordrecht, Dordrecht, 175–180, 1988.
Taguchi, S., Tasaka, S., Matsubara, M., Osada, K., Yokoi, T., and Yamanouchi, T.: Air-sea gas transfer rate for the Southern Ocean inferred from222Rn concentrations in maritime air and a global atmospheric transport model, J. Geophys. Res. Atmos., 118, 7606–7616, doi:10.1002/jgrd.50594, 2013.
Wagenbach, D., Görlach, U., Moser, K., and Münnich, K. O.: Coastal Antarctic aerosol: the seasonal pattern of its chemical composition and radionuclide content, Tellus, 40B, 423–436, 1988.
Weller, R., Wöltjen, J., Piel, C., Resenberg, R., Wagenbach, D., König-Langlo, G., and Kriews, M.: Seasonal variability of crustal and marine trace elements in the aerosol at Neumayer station, Antarctica, Tellus, 60B, 742–752, doi:10.1111/j.1600-0889.2008.00372.x, 2008.
Weller, R., Minikin, A., Wagenbach, D., and Dreiling, V.: Char-acterization of the inter-annual, seasonal, and diurnal variations of condensation particle concentrations at Neumayer, Antarc-tica, Atmos. Chem. Phys., 11, 13243-13257, doi:10.5194/acp-11-13243-2011, 2011a.
Weller, R., Wagenbach, D, Legrand, M., Elsässer, C., Tian-Kunze, X., and König-Langlo, G.: Continuous 25-years aerosol records at coastal Antarctica – 1: inter-annual variability of ionic com-pounds and links to climate indices, Tellus, 63B, 901–919, doi:10.1111/j.1600-0889.2011.00542.x, 2011b.
Wilkening, M. H. and Clements, W. E.: Radon 222 from the Ocean Surface, J. Geophys. Res., 80, 3828–3830, 1975.
Wyputta, U.: On the transport of trace elements into Antarctica us-ing measurements at the Georg-von-Neumayer station, Tellus, 49B, 93–111, 1997.
Zahorowski, W., Griffiths, A. D., Chambers, S. D., Williams, A. G., Law, R. M., Crawford, J., and Werczynski, S.: Constraining annual and seasonal radon-222 flux density from the Southern Ocean using radon-222 concentrations in the boundary layer at Cape Grim, Tellus, 65B, 19622, doi:10.3402/tellusb.v65i0.19622, 2013.