Characterization of VOC Emission from
Materials in Vehicular Environment at Varied
Temperatures: Correlation Development and
Validation
Jianyin Xiong1,2, Tao Yang1, Jianwei Tan1*, Lan Li1, Yunshan Ge1
1School of Mechanical Engineering, Beijing Institute of Technology, Beijing, China,2State Key Laboratory of Subtropical Building Science, South China University of Technology, Guangzhou, China
Abstract
The steady state VOC concentration in automobile cabin is taken as a good indicator to characterize the material emission behaviors and evaluate the vehicular air quality. Most studies in this field focus on experimental investigation while theoretical analysis is lacking. In this paper we firstly develop a simplified physical model to describe the VOC emission from automobile materials, and then derive a theoretical correlation between the steady state cabin VOC concentration (Ca) and temperature (T), which indicates that the logarithm ofCa/T0.75is in a linear relationship with 1/T. Experiments of chemical emissions in three car cabins at different temperatures (24°C, 29°C, 35°C) were conducted. Eight VOCs speci-fied in the Chinese National Standard GB/T 27630–2011 were taken for analysis. The good
agreement between the correlation and experimental results from our tests, as well as the data taken from literature demonstrates the effectiveness of the derived correlation. Further study indicates that the slope and intercept of the correlation follows linear association. With the derived correlation, the steady state cabin VOC concentration different from the test conditions can be conveniently obtained. This study should be helpful for analyzing temper-ature-dependent emission phenomena in automobiles and predicting associated health risks.
Introduction
The emission of volatile organic compounds (VOCs) from automobile cabin materials is one of the main causes of poor vehicular air quality [1]. The existence of VOCs can lead to sick car syndrome (SCS) particularly in new cars [2]. In addition, formaldehyde is regarded as a human carcinogen, and benzene may have a carcinogenic effect on the human body, and are thus of particular concern [3–6]. Since people spend long periods of time in automobile cabins for business, shopping, recreation or travel purposes [7], a study of the emission characteristics of
OPEN ACCESS
Citation:Xiong J, Yang T, Tan J, Li L, Ge Y (2015) Characterization of VOC Emission from Materials in Vehicular Environment at Varied Temperatures: Correlation Development and Validation. PLoS ONE 10(10): e0140081. doi:10.1371/journal.pone.0140081
Editor:Ying Xu, University of Texas Health Science Center at Austin, UNITED STATES
Received:July 27, 2015
Accepted:September 21, 2015
Published:October 9, 2015
Copyright:© 2015 Xiong et al. This is an open access article distributed under the terms of the
Creative Commons Attribution License, which permits unrestricted use, distribution, and reproduction in any medium, provided the original author and source are credited.
Data Availability Statement:All relevant data are within the paper and its Supporting Information files.
Funding:This research was supported by the National Natural Science Foundation of China (No. 51476013, No. 51106011, [http://www.nsfc.gov.cn]) and the Opening Funds of State Key Laboratory of Subtropical Building Science (No. 2015ZB18, [http:// www.sklsbs.com]). The funders had no role in study design, data collection and analysis, decision to publish, or preparation of the manuscript.
VOCs in the vehicular environment is urgently needed, so as to realize effective source control and reduce adverse health risks for the driver and passengers.
Previous studies on these VOC emission characteristics have mainly focused on material emission behaviors in the built environment. In addition, several studies have been performed to measure the pollution level of VOCs in aircraft cabins recently [8,9]. However, studies tar-geting material emission in vehicular environment have seldom been reported. VOC emissions from building materials can be characterized by three key parameters: the initial emittable con-centration (Cm,0); the material/air partition coefficient (K); and the diffusion coefficient inside the material (Dm) [10–21]. If these three parameters are determined, the VOC concentration or emission rate over time in an environmental chamber or indoor environment can be pre-dicted. These key parameters are not only dependent on the physical and chemical properties of the material-VOC combinations, but are also dependent on environmental conditions such as temperature and relative humidity [22,23]. Huang et al. [24] derived a theoretical correla-tion betweenCm,0and temperature (T) for formaldehyde emission from medium density fiber-board. This correlation shows that the logarithm ofCm,0T0.5is linearly related to the reciprocal of temperature. In addition, Zhang et al. [25] and Deng et al. [26] established theoretical associ-ations betweenKandT, andDmandT, respectively, showing thatKdecreases with increasing
and temperature. In addition, the ventilation rate in the automobile cabin changes markedly when a car is moving, which will obviously affect the steady state cabin VOC concentration. Taking this factor into consideration during the theoretical analysis is a challenging problem.
Given the above, the main objective of this paper is to derive a theoretical correlation between the steady state concentration and temperature for VOC emission from materials in vehicular environment. Data from experiments performed on three cars at different tempera-tures as well as data from literature are used to validate the derived correlation.
Development of the correlation
For VOC emission from board materials in chamber or real environment, the following assumptions are generally applied to simplify the analysis of the problem, i.e.: (1) the board material is single-layer and homogeneous; (2) the VOC diffusion process inside the board material is one-dimensional; (3) the VOC in the chamber or environment is well mixed. The analysis of assumptions (1) and (2) is included in the“Results and discussion”section. With these assumptions, the VOC concentration in the chamber or environment can be described by [14]:
Ca¼2C m;0
X1
n¼1
bqnsinqn
Gn expð Dmd
2
q2
ntÞ ð1Þ
where,Cais the concentration of VOC in the chamber or environment,μg/m3;Cm,0is the ini-tial emittable concentration of VOC in the material,μg/m3;Gn¼ ½Kbþ ða q2
nÞKBi
1
mþ 2q2
ncosqnþ ½Kbþ ða 3q
2
nÞKBi
1
m þa q
2
nqnsinqn,β=Aδ/V;α=Qδ
2
/DmV;Bim=hmδ/
Dm;Dmis the diffusion coefficient of VOC in the material, m2/s;δis the thickness of the mate-rial, m;Ais the emission area of the material, m2;hmis the convective mass transfer coefficient, m/s;Kis the material/air partition coefficient;qnare the positive roots of
qntanqn¼ a q
2
n
Kbþ ða q2
nÞKBi
1
m
ðn¼1;2;. . .Þ ð2Þ
Eq 1is derived based on VOC emission from board materials in buildings. Although the types of materials used in buildings and automobiles are different, there are still some similari-ties between them in the emission behaviors. In both cases there are three emission processes: the diffusion process within the material, the partition process at the material/air interface, and the convective mass transfer process along the material surface. We therefore make a rational assumption thatEq 1is also applicable to characterize the emission scenarios of VOC from materials in vehicular environment. This assumption will be validated in the following section by comparing the derived correlation (based onEq 1) with experimental data.
Eq 1is applicable for predicting both the short-term and long-term emission behaviors. The calculation ofCawithEq 1needs to find the roots of transcendentalEq 2and perform sums on infinite exponential terms, which is relatively complicated for engineering applications. For materials used in vehicular or built environment, the emission period may last for several years, which is much longer than the time to reach steady state (see the analysis in the“ Experi-mental section”). So, the VOC emission is mainly in the long-term emission period, or reaches steady state. For this emission period,Eq 1can be simplified.
term (n= 1). This means:
Ca¼2C m;0 b
q1sinq1
G1
expð Dmd 2
q2
1tÞ ð3Þ
For most material emission scenarios in vehicular and built environments,Bim/Kis in the range of 20–700 [34],αis in the range of 60–36200 [33,35], andα/Kβis in the range of 7–2900 (ACH changes in the range of 0.5-2/h) [10,32,36]. For VOC emission from board materials under ventilated conditions, the first rootq1ofEq 2is in the range of 0-π/2. By applying the
above parameter ranges to perform dimensional analysis onEq 2, we get:
a q2
1 a;a>> KbþaKBi 1
m ð4Þ
Eq 4indicates that the denominator is far more than the numerator in the right hand ofEq 2for the first root. Therefore, the first rootq1can be approximately taken asπ/2. With this
root, and considering thatαis much larger thanKβandq1,G1is approximately equal to
αq1sinq1. Substitute this intoEq 3, it yields:
Ca¼2C m;0
b
a expð Dmd 2
q2
1tÞ ¼2Cm;0Dm A
dQexpð Dmd
2
q2
1tÞ ð5Þ
This equation can be also rewritten as in the form ofFom:
Ca¼2C m;0Dm
A
dQexpð 2:46FomÞ ð6Þ
Eq 6is similar to the result derived based on Little et al.’s model [37]. This equation implies that the steady state or long-term VOC concentration in vehicular environment is in an expo-nential decay relationship with the emission time, which conforms with some empirical models [38]. In addition,Eq 6indicates that the long-term VOC concentration is just related with the internal material properties (area, thickness, key parameters) and the external ventilation con-ditions, which is consistent with previous studies based on dimensionless analysis [33,39]. In these two studies, the long-term emission rate is irrelevant with the chamber volume, which corresponds to that the long-term concentration is also irrelevant with the chamber volume. By extending it to vehicular environment, the long-term concentration should be independent on the vehicle volume, asEq 6revealed. Compared with the complicated fully-analytical model (Eq 1), the simplified model (Eq 6) is more convenient for calculation and analysis, thus will be helpful for screening level of steady state or long-term emissions. It should be pointed out that a similar form ofEq 6can be derived from another angle, which can be regarded as a validation ofEq 6, and is introduced inS1 Textof the Supporting Information.
Eq 6is derived from physical model, while S1 equation (S4) in the Supporting Information is obtained from semi-empirical correlations. We can see that these two equations are very sim-ilar, just a minor difference in the constant. The relative deviation between these two equations in predicting the steady state VOC concentration is about 5%, which is acceptable for engineer-ing applications. The consistency in these two equations validates the effectiveness of the sim-plification process fromEq 1toEq 6.
respectively. These correlations are described by Eqs7and8:
Cm;0¼
C1
T0:5expð
C2
TÞ ð7Þ
Dm¼D1T 5=4
expð D2
TÞ ð8Þ
where,C1,C2,D1,D2are positive constants, which are independent of temperature and are only related to the physical and chemical properties of the material-VOC combinations.
Substitute these two correlations intoEq 6, we get:
Ca¼E1
QT
0:75
expð E2
TÞexpð 2:46FomÞ ð9Þ
where,E1= 2C1D1A/δ,E2=C2+D2.
By taking the logarithm on both sides ofEq 9, it gives:
ln Ca T0:75¼ln
E1
Q E2
T 2:46Fom ð10Þ
The parameterE2is in the 104orders of magnitude [24,26], so the value ofE2/Tis about 30 for a normal car cabin temperature range. Given thatFomis larger than approximately 0.2 when the emissions reach steady state [33], the term (-2.46Fom) is relatively small compared with other terms inEq 10, and can thus be ignored. In some cases ignoring this term can lead to a small deviation that can be reduced by adjusting the parametersE1andE2within a narrow fluctuating range. Based upon the above analysis,Eq 10can be further reduced to:
ln Ca
T0:75¼lnE1
E2
T lnQ ð11Þ
Eq 11indicates that both the temperature and ventilation rate can influence the steady state cabin VOC concentration. In some emission scenarios, these two factors do not change simul-taneously. If only the temperature changes while the ventilation rate remains constant,Eq 11
can be written as:
ln Ca T0:75¼F1
F2
T ð12Þ
where,F1= lnE1-lnQ,F2=E2.
This correlation establishes the theoretical association between the steady state cabin VOC concentration and temperature, which indicates that the logarithm ofCa/T0.75is in a linear relationship with the reciprocal ofT. It is easy to demonstrate thatCais an increasing function ofT. Although the cabin VOC concentration at steady sate changes very slowly with emission time, it will still cause considerable change inCawhen the emission time differs greatly (e.g., one month or above). Therefore, when using correlation (12) to analyze or calculateCaat dif-ferent temperatures, the emission time corresponding toCa(at different temperatures) shouldn’t differ substantially.
1.5×10⁸−7.2×10⁹, andC2lies within 6330 ± 552. In addition, for formaldehyde emission from four board materials (PB, VF, MDF, HDF), Deng et al.’s [26] results indicate thatD1inEq 8is in the range of 1×10⁻¹⁰
–6×10⁻³, andD
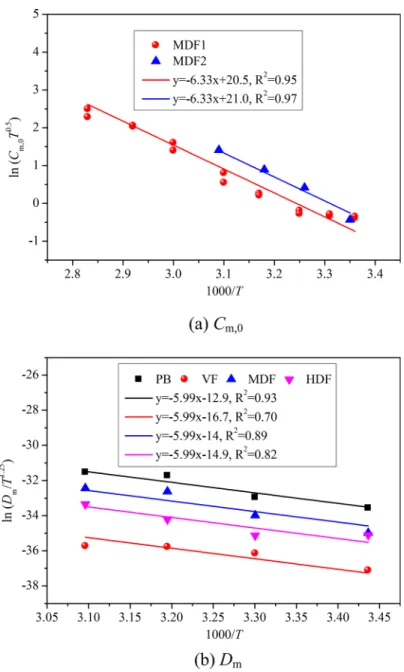
2lies within 5990 ± 1283. This means the parametersC1 andD1change greatly for VOC emission from different sources, whileC2andD2just change in a relatively narrow range. Based on these findings, we can force theC2andD2for different emission sources as the same (mean value) and re-treat the experimental data, to check whether we can takeC2andD2as unchanged.Fig 1shows the linear curving fitting results by re-treating the experimental data with theoretical correlations (the logarithm forms of Eqs7
and8). The horizontal axis is changed to 1000/Tto make the figure clearer. This figure indi-cates that the logarithm ofCm,0T0.5andDm/T1.25are in a good relationship with 1/T(or 1000/
T) when we keep the slopes as constants (C2= 6330,D2= 5990), with most of R2higher than 0.81. Therefore, to perform a preliminary analysis on VOC emission from different sources at various temperatures, we can roughly assume that for a certain VOC emitted from multi-sources, the parametersC2andD2in Eqs7and8approximately keep constant, and justC1 andD1vary for different sources. Such treatment is acceptable according to the above analysis, but we acknowledge that future research is needed to further check the feasibility of the assumption.
Under this condition,Eq 9can be transformed as:
Ca;i ¼
E1;i
Q T
0:75
expð E2
TÞexpð 2:46FomÞ ð13Þ
where,Ca,iis the steady state cabin VOC concentration due to the emission of sourcei;E1,i= 2C1,iD1,iAi/δi,E2=C2+D2.
It is assumed that the VOC emission from different sources doesn’t interfere with each other. That is to say, the total steady state VOC concentration can be regarded as the accumula-tion of every source (This will be preliminarily validated in the“Results and discussion” sec-tion). By summing on both sides ofEq 13, we get:
X
i
Ca;i ¼ X
i
E1;i
Q T
0:75
expð E2
TÞexpð 2:46FomÞ ð14Þ
This equation can be rewritten as:
Ca;tot¼E1;tot Q T
0:75
expð E2
TÞexpð 2:46FomÞ ð15Þ
where,Ca,totis the total steady state VOC concentration (=
X
i
Ca;i);E1;tot¼ X
i
E1;i.
By performing similar treatment mentioned above, the following correlation can be obtained:
lnCa;tot
T0:75¼H1
H2
T ð16Þ
where,H1= lnE1,tot-lnQ,H2=E2.
Experimental section
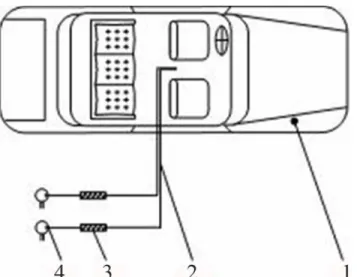
Experimental study in three vehicles was conducted to validate the derived correlation on multi-source emissions. The three tested cars were mainstream, mid-range cars (price in the mid-range) manufactured at the same factory. The time since production was less than one month. The experimental system is schematically shown inFig 2.Fig 3is a photo from the field tests.
During the experiment, the three tested cars were kept under static conditions, and the win-dows and doors were closed [40], which is recommended by the Chinese National Standard GB/T 27630–2011 [41]. As pointed out previously, the steady state can be regarded as reached when theFom(dimensionless emission time) is larger than approximately 0.2. It means that the real emission time should be over 0.2δ2/Dm. The materials used in vehicle cabins are
Fig 1. Linear curve fitting results by treating the experimental data with theoretical correlations.
generally very thin (e.g., the dashboard, the floor leather), and the thickness can be taken as 0.002m. At present, no study has been performed to measure theDmof materials in vehicular environment. As a preliminary estimation, theDmof materials in indoor environment is taken for analysis. The median value ofDmin Xiong et al.’s [32] study is chosen as 3.38 × 10⁻¹⁰m2/s. Under this condition, the emission time to reach steady state is calculated to be greater than 0.66h. During the experiment, the three tested cars are maintained under static conditions for 2h, which can ensure the arriving of steady state. In addition, the South Korea Standard [42] also specifies that the tested vehicles should be kept for 2h before sampling the vehicle cabin VOC concentration, which is consistent with the present experimental procedure. The experi-ments were conducted outdoors. To reduce the impact of outdoor air pollution on the car cabin VOC concentration, a day with good air quality (air quality index, AQI<50) in summer was selected to perform the experiment. To study the impact of temperature on the cabin VOC concentration, the cars were tested at three different temperatures, i.e., 24°C, 29°C, 35°C, which corresponded to typical outdoor summer temperatures for the morning, evening, and noon. The cars were tested in the shadow, and the temperature in the cars was the same as the out-door temperature. At each temperature, the three cars were tested simultaneously. Since there was no wind during the outdoor environment, the temperature fluctuation was maintained within ±0.5°C during the samplings. The multi-sources that could emit VOC inside the car cabin included plastic, leather, fabric, et al.
Fig 2. Schematic diagram of the experimental system.(1) tested car; (2) sampling catheter; (3) Tenax-TA tube; (4) sampling pump.
doi:10.1371/journal.pone.0140081.g002
Fig 3. Photo of the experimental system.
In the experiment, eight chemicals specified in the Chinese National Standard GB/T 27630– 2011 [41], i.e., benzene, toluene, ethylbenzene, xylene, styrene, formaldehyde, acetaldehyde, acraldehyde, were selected as the target pollutants. The sampling point for the pollutants was set at the intersection of the front seat headrest with the car central axis, and the height of the sampling point approximated to the passenger’s breathing zone (Fig 3). The sampling and analysis of VOCs in the car cabin was primarily based on the EPA (U.S. Environmental Protec-tion Agency) Standard TO-17 [43]. A Tenax-TA tube was used to collect the VOCs from the car cabin, and a secondary thermal desorption-gas chromatography/mass spectrometry (TD-GC/MS) method was applied for analysis. After sampling, the Tenax-TA tube was purged with dry inert gas and then heated. The desorbed VOCs subsequently went into the cold trap with the carrier gas. By performing this secondary thermal desorption, the VOCs finally entered the GC/MS for analysis. The quantitative analysis of VOCs was decided by using the "five-point external standard method". The standard mixed liquid was comprised of benzene, toluene, p-xylene, m-xylene, o-xylene, ethylbenzene, styrene, n-butyl acetate, and n-undecane. For the sampling and analysis of aldehydes and ketones, according to EPA Standard TO-11A [44], a DNPH (dinitrophenylhydrazone)-silica cartridge linked to a pump was used to sample the pollutants in the car cabin. The sampled cartridges were kept in a refrigerator until analysis. After sampling, the DNPH-carbonyl derivatives were extracted with acetonitrile and analyzed by using high performance liquid chromatography (HPLC). For the analysis process, the chro-matographic separation of the hydrazones was achieved by use of a C18-column and water/ acetonitrile solvent combinations, and an ultraviolet (UV) absorption detector was used for detection.
The sampling flow rate of the pollutants was kept at 100 ml/min, with a sampling time of 30 min. In order to ensure a constant flow, the pump was calibrated by a soap film flowmeter (SKC Inc., U.S.) before and after the sampling process. The flow deviation was less than 5% during the sampling process. Mean value of duplicate samplings were taken as the measured results, for the purpose of reducing the measurement error.
Results and Discussion
Validation of correlation (12) with data from literature
the feasibility of extending the application range ofEq 1from building material emissions to vehicular material emissions.
Cabin VOC concentrations in the three tested cars
The steady state cabin concentrations of eight VOCs in the three cars were measured during our field tests, and the results are summarized inTable 1. This table shows that the steady state concentrations of all the tested VOCs in the car cabins increase significantly with increasing temperature. The increase tendency is not simply linear, but is greater at high temperatures. As an example we can look at the benzene emission from interior materials in car 2. The cabin benzene concentration at 29°C is about 28.8% higher than that at 24°C (5°C temperature differ-ence). However, the 6°C temperature difference from 29°C to 35°C results in an increase of 102% in the cabin benzene concentration, which is obviously much higher than the increase seen at the lower temperatures.Table 1indicates that the three pollutants with relatively high
Fig 4. Validation of correlation (12) with Kim et al.’s [2] experimental data from chamber tests.
concentrations in the tested cars are xylene, formaldehyde and toluene. By comparing the mea-sured concentrations inTable 1with the upper limit concentration specified for each pollutant in the Chinese National Standard GB/T 27630–2011 [41], we can see that the cabin concentra-tions of all the VOCs are within the bounds of the standard, with the exception of formalde-hyde (100μg/m3) at high temperatures (29°C for car 1, 29°C and 35°C for cars 2 and 3). Since a temperature of 29°C or higher can easily be reached in vehicular environment in summer, the result for formaldehyde indicates that severe adverse health effects to passengers, especially children might emerge. Thus, effective measures should be taken to control and improve the vehicular air quality.
Validation of correlation (16) with data in the three tested cars
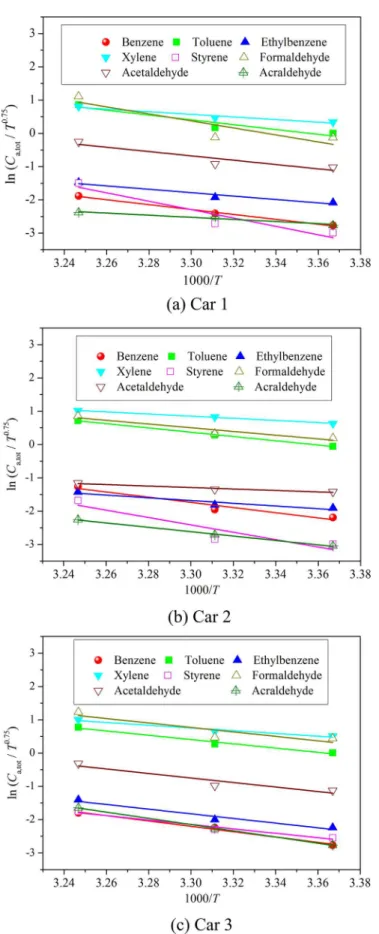
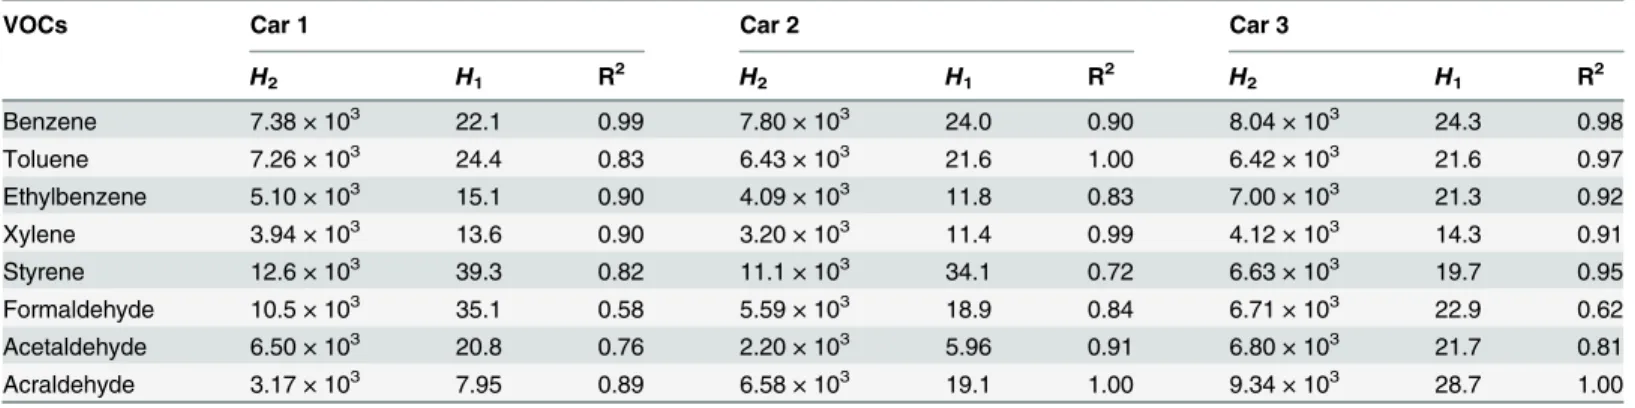
Correlation (16) is applicable when VOC is emitted from multi-sources in vehicular environ-ment. Since the tested three cars include many kinds of emission sources, the measured steady state cabin VOC concentrations at different temperatures can be used to validate the derived correlation.Fig 5shows the linear curve fitting results for the eight VOCs in the three cars by virtue of correlation (16). The detailed fitting information is summarized inTable 2.Fig 5as well asTable 2reveals that the logarithm ofCa,tot/T0.75is in a good linear relationship with 1/T, with R2for most of VOCs in the three cars being larger than 0.81, thus validating the effective-ness of the derived correlation.
When the ventilation rate keeps constant, the derived correlation (16) involves only two unknown parameters, i.e.,H1(or lnE1,tot-lnQ) andH2. Generally, two sets of experimental data relating VOC concentration and temperature are enough to determine these two parameters by solving two equations. If more sets of tests are performed, the two parameters can be obtained by linear curve fitting, which will increase the accuracy of the parameters. Once the two parameters are determined, the correlation can be used to evaluate the VOC concentration at temperatures other than those of the test conditions in vehicular environment, facilitating scientific research as well as engineering applications.
According to the fitting results inTable 2, for benzene emission from interior materials in car 2, the quantitative association between the steady state cabin concentration and tempera-ture can be expressed as:
lnCa;tot
T0:75¼24:0
7800
T ð17Þ
Based on this correlation, the cabin benzene concentration at 70°C can be predicted. The result of 281μg/m3is about 3 times of the benzene limit specified in the Chinese National
Table 1. The measured concentrations of eight VOCs in the three tested cars at different temperatures (unit:μg/m3).
VOCs Car 1 Car 2 Car 3
24°C 29°C 35°C 24°C 29°C 35°C 24°C 29°C 35°C
Benzene 4.5 6.5 11.2 8.0 10.3 20.8 4.5 7.7 12.2
Toluene 71.6 85.5 174.2 67.7 96.5 150.7 72.0 95.4 159.4
Ethylbenzene 8.9 10.6 16.8 10.6 11.8 17.7 7.6 9.8 18.0
Xylene 100.5 115.2 165.1 134.5 166.2 203.2 119.1 138.3 199.9
Styrene 3.6 4.8 16.5 3.6 4.2 13.7 5.6 7.3 12.7
Formaldehyde 62.8 64.0 222.9 86.6 100.6 172.8 111.1 115.7 251.6
Acetaldehyde 25.7 28.9 57.0 13.7 18.8 23.1 23.3 27.1 53.6
Acraldehyde 4.5 5.9 6.8 3.4 4.8 7.7 4.5 7.5 14.2
Fig 5. Validation of correlation (16) with experimental data from the three tested cars.
Standard GB/T 27630–2011 (110μg/m3). This means that the increase of cabin temperature will greatly increase the health risk and exposure level of driver and passengers in vehicular environment.
Validation of correlation (16) with data from literature
Experimental data in literature is further used to validate the reliability of correlation (16). Chen et al. [29] investigated the VOC concentrations in the cabins of 22 public buses in the temperature range of 25–36°C. The target pollutants included benzene, toluene, ethylbenzene and xylene. The mean value of the measured VOC concentrations inside the cabins of the 22 buses is taken to be the steady state concentration for each pollutant.Fig 6(A)shows the linear curve fitting results of treating the experimental data of cabin concentrations at various tem-peratures with the derived correlation (16). The figure reveals that, for the four VOCs, the loga-rithm ofCa,tot/T0.75correlates linearly well with 1/T, with the R2values being in the 0.86–0.99 range, thus demonstrating the effectiveness of the derived correlation. This figure further indi-cates that the slopes of the regression lines are very similar for the four VOCs, meaning that the increasing tendency and level are similar for these pollutants. In addition, Chen et al. [46] also measured the steady state TVOC concentrations in 38 taxi cabin environments from 22°C to 36°C.Fig 6(B)shows the regression results by virtue of the correlation (20). The good linear tendency between the logarithm ofCa,tot/T0.75and 1/Tillustrates the reliability of the proposed correlation. Validation of correlation (16) with experimental data in other literature (You et al. [28]) is represented inFig 7.
Relationship between
H
2and
H
1in correlation (16)
The two parametersH2(orF2) andH1(orF1) in correlation (16) (or correlation (12)) are asso-ciated with the physical and chemical properties of material-VOC combinations, such as the adsorption energy, the molar volume of compounds, the maximum adsorbate quantity, etc. These properties may correlate with each other, meaning thatH2may correlate withH1.Fig 8 shows the relationship betweenH2andH1determined in previous sections by treating the experimental data. This figure reveals that for all the emission scenarios of VOC from vehicular materials in the present study,H2is in a good linear relationship withH1, with the slope of 297 and intercept of 100. Generally,H2can be expressed as the ratio of adsorption energy to uni-versal gas constant. The quantitative correlation betweenH2andH1provides a pathway to esti-mate the adsorption energy with some available physical parameters (i.e., the molar volume,
Table 2. Linear curve fitting results using the derived correlation to treat the experimental data in the three tested cars.
VOCs Car 1 Car 2 Car 3
H2 H1 R2 H2 H1 R2 H2 H1 R2
Benzene 7.38 × 10³ 22.1 0.99 7.80 × 10³ 24.0 0.90 8.04 × 10³ 24.3 0.98
Toluene 7.26 × 10³ 24.4 0.83 6.43 × 10³ 21.6 1.00 6.42 × 10³ 21.6 0.97
Ethylbenzene 5.10 × 10³ 15.1 0.90 4.09 × 10³ 11.8 0.83 7.00 × 10³ 21.3 0.92
Xylene 3.94 × 10³ 13.6 0.90 3.20 × 10³ 11.4 0.99 4.12 × 10³ 14.3 0.91
Styrene 12.6 × 10³ 39.3 0.82 11.1 × 10³ 34.1 0.72 6.63 × 10³ 19.7 0.95
Formaldehyde 10.5 × 10³ 35.1 0.58 5.59 × 10³ 18.9 0.84 6.71 × 10³ 22.9 0.62
Acetaldehyde 6.50 × 10³ 20.8 0.76 2.20 × 10³ 5.96 0.91 6.80 × 10³ 21.7 0.81
Acraldehyde 3.17 × 10³ 7.95 0.89 6.58 × 10³ 19.1 1.00 9.34 × 10³ 28.7 1.00
the maximum adsorbate quantity). The physical mechanism behind this phenomenon is unknown, and future investigation is needed.
Analysis on the multi-source emissions
Previously, we made an assumption that the VOC emission from different sources doesn’t interfere with each other (or, the total steady state VOC concentration can be regarded as the accumulation of every source). To validate the rationality of such assumption, a preliminary analysis based on analytical model is performed here. To simplify the analysis of the problem, two source materials are chosen, and the parameters for simulation are set as:V= 30L; ACH = 1/h;A1= 0.1m×0.1m;δ1= 0.0018m;Cm1= 4×10⁷μg/m3;Dm1= 2×10⁻¹⁰m2/s;K1= 1×10³;hm1= 2.5×10⁻³m/s;A2= 0.1m×0.2m;δ2= 0.002m;Cm2= 1×10⁷μg/m3;Dm2= 1×10⁻¹⁰m2/s;K2= 2×10³;hm2= 2.5×10⁻³m/s (subscripts 1 and 2 stand for the parameters for materials 1 and 2, respectively). The key parametersCm,0,DmandKfor the two materials differ
Fig 6. Validation of correlation (16) with Chen et al.’s [29,46] experimental data from vehicular environments.
by 4 times, 2 times and 2 times, respectively. Xu and Zhang [13] developed an analytical model for VOC emission from single-source. This model can be improved to predict the VOC emis-sion from multi-sources by adding a series of emisemis-sion or sorption terms in the mass conserva-tion equaconserva-tion in the gas phase. For two-source emission, the mass conservaconserva-tion equaconserva-tion can be improved as:
VdCa
dt ¼A1E1þA2E2 QCa ð18Þ
where,E1andE2are the emission rates of VOC from materials 1 and 2, respectively.
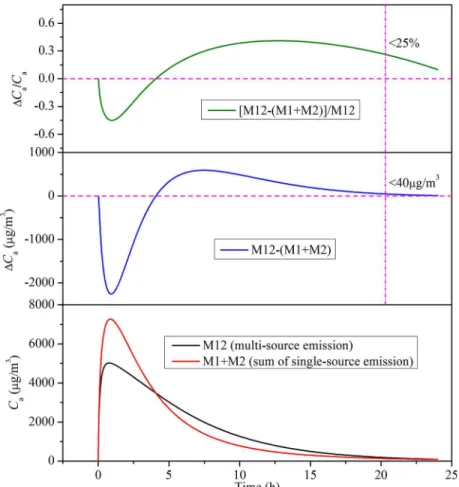
Based on the improved model, the chamber VOC concentrations from two-source emission and single-source emission can be predicted, and the results are shown inFig 9. In this figure, M1 stands for the emission when just material 1 is put inside the chamber; M2 stands for the emission when just material 2 is put inside the chamber; M12 stands for the emission when
Fig 7. Validation of correlation (16) with You et al.’s [28] experimental data from vehicular environments.
materials 1 and 2 are simultaneously put inside the chamber.Fig 9reveals that there are some differences in chamber VOC concentration between the two-source emission (M12) and the
Fig 8. Relationship betweenH2andH1.
doi:10.1371/journal.pone.0140081.g008
Fig 9. Comparison of chamber VOC concentration between two-source emission and single-source emission.
sum of single-source emission (M1+M2) during the initial and intermediate stage. Before a cer-tain emission time, the chamber VOC concentration of M12 is lower than that of M1+M2. After that time, the change tendency reverses, and the relative deviation between M12 and M1+M2 firstly increases and them decreases to a small value (e.g., 25%) with the increase of emission time. That is to say, for the short-term emissions, the two-source (or multi-source) emission cannot be regarded as the sum of single-source emission for the cases studied; but for the long-term emissions, the two-source (or multi-source) emission can be treated as equiva-lent to the sum of single-source emission. Such treatment simplifies the analysis of multi-source emission problems while still keeping acceptable accuracy. It should be noted that the present analysis just focuses on two typical materials, further systematic study on more mate-rial emission scenarios is still required, to quantitatively determine the equivalent condition (e.g., the range of emission time and key parameters) of multi-source emission.
Analysis on the multi-layer emissions
The derivation of correlation in the present study is based on the analytical model (Eq 1), which focuses on VOC emissions from single-layer materials. However, some materials used in vehicular environment may be multi-layer, e.g., the seat, thus should be further analyzed. Yao et al. [47] studied the equivalent problem of multi-layer material emissions into single-layer material emissions. A group of two-layer materials with varied key parameter ranges [Dm2/
Dm1(0.03),K2/K1(2,10)] were simulated. This range can cover the common emission scenarios.
The results indicate that when the outer layer is very thin, the two-layer material emissions have equivalent key parameters for most of the simulated parameter ranges. That is to say, The two-layer (or multi-layer) material emissions can be equivalent to single-layer material emis-sions, by predicting the emission characteristics with single-layer analytical model, together with the equivalent key parametersCm,0,KandDm. For seats used in vehicular environment, the outer layer is very thin; for other materials used in vehicular environment and accounting for large exposed areas, e.g., the dashboard, the floor leather, they are very thin and are single-layer materials. Given that, to simplify the analysis of the problem, we make a rational assump-tion of single-layer emissions. The assumpassump-tion of one-dimensional emission is based on the consideration that the thickness of most of the materials exposed to air in vehicular environ-ment is much thinner than the length and width of the materials.
Association between ventilation rate and steady state cabin
concentration
Besides temperature, ventilation rate (Q) is another important factor that will affect the steady state VOC concentration in real automobile cabin especially when the automobile is moving with varied velocity, thus further analysis is needed. When the ventilation rate of automobile changes, things become a little more complicated. It should be noted that an increase inQwill not only bring VOCs out of the automobile cabin more rapidly (ventilation dilution), but will also enhance the convective mass transfer coefficient along the material surface (ventilation-mediated convection), which will further influence the VOC concentration in the vehicular environment.Eq 11in“Development of the correlation”Section just considers the ventilation dilution effect. To take into account the additional ventilation-mediated convection effect, a coefficient (E3) is introduced, andEq 11is modified to be:
ln Ca
T0:75¼lnE1
E2
When the temperature remains constant, this equation can be rewritten as:
ln Ca
T0:75¼J1 J2lnQ ð20Þ
where,J1= lnE1-E2/T;J2=E3.
This correlation indicates that the logarithm ofCa/T0.75is in a linear relationship with the logarithm ofQ. It is easy to see thatCais a decreasing function ofQ. For VOC emission from multi-sources in vehicular environment, theCain correlation (20) should be replaced byCa,tot.
You et al. [28] tested the changes of steady state chemical concentrations in three vehicles in a room-size environmental chamber (volume: 96 m3) under various ventilation rates at the temperature of 25°C. The experimental data is used for validation. During the tests, the change in the steady state TVOC concentration in vehicle B was measured by changing the ventilation rate from 14.4 m3/h (0.15 ACH) to 64.3 m3/h (0.67 ACH).Fig 10shows the regression results based on the derived correlation (20) when keeping temperature constant. This figure indicates good linear association between the logarithm ofCa,tot/T0.75and the logarithm ofQ, thus veri-fying the effectiveness of correlation (20).
Generally speaking, the use of vehicle is usually accompanied by the change of vehicular environment, e.g., taking a car out from an underground parking lot, opening/closing the air conditioning system or windows when driving. These actions or changes will disturb the origi-nal steady state condition, which will cause the changes of the key parameters of VOC emission from vehicular materials, and thus will form a new emission scenario. As discussed previously, it will take the dimensionless emission time of 0.2 (Fom, or real emission time of 0.66h) to reach a new steady state. The VOC emissions in vehicular environment are often comprised of a series of different steady states, and the change of environmental conditions will change the emissions from one steady state to another steady state (after taking some time).
It should be noted that the emission characteristics of VOC from materials in real vehicular environment is relatively complicated. In addition to temperature and ventilation rate, the steady state cabin VOC concentration can be influenced by other factors, e.g., relative humid-ity, solar radiation, time of usage. These impact factors may simultaneously affect the emission characteristics, making the analysis based on physical mechanism complex. This manuscript
Fig 10. Validation of the correlation (20) with You et al.’s [28] experimental data from vehicular environments.
just considers the impact of temperature and ventilation rate by virtue of physical model, it is therefore can be just regarded as a preliminary study on the material emission characterization in vehicular environment. In addition, the derivation of correlation (16) for multi-source emis-sions introduces some assumptions, which needs more experimental validation and deep mechanistic analysis. Therefore, future study on this topic is still needed. Considering the exist-ing researches on vehicular environment are all based on experimental investigation, the obtained correlation in the present study provides a theoretical approach, which will be helpful for analyzing the emission phenomena in automobiles under varied environmental factors and predicting the associated health risks.
Conclusions
This study theoretically and experimentally investigates the impact of temperature on the emis-sion characteristics of VOCs from materials in vehicular environment. A simplified model describing the VOC emission from automobile interior materials at steady state is firstly derived, and then a theoretical correlation between the steady state cabin VOC concentration and temperature is established. The proposed correlation can be applicable for VOC emission from single-source and multi-sources. The effectiveness of the correlation is preliminarily vali-dated by virtue of tests in three car cabins at various temperatures for eight pollutants specified in the Chinese National Standard GB/T 27630–2011, and is further validated by data from the literature. Once the parameters in the derived correlation are determined by two or more sets of experimental data, the correlation can then be applied to predict VOC concentrations when conditions differ from the test scenarios, which is very helpful for engineering applications. In addition, the association between the steady state cabin VOC concentration and ventilation rate is established, which is validated by data in literature. The present study based on theoreti-cal analysis is more advantageous than traditional studies based solely on experimental investi-gation. Future study will consider the influence of relative humidity and other environmental factors on the emission characteristics of VOCs in the vehicular environment.
Supporting Information
S1 Text. Derivation ofEq 6from another angle.
(DOC)
Acknowledgments
This research was supported by the National Natural Science Foundation of China (No. 51476013, No. 51106011,http://www.nsfc.gov.cn) and the Opening Funds of State Key Labora-tory of Subtropical Building Science (No. 2015ZB18,http://www.sklsbs.com). The funders had no role in study design, data collection and analysis, decision to publish, or preparation of the manuscript.
Author Contributions
Conceived and designed the experiments: LL JT YG. Performed the experiments: LL JT. Ana-lyzed the data: JX TY JT. Contributed reagents/materials/analysis tools: JX TY. Wrote the paper: JX TY JT.
References
2. Kim K-W, Lee B-H, Kim S, Kim H-J, Yun J-H, Yoo S-E, et al. (2011) Reduction of VOC emission from natural flours filled biodegradable bio-composites for automobile interior. J Hazard Mat 187: 37–43. 3. Cogliano VJ, Grosse Y, Baan RA, Straif K, Secretan MB, Ghissassi FE (2005) Working Group for
Vol-ume 88. Meeting report: summary of IARC monographs on formaldehyde, 2-butoxyethanol, and 1-tert-butoxy-2-propanol. Environ Health Perspect 113: 1205–1208. PMID:16140628
4. Schupp T, Bolt HM, Jaeckh R, Hengstler JG (2006) Benzene and its methyl-derivatives: derivation of maximum exposure levels in automobiles. Toxicol Lett 160: 93–104. PMID:16122889
5. Choi H, Schmidbauer N, Sundell J, Hasselgren M, Spengler J, Bornehag C-G (2010) Common house-hold chemicals and the allergy risks in pre-school age children. PloS ONE 5(10): e13423. doi:10.1371/ journal.pone.0013423PMID:20976153
6. Dixon E, Clubb C, Pittman S, Ammann L, Rasheed Z, Kazmi N, et al. (2011) Solid-phase microextrac-tion and the human fecal VOC metabolome. PloS ONE 6(4): e18471. doi:10.1371/journal.pone. 0018471PMID:21494609
7. Yoshida T, Matsunaga I, Tomioka K, Kumagai S (2006) Interior air pollution in aubomotive cabins by volatile organic compounds diffusing from interior materials: II. Influence of manufacturer, specifications and usage status on air pollution, and estimation of air pollution levels in initial phases of delivery as a new car. Indoor Built Environ 15: 445–462.
8. Wang C, Yang XD, Guan J, Li Z, Gap K (2014) Source apportionment of volatile organic compounds (VOCs) in aircraft cabins. Build Environ 81: 1–6.
9. Wang C, Yang XD, Guan J, Gao K, Li Z (2014) Volatile organic compounds in aircraft cabin: Measure-ments and correlations between compounds. Build Environ 78: 89–94.
10. Little JC, Hodgson AT, Gadgil AJ (1994) Modeling emissions of volatile organic compounds from new carpets. Atmos Environ 28: 227–234.
11. Yang X, Chen Q, Zhang JS, Magee R, Zeng J, Shaw CY (2001) Numerical simulation of VOC emis-sions from dry materials. Build Environ 36: 1099–1107.
12. Huang HY, Haghighat F (2002) Modelling of volatile organic compounds emission from dry building materials. Build Environ 37: 1127–1138.
13. Xu Y, Zhang YP (2003) An improved mass transfer based model for analyzing VOC emissions from building materials. Atmos Environ 37: 2497–2505.
14. Deng BQ, Kim CN (2004) An analytical model for VOCs emission from dry building materials. Atmos Environ 38: 1173–1180.
15. Zhang LZ, Niu JL (2004) Modeling VOCs emissions in a room with a single-zone multi-component multi-layer technique. Build Environ 39: 523–531.
16. Hu HP, Zhang YP, Wang XK, Little JC (2007) An analytical mass transfer model for predicting VOC emissions from multi-layered building materials with convective surfaces on both sides. Int J Heat Mass Transf 50: 2069–2077.
17. Xu J, Zhang JS, Grunewald J, Zhao JH, Plagge R, Quali A, et al. (2009) A study on the similarities between water vapor and VOC diffusion in porous media by a dual chamber method. Clean-Soil Air Water 37: 444–453.
18. Xiong JY, Huang SD, Zhang YP (2012) A novel method for measuring the diffusion, partition and con-vective mass transfer coefficients of formaldehyde and VOC in building materials. PLoS One 7(11): e49342. doi:10.1371/journal.pone.0049342PMID:23145156
19. Wei WJ, Xiong JY, Zhang YP (2013) Influence of precision of emission characteristic parameters on model prediction error of VOCs/formaldehyde from dry building material. PLoS One 8(12): e80736. doi: 10.1371/journal.pone.0080736PMID:24312497
20. Salem MZM, Bohm M (2013) Understanding of formaldehyde emissions from solid wood: an overview. Bioresources 8: 4775–4790.
21. Crawford S, Lungu CT (2013) Application and limitations of a mass transfer VOC emission model for a dry building material. Atmos Environ 81: 25–31.
22. Lin CC, Yu KP, Zhao P, Lee GW-M (2009) Evaluation of impact factors on VOC emissions and concen-trations from wooden flooring based on chamber tests. Build Environ 44: 525–533.
23. Parthasarathy S, Maddalena RL, Russell ML, Apte MG (2011) Effect of temperature and humidity on formaldehyde emissions in temporary housing units. J Air Waste Manage Assoc 61: 689–695. 24. Huang SD, Xiong JY, Zhang YP (2015) Impact of temperature on the ratio of initial emittable
concentra-tion to total concentraconcentra-tion for formaldehyde in building materials: theoretical correlaconcentra-tion and validaconcentra-tion. Environ Sci Technol 49: 1537–1544. doi:10.1021/es5051875PMID:25563933
26. Deng QQ, Yang XD, Zhang JS (2009) Study on a new correlation between diffusion coefficient and temperature in porous building materials. Atmos Environ 43: 2080–2083.
27. Yoshida T, Matsunaga I (2006) A case study on identification of airborne organic compounds and time courses of their concentrations in the cabin of a new car for private use. Environ Int 32: 58–79. PMID: 15993490
28. You KW, Ge YS, Hu B, Ning ZW, Zhao ST, Zhang YN, et al. (2007) Measurement of in-vehicle volatile organic compounds under static conditions. J Environ Sci 19: 1208–1213.
29. Chen XK, Zhang GQ, Zhang Q, Chen H (2011) Mass concentrations of BTEX inside air environment of buses in Changsha, China. Build Environ 46: 421–427.
30. Hunt DRG, Gidman MI (1982) A National Field Survey of House Temperatures. Build Environ 17: 107– 124.
31. McLaren C, Null J, Quinn J (2005) Heat Stress From Enclosed Vehicles: Moderate Ambient Tempera-tures Cause Significant Temperature Rise in Enclosed Vehicles. Pediatrics 116: 109–112.
32. Xiong JY, Yao Y, Zhang YP (2011) C-history method: rapid measurement of the initial emittable con-centration, diffusion and partition coefficients for formaldehyde and VOCs in building materials. Environ Sci Technol 45: 3584–3590. doi:10.1021/es200277pPMID:21428433
33. Qian K, Zhang YP, Little JC, Wang XK (2007) Dimensionless correlations to predict VOC emissions from dry building materials. Atmos Environ 41: 352–359.
34. Zhang LZ, Niu JL (2003) Laminar fluid flow and mass transfer in a standard field and laboratory emis-sion cell (FLEC). Int J Heat Mass Transf 46: 91–100.
35. Xiong JY, Wei WJ, Huang SD, Zhang YP (2013) Association between the emission rate and tempera-ture for chemical pollutants in building materials: General correlation and understanding. Environ Sci Technol 47: 8540–8547. doi:10.1021/es401173dPMID:23789927
36. Bodalal A, Zhang JS, Plett EG (2000) A method for measuring internal diffusion and equilibrium parti-tion coefficients of volatile organic compounds for building materials. Build Environ 35: 101–110. 37. Li M (2013) Diffusion-controlled emissions of volatile organic compounds (VOCs): short-, mid-, and
long-term emission profiles. Int J Heat Mass Transf 62: 295–302.
38. Guo ZS (2002) Review of indoor emission source models. Part 1. Overview. Environ Pollut 120: 533– 549. PMID:12442780
39. Xiong JY, Zhang YP, Huang SD (2011) Characterisation of VOC and formaldehyde emission from building materials in a static environmental chamber: model development and application. Indoor Built Environ 20: 217–225.
40. Li L (2015) Study on characteristics of passenger car in-door air pollutants. Master Thesis, Beijing Insti-tute of Technology, Beijing, China.
41. GB/T 27630–2011 (2011) Guideline for air quality assessment of passenger car. Chinese National Standard.
42. MLIT 2007–539 (2007) Newly manufactured vehicle indoor air quality management standard. Ministry of Labor, Infrastructure and Transportation, South Korea.
43. EPA TO-17 (1999) Determination of volatile organic compounds in ambient air using active sampling onto sorbent tubes. U.S. Environmental Protection Agency (EPA).
44. EPA TO-11A (1999) Determination of formaldehyde in ambient air using adsorbent cartridge followed by high performance liquid chromatography. U.S. Environmental Protection Agency (EPA).
45. ASTM D5157-97 (2003) Standard guide for statistical evaluation of indoor air quality models. American Society for Testing and Materials (ASTM).
46. Chen XK, Feng LL, Luo HL, Cheng HM (2014) Analyses on influencing factors of airborne VOCs pollu-tion in taxi cabins. Environ Sci Pollut Res 21: 12868–12882.
![Fig 4. Validation of correlation (12) with Kim et al. ’ s [2] experimental data from chamber tests.](https://thumb-eu.123doks.com/thumbv2/123dok_br/18352538.353199/10.918.304.673.110.725/fig-validation-correlation-kim-experimental-data-chamber-tests.webp)

![Fig 6. Validation of correlation (16) with Chen et al. ’ s [29, 46] experimental data from vehicular environments.](https://thumb-eu.123doks.com/thumbv2/123dok_br/18352538.353199/14.918.303.691.113.722/fig-validation-correlation-chen-experimental-data-vehicular-environments.webp)
![Fig 7. Validation of correlation (16) with You et al. ’ s [28] experimental data from vehicular environments.](https://thumb-eu.123doks.com/thumbv2/123dok_br/18352538.353199/15.918.300.675.113.729/fig-validation-correlation-et-experimental-data-vehicular-environments.webp)
![Fig 10. Validation of the correlation (20) with You et al. ’ s [28] experimental data from vehicular environments.](https://thumb-eu.123doks.com/thumbv2/123dok_br/18352538.353199/18.918.301.678.114.389/fig-validation-correlation-et-experimental-data-vehicular-environments.webp)
