5512 p。ョャゥセL L.
S., at a/.: A Practical Fiald Study of Partormanoas of Solar Modules ... THERMAL SCIENCE: Yaar 2015, Vol. 19, Suppl. 2, pp. S511-S523
monocrystalline silicon modules are not the best solution for Malaysia's weather conditions. Carr and Pryor [II] confirmed a strong seasonal variation in the performance of crystalline modules with a clear improvement in colder months. This is supported by Aikaet al.[12] whose analysis of the monthly performance ratio (PR) indicated that the monocrystalline silicon mod-ules showed low performance in summer and high performance in winter. Bashiretal. [13], based on experimental investigation in Pakistan, reported that monocrystalline silicon modules are more efficient than other modules, but have shown a higher decrease at higher module tem-peratures. Gxashekaetal.[14] measured and analyzed performance parameters offive PV mod-ules during three stages of a 17-month test period. They also investigated effect of temperature and irradiance on the performance parameters.
Solar irradiance has the greatest impact on the power output ofa PV system [15-17]. Module temperature has significant influence on the behavior ofa PV system, as it modifies sys-tem efficiency and output energy. Itis influenced by the ambient temperature, cloud patterns, and wind speed [18, 19]. The effect of the temperature of the PV module on its efficiencyhas been widely studied [20-26].
Several authors have studied the efficiency of electric conversion ofPV modules as a function ofclimate conditions for specific locations. Furushimaet al.[27] have performed a de-tailed experimental study for city ofKumamoto, Japan. Nordmann and Clavadestcher [28] com-pared the effects of module temperature, environmental temperature, and type of assembly for 18 PV across five different countries.
The PV characteristics (or I-V curve) ofa PV module is the important key for identify-ing its qnality and performance as a function of varyidentify-ing environmental parameters [29, 30]. The curve indicates the characteristic parameters of the PV module at which it would work at peak efficiency. These parameters are indispensable for designing any small or large PV system. Therefore, it is of utmost importance to measure the I-V characteristics with high accuracy un-der natural environmental conditions [31].
Itis important to be familiar with the basic features for a given type of solar modules for local meteorological conditions, since they are significantly site-dependent. Studies focus-ing on the local climatic variables become more relevant and determinant for the economic fea-sibility of investment in installing PV power plants [32-34].
Themainobjective ofthis study was to compare the performances ofhorizontal, verti-cal, and optimally inclined monocrystalline PV modules in real meteorological conditions in city ofNis, Serbia. Solar modules in these three positions can be easily applied in modem archi-tecture in urban settings.
Suo Solar radiation onaPV module
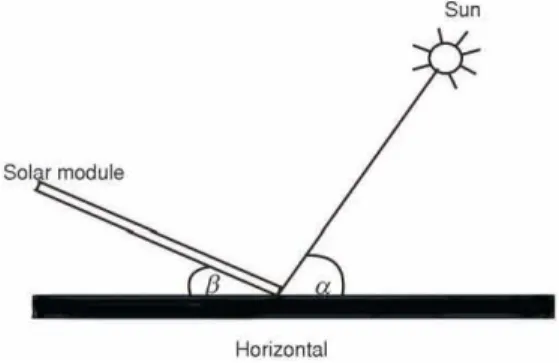
The power incident on a PV module depends not only on the power contained in the sunlight, but also on the angle between the module and the Sun rays (fig. I). When the absorbing sur-face and the sunlight are perpendicular to each other, the power density on the surface is eqnal to that of the sunlight.
If the solar radiation measured on horizontal
Honzcntat surface Ghorizis known then the amount of solar
Figure1.The tiltangle of the module
p
and the radiation incident on a tilted module surfacePanlie,L.5., al al.: A Practical Fiald Study of Performances 01 Solar Modules ...
THERMAL SCIENCE: Year 2015. Vol. 19. Suppi. 2, pp. 5511-5523 8515
E:;""'900
E
800i;. __ 700
z-Nセ 600 s
.!:500 8
@400
'"
N セ 300セ 200
<fJ
--- G hori zontal .... G so uth 32 °
... G sou th 90°セ M r ,
!
16 , -- - - -,
セQT
•
:512"§
1[10 E セ B
6
4
2
o
M RQMMMセセセセセセセセセセセ BBB
8.00 10.00 12,00 14.00 16.00 Time [hJ
Figure2. Change of solar irradiance intensity
for three po,ltlon, of selar modDle, during 05.01.2013
8.00 10.00 12.00 14.00 16.00 18.00 Time [hI
Figure 3. Change of ambient temperature during 05.01.1013
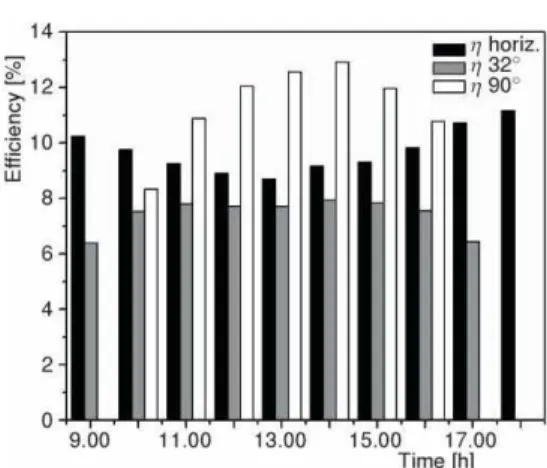
Figure4. Change of efficiency of solar modDles during 05.01.1013
14.00 16.00 Time Ih]
_ ' / hor iz onta l
c:J 1/32 °
c:J 1]90 °
12.00 10.00 8.00 2 6 4 B 1B
On February 5, 2013, the most of solar irradiance was received by optimally inclined solar module ranging 267-850 W/m2,then by the vertical solar module 260-830 W/m2,while the horizontal solar module received the least amount of solar irradiance 150-490 W/m2•On this
day, the elevation angle of the Sun was
a
=
30.6 ° and declination angle was<5
=
-16.4°.The change in ambient temperature during February 5, 2013 is shown in fig. 3.
It can be observed from fig. 3. that the ambient temperature during the day of 05.02.2013 changed from-1.2 °C to 13.7 DC.
Under these conditions, during the day, the optimally inclined solar module generated 333.8 Wh, the vertical solar module 303.9Wh,and the horizontal solar module 150.5 Wh of electrical energy.
For calculating efficiency of all three solar modules eq. (4) was used. The change in the efficiency of solar modules during 05.02.2013 is shown in fig. 4.
As it can be seen in fig. 4, the efficiency ofoptimally inclined solar module was higher in the morning (17.0%) and evening (15.0%) than at high noon (10%). Similarly, the efficiency ofthe vertical solar module was also higher in the morning (16.4%) and evening (16.5%)thanat high noon (9.4%). These differences in the
effi-ciency of the modules are the consequence of the fact that the morning and evening ambient temperatures were lower thanthe temperature at noon and that the solar irradiance intensity incident to the optimally inclined and the verti-cal module was above 800 W/m2at noon. The
5516 Panti6,L.5.,THERMAL SCIENCE: Year 2015, Vol. 19, Suppi. 2, pp. 5511-5523ela/.:APractical Field Study of Perlormance. of Solar Module•...
Figure 6. Change of ambient temperature during June 19, 2013
Figure 7. Change of emciency of solar modules during June 19, 2013
By measurements performed by Mini-KLA device on February 5, 2013 at 13.30 hours fol-lowing results were obtained: VMPP
=
16.6 V,IMPP
=
1.50A,PMPP=
24.9 W,Voc=
20.9 V,I"== 1.63A, and FF= 56.2.
The change of the solar irradiance intensity for the three positions of solar modules during June 19,2013 is shown in fig. 5.
The most ofsolar irradiance, during June 19, 2013, was received by optimally inclined solar module 233-903 W/m2,and then by horizontal
solar module 225-870 W/m2•As expected,
ver-tical solar module received the least solar irradiance 80-310 W/m2•On this day the
eleva-tion angle of the Sun was a
=
70.43° and thedeclination angle was0セ 23.43°.
The change in ambient temperature during June 19,2013 is shown in fig. 6.
In fig. 6. it can be observed that ambient temperature during June 19, 2013 changes from 23°Cto34 °C.
Under these conditions, during the day, hori-zontal solar module generated 348.9 Wh, opti-mally inclined 267.4 Wh, and vertical solar module 112.4 Wh of electrical energy.
The change in the efficiency of solar mod-ules during June 19,2013 is shown in fig. 7.
As shown in fig. 7, the efficiency ofthe hori-zontal module ranges from 9% to 10% during the day. For the optimally inclined module is between 6-8% and for the vertical one is 8-12%. The vertical solar module achieved the effi-ciency of 8-12 % due to the high ambient tem-perature and low incident solar radiation (-300 W/m2at noon). Itshould be noted that all three
modules had efficiency below STC (11%), ex-cept vertically inclined module in early
after-noon.
By measurements performed by Mini-KLA device on June 19,2013 at 13.30 hours follow-ingresults were obtained:VMPP
=
12.1 V,IMPP=
=
3.23 A,PMPP=
39.1 W, Voc=
18.3 V,Ioe
=
セ 3.80 A, and FFセ 56.2.
Results have shown that the efficiency ofall three modules was higher in winter day (Febru-ary 5) than in summer day (June 5). This can be explained by the fact that the module is more ef-_ ,] horiz.
_ ,/ 32° c:::J T/90 °
10.00 12.00 14 .00 16.00 18.00
Time [h)
11.00 13.00 15,00 17.00
Time [h]
40
2:36
セ 32
"
Qjc,28セ 24
r-20 16 12 8 4 0 8.00
1000, ,::-;:= = = - - - -,
セ 900
セ 800 セ 700
•
1fi 600 E "w 500 ca
400 '6 N セ 300セ 200
&l 100
o MャM セセセセセセセセセセセ MMMG
14
l 12
セ
o
0 N セ 10
'"
ur 8 6 4 2 0 9.008.00 10.00 12.00 14.00 16.00 18.00 Time [h]
Pantie, L. S., at a/.:A Practical FieldStudy of Perlormances of Solar Modules ...
THERMAL SCIENCE: Year 2015, Vol. 19, Suppl. 2, pp. S511-S523 8517
ficient when the ambient temperature is low and that their efficiency diminishes at high temper-atures. The daily change io the efficiency ofoptimally ioclioed solar module, during wioter day, had peaks io the momiog and eveniog, and slight dip in the middle ofthe day. While, io summer day, efficiency ofoptimal module had a slight iocrease at high noon. The daily change io the ef-ficiency of the horizontal module, io winter, was not affected much by the change of tempera-ture and solar irradiance because there values were small. The decrease io efficiency ofhorizon-tal module was evident at high noon io summer day.Inwioter day, efficiency of vertical solar module decreases at high noon, whereas, io summer day efficiency peaks at high noon. The changes io temperature and solar irradiance iocident to the vertical module were opposite for these two days.
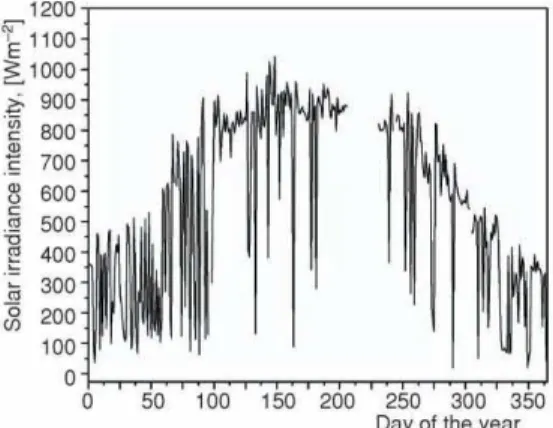
Figure 8. Change of maximaldallysolar irradlance Intensityfor year 2013
Figure 9. The average monthly measured values
of incident solar energy on horizontal module
and calculated valuesof incidentsolar energy on
optimally inclined and vertical solar modules in
year 2013
_ Horizontal 0
l:::I South 32°
c:J South 90°
50 100 150 200 250 300 350
Day of the year
500
2500
1200 , -- - - -,
'1
1100 セ 1000セ 900
Nセ 800 Nセ 700
セ 600
セ 500
セ
400Co 300
セ 200 100
oQMML MNLM セ B⦅⦅ NNNNNLL NNLNNNNN LL⦅⦅ LNNNNNNLL セ L⦅イ⦅ LN⦅⦅L⦅j o
セ
セRPPP
セ
1500jj
o (/) 1000
Annual changes ofparameters
The changes of followiog parameters were considered: solar irradiance iotensity, solar en-ergy, generated electrical enen-ergy, efficiency, PR, FF, and ambient temperature.
The change of maximal daily solar
irradiance iotensity during the year 2013 is shown io fig.8.
The maximum values of the solar irradiance iotensity io January, February, November, and December were below 540 W/m2•Inthe same
period one can notice a lot of peaks because there were a lot ofcloudy days. From the begio-niog of March, the maximum intensity of solar irradiance iocreased until the beginning of
Au-gust reachiog around 900 W/m2and then during September and October continually decreased
to the approximately 400 W1m2
•The highest value of solar irradiance was recorded io May and it measured 1046 W/m2•
The solar energy on horizontal plane was measured, while for planes oriented toward South at the angle of 32· and 90·, it was calcu-lated usiog eq. (1). Due to malfunction of the meteorological station, no data were recorded between 16thofJuly and 18thof August.
The average monthly measured values ofio-cident solar energy on horizontal solar module and calculated values of iocident solar energy on optimally ioclioed and vertical solar module, io year 2013, are shown io fig. 9.
5518 Panti6,L.S., atTHERMAL SCIENCE: Year 2015, Vol. 19, Suppl. 2, pp. S51 1-S523a/.:A Practical Fiald Study of Pertormanee. of Solar Module....
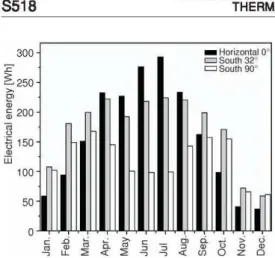
Figure 10. Measured average monthly electrical
energy generatedbythree solar modulesin
year2013
_ Horizontal 0 c:::JSouth32 '
c:::JSouth90'
50 300
100
:c
1;.250
セ
'"
•
セ 200
セ
150j;
ur
The calculated solar energy incident on the optimally inclined solar module increased from its minimum value in January (816 Wh) to its maximum value in April (2713 Wh). Then, from May until October, it had values around 2300 Wh with exception of June when that value was 2711 Wh. The solar energy values significantly decreased in November and De-cember (1130 Wh). Annually, the most of solar energy was received by optimally inclined solar module.
The calculated solar energy incident on ver-tical solar module changed from minimal values in January and February (752 Wh) to the first maximum in April (1502 Wh). Then, its values decreased until the summer minimum in June (793 Wh) and, again, increased to the second maximum in October (2060 Wh). After that, the values decreased in November and December (1253.8 Wh).
The measured average monthly electrical energy generated by the three solar modules in year 2013 is shown in fig. 10.
The average monthly electrical energy generated by horizontal solar module increased from the minimum value in January (58.8 Wh) to themaximal value in July (293 Wh). From April until August, the values ofgenerated energy were above 220 Wh. From September to De-cember, the values of generated energy decreased to the minimum of 37 Wh.
The value ofaverage monthly electrical energy generated by the optimally inclined so-larmodule increased from 108 Wh for January to 222.5 Wh for April.InMay, the value ofaver-age monthly generated electrical energy had a slightly lower value of 192 Wh, and then from June to September, the values of generated electrical energy were above 200 Wh. The value of the generated energy in October (171 Wh) slightly decreased and reached a minimum value in November and December (59 Wh). Optimally inclined module generated less electrical energy in summer months because the increase ofambient temperature increases the solar module tem-perature and reduces its efficiency.
The electrical energy generated by the vertical solar module had two maximums: one in March (168 Wh) and the other one in September (157 Wh). The minimum values ofgenerated electrical energy were in December (61 Wh) and June (100 Wh.)
InJune, the horizontal solar module generated on average 4.7 times more electrical en-ergythanin January, while optimally inclined solar module generated two times more electrical energythanin January. The horizontal solar module generates the most electrical energy in July, while the optimal solar module does in April. The vertical solar module generates the most of electrical energy in March. In year 2013, the optimally inclined solar module generated 62.8 kWh, horizontal solar module 58.1 kWh and vertical solar module 43.9 kWh electrical en-ergy.
![Figure 4. Change of efficiency of solar modDles during 05.01.1013 14.00 16.00Time Ih]_' / hor iz onta lc:J 1/32 °c:J 1]90 °12.0010.008.00264B1B](https://thumb-eu.123doks.com/thumbv2/123dok_br/18383697.356703/5.897.471.741.834.1051/figure-change-efficiency-solar-moddles-time-ih-onta.webp)