www.biogeosciences.net/13/551/2016/ doi:10.5194/bg-13-551-2016
© Author(s) 2016. CC Attribution 3.0 License.
Runoff- and erosion-driven transport of cattle slurry:
linking molecular tracers to hydrological processes
C. E. M. Lloyd1,2, K. Michaelides2, D. R. Chadwick3, J. A. J. Dungait4, and R. P. Evershed1
1Organic Geochemistry Unit, Bristol Biogeochemistry Research Centre, School of Chemistry, University of Bristol,
Cantocks Close, Bristol, BS8 1TS, UK
2School of Geographical Sciences, University of Bristol, University Road, Bristol, BS8 1SS, UK
3School of Environment, Natural Resources and Geography, Bangor University, Deiniol Road, Bangor, Gwynedd,
LL57 2UW, UK
4Department of Sustainable Soils and Grassland Systems, Rothamsted Research-North Wyke, Okehampton, EX20 2SB, UK
Correspondence to:C. E. M. Lloyd (charlotte.lloyd@bristol.ac.uk)
Received: 13 July 2015 – Published in Biogeosciences Discuss.: 16 October 2015 Revised: 5 January 2016 – Accepted: 6 January 2016 – Published: 1 February 2016
Abstract. The addition of cattle slurry to agricultural land is a widespread practise, but if not correctly managed it can pose a contamination risk to aquatic ecosystems. The trans-port of inorganic and organic components of cattle slurry to watercourses is a major concern, yet little is known about the physical transport mechanisms and associated fluxes and timings of contamination threats. Therefore, the aim of the study was to ascertain the importance of flow pathway parti-tioning in the transport (fluxes and timing) of dissolved and particulate slurry-derived compounds with implications for off-site contamination. A series of rainfall–runoff and ero-sion experiments were carried out using the TRACE (Test Rig for Advancing Connectivity Experiments) experimen-tal hillslope facility. The experiments allowed the quantifi-cation of the impact of changing slope gradient and rain-fall intensity on nutrient transport from cattle slurry applied to the hillslope, via surface, subsurface, and vertical perco-lated flow pathways, as well as particulate transport from ero-sion. The dissolved components were traced using a combi-nation of ammonium (NH+4) and fluorescence analysis, while the particulate fraction was traced using organic biomark-ers, 5β-stanols. Results showed that rainfall events which produced flashy hydrological responses, resulting in large quantities of surface runoff, were likely to move sediment and also flush dissolved components of slurry-derived mate-rial from the slope, increasing the contamination risk. Rain-fall events which produced slower hydrological responses were dominated by vertical percolated flows removing less
sediment-associated material, but produced leachate which could contaminate deeper soil layers, and potentially ground-water, over a more prolonged period. Overall, this research provides new insights into the partitioning of slurry-derived material when applied to an unvegetated slope and the trans-port mechanisms by which contamination risks are created.
1 Introduction
water-courses (e.g. Chambers et al., 2000; Delconte et al., 2014; Quemada et al., 2013). However, studies have shown that the organic fraction can provide a large proportion of the total N load in some catchments and a smaller yet environ-mentally significant fraction in N-enriched waters (Durand et al., 2011; Willett et al., 2004; Johnes and Burt, 1991). This excess N leads to eutrophication of surface waters, resulting in algal blooms and reduced oxygen levels. Sutton (2011) reported that excess N in the environment costs the EU be-tween EUR 70 and 320 billion per annum, more than double the value that the N fertilisers provide to EU farms in terms of production. Combating and mitigating against these prob-lems is extremely costly; the UK spends up to GBP 300 mil-lion each year cleaning water courses, equating to up to 2 % of the gross agricultural output (Pretty et al., 2000). Given these severe environmental and financial consequences it is important to better understand the main transport pathways, fluxes and transit times of pollutants from livestock slurries into watercourses to develop effective mitigation strategies. Slurry transport has been quantified mainly in terms of the inorganic fraction (e.g. nitrate and phosphate) and associated pathogens (e.g. coliforms) (e.g. Edwards et al., 2012; Coelho et al., 2012; Eastman et al., 2010), but there is a relative lack of understanding of physical transport mechanisms and the associated fluxes and timings of contamination threats from areas treated with livestock slurries.
The transport of slurry components on land is primarily controlled by the hydrological and erosion regime operat-ing at the site of application. The dynamics of flow pathway partitioning during storm events and the consequential out-put of agricultural contaminants has been explored (Delpla et al., 2011; Blanchard and Lerch, 2000; Gao et al., 2004; Zhang et al., 1997; Malone et al., 2004), but there is a lack of experimental data quantifying contaminant export via indi-vidual flow pathways due to methodological challenges. In a field context it is challenging to monitor multiple flow path-ways without destructive sampling, although new research platforms are now making this type of research more possi-ble (see Peukert et al. (2014) for an example). There are also challenges when choosing field sites that represent transport regimes across different slope angles or to account for other environmental variables. Therefore, laboratory flume experi-ments have been widely used to investigate questions relating to hydrology and erosion in conjunction with solute and sedi-ment transport, although most studies to date have only mea-sured surface runoff and/or vertical drainage (e.g. Montene-gro et al., 2013; Guo et al., 2010; Aksoy et al., 2012; Asam et al., 2012). Our previous work using a one-dimensional soil column revealed the rapid partitioning of livestock slurries in the soil-water system into sediment-associated material re-maining on or close to the surface and dissolved components which moved rapidly through the soil by leaching (Lloyd et al., 2012). Given this partitioning into surface and subsur-face components and its potential importance for contamina-tion of downstream aquatic and soil environments, we aim
to quantify the relative fluxes of different slurry compounds driven by surface (overland flow and erosion) and subsurface (throughflow and leaching) flow pathways during a series of experiments in which rainfall rate and slope angle vary. We vary rainfall rate and slope angle in order to simulate hydro-logical variations which may result in differential partition-ing of flow pathways.
In this study we use biogeochemical biomarker analysis in combination with controlled, large-scale rainfall-simulation experiments to quantify the relative fluxes of slurry compo-nents through different flow pathways within a slope system. In particular, we monitored flow rates in three pathways – surface runoff, subsurface throughflow and vertical perco-lated – over the course of different rainfall simulation ex-periments in which we varied the slope gradient and rain-fall intensity and duration. We also monitored erosion rates in the surface runoff component of the flow. Within samples of water discharging from each flow pathway we measured concentrations of ammonium (NH+4) and the fluorescence spectra as tracers of the dissolved (soluble) component of the slurry. Samples of eroded sediment and in situ soil cores were analysed for total nitrogen (TN), carbon (TC) and 5β-stanols, which have been shown to be an effective and un-equivocal biomarker of particulate slurry material (see Lloyd et al., 2012). The aim of the study was to ascertain the im-portance of flow pathway partitioning in the transport (fluxes and timing) of dissolved and particulate slurry-derived com-pounds with implications for off-site contamination.
2 Materials and methods 2.1 Experimental set-up
realis-PERC OL
ATED FL
OW
SUBSURF ACE
SURF ACE 1
2
3
4 2.5 m
6 m
0.3 m
1 1
1
2
2
3 3
4
4
(a) (b)
Figure 1. (a)Schematic showing sampling outlets on the TRACE slope and(b)photo showing the empty slope.
tic range found in agricultural settings. The rainfall intensi-ties were chosen to test the impact of short duration, high-intensity rainfall events on slurry transport because extreme storm events have a disproportional impact on the transport of dissolved and particulate contaminants to water courses (Evans and Johnes, 2004; Haygarth et al., 2005, 2012; Roze-meijer and Broers, 2007). Rainfall simulations using 60 and 120 mm h−1were used so that a systematic doubling of
rain-fall intensity could be tested in conjunction with a change in slope gradient. 60 mm h−1was chosen as this was the
low-est intensity which could be stably simulated that was cru-cial for ensuring controlled experiments. Therefore we ef-fectively substituted simulation time for intensity.
Before each experiment the slope was packed with the same silt loam soil (34 % sand, 37 % silt and 27 % clay,d50=
200 µm) and compacted evenly across the surface of the slope. Even compaction was achieved for each experiment by following the method outlined in Michaelides et al. (2010), where layers of soil were added and compacted using a 2.5 m tamping board which was moved up and down the length of the slope. The average final bulk density achieved using this procedure was∼1.5 g cm−3.
Cattle slurry collected from a commercial dairy farm was applied to the top 1 m of the experimental slope at an applica-tion rate of 5 L m−2mimicking typical field application rates
(CSF Evidence Team, 2011). Table 1 shows the chemical composition of the cattle slurry and the initial soil used for all of the experiments. Two additional control experiments with no slurry treatment were also carried out, one at each of the tested slope angles (5 and 10◦). Both of the control exper-iments were carried out using 60 mm h−1rainfall intensity. During each experiment rainfall was applied and discharge from the slope was monitored via the three flow pathways: (1) surface runoff, (2) subsurface throughflow and (3) vertical percolated flow, in order to investigate the transport of slurry-derived compounds. Eroded sediment was separated from the surface runoff using the protocol outlined below and kept for analysis. At the end of the rainfall simulation soil cores were
Table 1.Chemical characteristics of control soil and cattle slurry (dry weight basis) used in all of the experiments.
Parameter Initial soil Cattle slurry
Total carbon 2.7 %±0.2 39.6 %±0.3
Total organic carbon 2.6 %±0.2 39.0 %±0.3
Total nitrogen 0.4 %±0.09 3.49 %±0.004
Ammonium 0.0016 %±0.0005 0.39 %±0.0005
Nitrate 0.0022 %±0.00006 0 %
Nitrite 0.00004 %±0.00003 0 %
Organic N 0.4 %±0.09 3.45 %±0.004
taken from the slope according to the sampling strategy out-lined in Sect. 2.2. The soil cores and eroded sediment were used to investigate the erosion and within-slope deposition of slurry-derived particulates.
2.2 Sampling
Discharge from each flow pathway was determined at regular intervals during the course of the rainfall simulations. Dis-charge from the surface runoff pathway was monitored by logging water depth using a “V”-notch weir and capacitance depth probe, at 1 min intervals. The water depth was con-verted to discharge by a pre-calibrated stage-discharge rela-tionship for the “V”-notch weir. Additional manual samples of the surface runoff were taken at∼5 min intervals to deter-mine sediment concentration and to obtain eroded sediment samples for analysis. The water and sediment were separated using a centrifuge (2400 rpm, 30 min) and the water samples were filtered through 0.45 µm filter (Whatman, cellulose ac-etate) then stored at−18◦C until analysis was carried out. Flow discharge from the subsurface and percolated pathways was monitored manually at∼5 min intervals by timing the flow of a known volume of water.
ef-fects (samples 0.75 m apart across slope, 1 m apart downs-lope), to a depth of 5 cm. Only the top 5 cm were sampled because pilot experiments and previous research have shown that this section is the most important in terms of the trans-port of slurry-derived material (see Lloyd et al., 2012). The soil cores and eroded sediment were freeze-dried and stored at−18◦C until analysis.
2.3 Laboratory analyses 2.3.1 Runoff water analyses
All water samples were analysed for NH+4 (µg L−1) using a continuous segmented flow autoanalyser (AA3; Seal An-alytical). NH+4 was determined using the Berthelot reaction (Berthelot, 1859), where a blue-green compound was pro-duced and quantified colorimetrically. NH+4 was the only in-organic N fraction measured as the cattle slurry used con-tained no measureable NO−3 or NO−2 (see Table 1). Also, pre-vious work carried out using the same soil and slurry showed that after slurry application and leaching for 8 h, there was no detectable difference between the concentrations of ex-tractable NO−3 or NO−2 from slurry-treated or control soils (unpublished data). This is most probably due to the soils having a low moisture content (∼8 %) at the beginning of the experiments, which then become rapidly saturated. Both low moisture and potential oxygen limitation (due to water-logging) later in the experiments could inhibit rates of ni-trification. As a result, there is no evidence to suggest that nitrification would occur over the timescales of the current TRACE experiments and therefore NH+4 was the sole inor-ganic compound used to trace slurry in this paper.
Fluorescence spectroscopic analysis of all leachate sam-ples was carried out using a HORIBA Jobin Yvon FluoroLog®-3 spectrofluorometer (Stanmore, UK); the ex-citation source was a Xe lamp. Samples were measured in a 1 cm quartz cuvette at room temperature. The methodol-ogy of Peuravuori et al. (2002) was adopted to collect syn-chronous spectra, using 1 nm increments from 250 to 600 nm, with an 18 nm offset between the excitation and emission monochromators. The spectra were then corrected for the flu-orescence of Milli-Q water and for inner-filter effects, based on the sample absorbance. The sample absorbance at 250– 600 nm was measured in a 1 cm cuvette, using a Shimadzu UVmini-1240. Milli-Q subtracted absorbance spectra were then used to correct the fluorescence spectra for primary and secondary inner-filter effects using the following equation: Ic=Im/
10−b(Aex+Aem),
where Ic is the true fluorescence intensity,Im is the
mea-sured fluorescence intensity,bis the sample path length, and AexandAemare the absorbance values at the excitation and
emission wavelengths respectively (Lakowicz, 1983; Ohno, 2002). The spectra were then converted to arbitrary Raman units by normalising the fluorescence intensities by the area
of the water Raman peak in order to compare the relative magnitude of the peaks present between the experiments. The ratio between the fluorescence intensities of emissions at ∼290 and ∼380 nm was calculated as previous work has shown that it can be used to monitor the presence of slurry-derived compounds in natural waters (Baker, 2002a, b; Naden et al., 2010; Lloyd et al., 2012).
2.3.2 Soil and eroded sediment analyses
The soil and eroded sediment samples were analysed in trip-licate for total carbon (TC), inorganic carbon (IC) and to-tal nitrogen (TN) (%) using a Carlo Erba EA1108 Elemento-tal Analyser. Total organic carbon (TOC) was then calculated by subtracting the IC from the TC.
Lipid analysis was used to extract and quantify the stanol concentration within the soil cores and eroded sediment sam-ples, specifically the 5β-stanols, which were used as a tracer of slurry-derived particulates (Bull et al., 2002; Leeming et al., 1996; Evershed et al., 1997; Nash et al., 2005; Lloyd et al., 2012). As 5β-stanols stigmastanol and its epimer are the biohydrogenation products of sitosterol (a major plant sterol) and are only produced during rumination, they can be used as unequivocal tracers of the hydrophobic fraction of ruminant faeces. The 5αform is produced by microbial activity under aerobic conditions, i.e. outside the rumen, so the ratio 5β:5α is used to investigate the contribution of either source. To achieve this, a total lipid extract (TLE) was obtained from the soil and eroded sediment samples using Soxhlet extraction (CH2Cl2:Me2CO9:1v/v, 24 h, van Bergen et al., 1997)
with an internal standard (preg-5-en-3β-ol). Aliquots of the TLE samples were saponified by adding 1 mL of 0.5 M methylated MeOH and heating at 70◦C for 60 min before
acidification to pH 3 by adding 1 mL of 1 M HCl. Then 1 mL of DCM-extracted DDW was added along with 2 mL of DCM and the sample was vortex mixed for 20 s and al-lowed to settle to give a two-phase sample. The organic layer was extracted from the bottom then the DCM extraction was repeated two more times to ensure the entire organic sample was collected. The composite organic phase was then filtered through a pipette containing anhydrous sodium sulphate (NaSO4) in order to ensure any residual water was removed,
then the sample was blown down to dryness under N2. An
aliquot of the saponified TLE was then derivatised using 50 µL of N,O-bis(trimethylsilyl)trifluroacetamide with 1 % trimethylchlorosilane and heating at 70◦C for 1 h. The
70 eV with the quadrapole mass analyser scanning the range m/z50–650 (scan time 0.6 s). The distribution of sterols and stanols present were then quantified against the internal stan-dard.
The ratio of 5β-:5α-stanols was determined in order to assess the relative contribution of slurry-derived insoluble or-ganic matter (IOM) to native soil IOM in the soil cores. This is a useful technique where the 5β-stanol concentrations are low, as the ratio allows differences between the samples to be seen more clearly.
2.4 Statistical analyses
Statistical differences between the slurry-treated experiments and the control experiments were tested for each of the mea-sured parameters using either attest or a Mann–Whitney test depending on whether the specific data sets were normally or non-normally distributed.
3 Results
3.1 Flow pathway partitioning and erosion
The results show that as rainfall intensity and slope gradi-ent increased a higher proportion of flow was transported via surface and shallow subsurface flows in the slurry-treated ex-periments (Fig. 2). Doubling the rainfall intensity had a larger impact on the flow pathway partitioning compared with dou-bling the slope gradient. Figure 2 summarises the partitioning of water flow through the slope for the slurry-treated exper-iments. Discharge data for the control experiments are not included as the results mirrored the slurry experiments run under the same experimental conditions. The two experimen-tal end-member scenarios showed a reversal in behaviour of the flow partitioning, where at 5◦, 60 mm h−1∼99 % of the flow was transported as vertical percolated flow and at 10◦, 120 mm h−1,∼99 % of the flow was routed across the soil surface as overland flow. All experiments received the same volume of rainfall, therefore halving the slope gradient and rainfall intensity caused a 60 % increase in the storage of wa-ter within the soil. At a rainfall intensity of 60 mm h−1 dou-bling the slope gradient induced a reduction in the vertical percolated flow (to 26 %) and increase in subsurface through-flow (28 %) and surface runoff (46 %) due to higher sur-face water velocities and reduced infiltration rates. Therefore, overland flow generation was a combination of infiltration-excess (fast) and saturation infiltration-excess (slower) overland flow. When the rainfall intensity increased to 120 mm h−1the
sys-tem was dominated by infiltration-excess overland flow. At a slope gradient of 5◦, 67 % of the discharge was surface runoff and 29 % was subsurface throughflow. However, increasing the slope gradient to 10◦resulted in 99 % of the flow trans-ported as surface runoff.
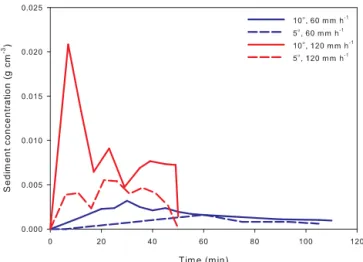
Figure 3 shows the corresponding sedigraphs of eroded sediment transported in the overland flow for each of the
0 20 40 60 80 100 120 140 0
200 400 600 800 1000
10°, 60 mm h−1
0 20 40 60 80 100 120 0
500 1000 1500 2000
10°, 120 mm h−1
0 20 40 60 80 100 120 0
100 200 300 400 500 600 700 800
5°, 60 mm h−1
0 10 20 30 40 50 60 70 80 90 0
500 1000 1500
5°, 120 mm h−1
Surface runoff Subsurface throughflow Percolated flow
Time (min)
C
umulativ
e
dischar
ge (L)
Figure 2.Plots showing cumulative discharge from surface runoff, subsurface throughflow and vertical percolated flow from the slurry-treated slope experiments.
Figure 3.Plot showing sedigraphs for each of the slurry-treated slope experiments.
slurry-treated experiments. Like discharge the data for the control experiments are not included as their behaviour mir-rored that of the slurry-treated experiment run under the same experimental conditions. The experiments run at 60 mm h−1 rainfall produced sediment concentrations that increased gradually until the middle of the experiment before decreas-ing later in the event. At 120 mm h−1the 5◦experiment
pro-duced a similar trend to those run at the lower rainfall in-tensity (at both 5 and 10◦slopes), however the sediment
0 20 40 60 80 100 120 140 160 180 200 220 0 20 40 60 80 100 0 0.05 0.1 0.15 0.2 0.25
Sediment discharge (g s
−1)
0 20 40 60 80 100 120 140 160 180 200 220
0 0.02 0.04 0.06 0.08 0.1 0.12 NH 4
+ conc. (mg
L
−1
)
Surface runoff Sub−surface runoff Percolated − 1 Percolated − 2 Percolated − 3 Percolated − 4 Eroded sediment
Surface runoff Sub−surface runoff Percolated − 1 Percolated − 2 Percolated − 3 Percolated − 4 Eroded sediment 5o, 60 mm h-1
RAIN
0 20 40 60 80 100 120 140 160 180
0 20 40 60 80 100 Discharge (c m
3 s
−1 ) 0 0.05 0.1 0.15 0.2 0.25
0 20 40 60 80 100 120 140 160 180
0 0.02 0.04 0.06 0.08 0.1 Surface runoff Sub−surface runoff Percolated − 1 Percolated − 2 Percolated − 3 Percolated − 4 Eroded sediment
Surface runoff Sub−surface runoff Percolated − 1 Percolated − 2 Percolated − 3 Percolated − 4 Eroded sediment RAIN
10o, 60 mm h-1
Sediment discharge (g s
−1)
Discharge (c
m
3 s −1)
NH
4
+ conc. (mg
L
−1
)
CONTROL CONTROL
c) d)
Time (min) Time (min)
(a) (b)
Figure 4.Plots showing water and sediment discharge(a, b)and NH+4 concentrations(c, d)from each monitored flow pathway for the
control experiments (no slurry) at two slope angles (5 and 10◦) at 60 mm h−1rainfall intensity. Where percolated 1–4 represent vertical
transport from each of the pairs of tanks beneath the soil slope as marked in Fig. 1.
0 20 40 60 80 100 120 140
0 20 40 60 80 100 120 0 0.01 0.02 0.03 0.04 0.05
0 20 40 60 80 100 120 140
0 0.1 0.2 0.3 0.4 0.5 Surface runoff Sub−surface runoff Percolated − 1 Percolated − 2 Percolated − 3 Percolated − 4 Eroded sediment
Surface runoff Sub−surface runoff Percolated − 1 Percolated − 2 Percolated − 3 Percolated − 4 RAIN
5o, 60 mm h-1
0 20 40 60 80 100 120 140
0 20 40 60 80 100 0 0.05 0.1 0.15 0.2 0.25
0 20 40 60 80 100 120 140
0 0.1 0.2 0.3 0.4 0.5 Surface runoff Sub−surface runoff Percolated − 2 Percolated − 4 Eroded sediment
Surface runoff Sub−surface runoff Percolated − 2 Percolated − 4 RAIN
10o, 60 mm h-1
Discharge (c
m
3 s
−1
)
Discharge (c
m
3 s
−1
)
Sediment discharge (g s
−1
)
Sediment discharge (g s
−1)
NH
4
+ conc. (mg
L
−1)
NH
4
+ conc. (mg
L
−1
)
SLURRY SLURRY
Time (min) Time (min)
(a) (b)
(c) (d)
Figure 5.Plots showing water and sediment discharge(a, b)and NH+4 concentrations(c, d)from each monitored flow pathway for the slurry-treated experiments at two slope angles (5 and 10◦) at 60 mm h−1rainfall intensity. Where percolated 1–4 represent vertical transport from each of the pairs of tanks beneath the soil slope as marked in Fig. 1. Note: data which are absent reflect the lack of activation of a particular flow pathway.
to a sediment export rate similar to that of the lower gradient slope.
3.2 Dissolved chemical species analyses 3.2.1 Ammonium (NH+4)
Figures 4, 5, and 6 show a direct comparison of the flow and sediment and the NH+4 concentration from each monitored flow pathway during each experiment. The control experi-ments (Fig. 4) produced a total of between 12 and 25 mg of leached NH+4 originating from the soil (no added slurry), with concentrations never exceeding 0.1 mg L−1 from any pathway. The total mass of NH+4 exported from each experi-ment depended on the relative flow pathway partitioning be-cause the experiments which generated higher volumes of surface runoff contributed a larger flux of NH+4, between 1.8
and 11.3 % of the total NH+4 measured from the slope outlets. An approximately equal proportion of the exported NH+4 was leached from the vertical percolated flow outlets in all con-trol experiments, between 10.9 mg (48 %) and 7.6 mg (62 %), with the remainder transported via sub-surface runoff.
0 20 40 60 80 100 120 140 0
100 200 300 400 500
Surface runoff Sub−surface runoff Percolated − 4
0 1 2 3 4
Eroded sediment
0 20 40 60 80 100 120 140
0 0.1 0.2 0.3 0.4
0.5 Surface runoff
Sub−surface runoff Percolated − 4
RAIN 5
o, 120 mm h-1
0 20 40 60 80 100 120 140
0 200 400 600 800
0 2 4 6 8
0 20 40 60 80 100 120 140
0 0.1 0.2 0.3 0.4 0.5
RAIN
Surface runoff Sub−surface runoff Eroded sediment
Surface runoff Sub−surface runoff
10o, 120 mm h-1
SLURRY SLURRY
Discharge (c
m
3 s
−1
)
Discharge (c
m
3 s
−1
)
Sediment discharge (g s
−1
)
Sediment discharge (g s
−1)
NH
4
+ conc. (mg
L
−1
)
NH
4
+ conc. (mg
L
−1
)
Time (min) Time (min)
(a) (b)
(d) (c)
Figure 6.Plots showing water and sediment discharge(a, b)and NH+4 concentrations(c, d)from each monitored flow pathway for the slurry-treated experiments at two slope angles (5 and 10◦) at 120 mm h−1rainfall intensity. Where percolated 1–4 represent vertical transport from each of the pairs of tanks beneath the soil slope as marked in Fig. 1. Note: data which are absent reflect the lack of activation of a particular flow pathway.
and 99 % of the total. The experiment with the most sur-face runoff (10◦, 120 mm h−1) generated a NH+4 yield of 404 mg, an order of magnitude larger than any other exper-iment. NH+4 was also observed at similar concentrations in the sub-surface flow pathway when activated. During the ex-periment where the majority of the water flow was via ver-tically percolated pathways (5◦, 60 mm h−1), the
concentra-tions of NH+4 were similar to those observed in the dominant pathways for other slurry experiments (0.1–0.5 mg L−1). The area associated with the largest percolated flux tended to be the top of the slope directly below the slurry application area, illustrating that the slurry can still be rapidly transported dur-ing smaller rainfall events but the dissolved fraction is infil-trated rather than routed across the soil surface.
In general, the transport of NH+4 was controlled by the flow partitioning, and the concentrations did not increase with contact time with the soil, providing additional evidence that the NH+4 was representing the dissolved slurry-derived material. This can be seen very clearly in Fig. 6c, where the concentration of NH+4 observed in the percolated flow path-way is highest after 20 min, showing that the slurry material had reached the bottom of the slope.
3.2.2 Fluorescence spectroscopy
Figure 7 shows the average fluorescence spectra for each flow pathway for each experiment, along with the mean spectra of the control samples and the slurry. This plot highlights that the difference between the fluorescence spectra of the slurry and control soil is the magnitude of the peak at ex-citation wavelength 270 nm (emission 290 nm), which has been attributed to “proteinaceous material” (Baker, 2002a, b; Peuravuori et al., 2002), therefore providing a useful tracer of slurry-derived dissolved organic matter (DOM) (Lloyd et al., 2012). This “protein” fluorescence can be a useful tracer
for slurry as proteins form a significant part of the organic nitrogen pool, which can be derived from plant, animal or bacterial sources (Jones et al., 2005; Vinolas et al., 2001). It is well documented that fluorescence at an excitation at 270 nm can be linked to farm wastes (Baker, 2002a; Hudson et al., 2007; Naden et al., 2010) and the lack of a signal in the control samples supports the hypothesis that the slurry is the source in these experiments. The assumed higher molec-ular weight compounds that fluoresce at longer wavelengths are most likely derived from soil DOM rather than from the slurry. In general, the fluorescence intensity at higher wave-lengths (e.g. 360 and 446 nm) is lower in the surface runoff and subsurface samples compared with those collected from the percolated pathway, providing more evidence that the source is soil-derived.
300 400 500 600 0
0.1 0.2 0.3 0.4 0.5 0.6 0.7 0.8
10 °, 60 mm h−1
300 400 500 600
0 0.1 0.2 0.3 0.4 0.5 0.6 0.7 0.8
5 °, 60 mm h−1
300 400 500 600
0 0.1 0.2 0.3 0.4 0.5 0.6 0.7 0.8
10 °, 120 mm h−1
300 400 500 600
0 0.1 0.2 0.3 0.4 0.5 0.6 0.7 0.8
5 °, 120 mm h−1
1 s. d. Control Slurry Surface
Subsurface
Vertical
Wavelength (nm)
F
luor
esc
enc
e int
ensit
y (R
aman units)
Figure 7.Plots showing the mean fluorescence spectra from the surface runoff, subsurface throughflow and vertical percolated pathways for each slurry-treated experiment along with the average spectra from all pathways of the control experiments and the spectra from the applied slurry. The shaded area represents 1 standard deviation around the mean of the control soil spectra.
10o, 60 mm h-1 5o
, 60 mm h-1
5o, 120 mm h-1 10o, 120 mm h-1
‘270’:360’
ratio
‘270’:360’
ratio
be examined. At the highest slope gradient and rainfall in-tensity slurry-derived DOM was only detected in percolated outlet 1 which is located directly underneath the slurry ap-plication area, there was a lack of infiltration across the rest of the slope. The experiment run with a slope gradient of 5◦and rainfall intensity of 60 mm h−1produced the highest volume of discharge from vertical percolated flow, however slurry-derived DOM was only significantly detected (Mann– Whitney, control vs. slurry,p=<0.001) via the fluorescence in outlet 1 throughout the experiment and through outlet 2 for the first 30 min. The 270:360 ratio was also significantly greater than the control values in outlets 1, 2, and 4 (Mann– Whitney, control vs. slurry, p=<0.001) at the end of the experiment suggesting slurry-derived DOM was reaching the bottom of the slope by the end of the simulation. There were no significant increases in 270:360 nm fluorescence from any of the vertical percolated flow pathways in the experi-ment run at 5◦and 120 mm h−1rainfall, or from the base of
the slope (outlet 4) in the 10◦, 60 mm h−1experiment. Over-all, these analyses allowed the identification of the locations where slurry-derived DOM has been transported throughout the rainfall simulations.
3.3 Soil and eroded-sediment analyses 3.3.1 Elemental analyses of C and N
Our previous work showed that the components of slurry-derived material which are most likely to bind to the soil re-main in the top 5 cm even after prolonged periods of leach-ing (Lloyd et al., 2012). Therefore, elemental analyses of C and N were restricted to the top 5 cm of the soil cores. There was no significant difference between the TOC and TN values in the soil cores for the slurry-treated experiments (median TOC=1.7 %, TN=0.2 %) compared to the experi-mental controls (median TOC=1.4 %, TN=0.3 %) (TOC, Mann–Whitney, control vs. slurry, p=0.052; TN, Mann Whitney, control vs. slurry,p=0.181). TOC and TN in the eroded sediment were also determined in samples taken from the slurry-treated slopes. The majority of the experiments showed increases in the concentrations of TOC in the eroded sediment compared to the control slopes (Mann–Whitney, control vs. slurry,p=<0.02 for all experiments), with max-imum values of up to 4.2 %. The experiments which did not generate high erosion rates had lower concentrations of 1.5 % TOC. Concentrations of TOC in the eroded sediment samples generally decreased through time in most experi-ments, except when erosion rates where sustained through the experiments whence values also remained stable. TN concentrations of eroded sediment were greater than those in the control soil in only one experiment, however they were not significantly more (Mann–Whitney, control vs. slurry, p=0.179). Overall, these data confirm that the elemental analyses alone do not provide a robust method to trace the transport of slurry-derived particulates.
Top
Eroded
Relativ
e int
ensit
y
Control 1
10 9
8
7 6 5 4 3 2
1
10 9
8 5
4 3 2
3 8 9 10
Figure 9. Partial chromatogram (m/z=215) showing exam-ples of characteristic hydrolysed lipid extracts from the top section of the soil slope, the eroded sediment (taken from
the 10◦, 60 mm h−1 experiment) and the control soil. Where
1=coprostanol, 2=epicoprostanol, 3=5α-cholestanol, 4=5β
-campestanol, 5=5β-epicampestanol, 6=24-ethyl-campestanol,
7=24-ethyl-5β-cholestan-3α-ol, 8=5β-stigmastanol, 9=5β -epistigmstanol, 10=5α-stigmastanol.
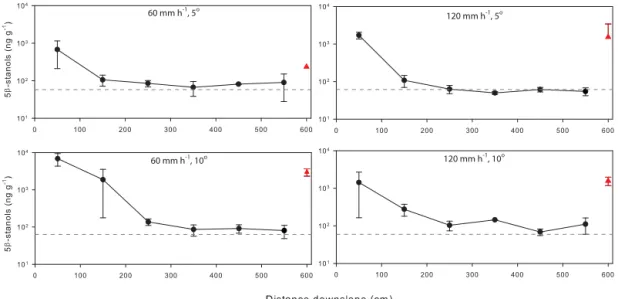
3.3.2 Lipid analyses on eroded sediment and soil cores Figure 9 shows example partial chromatograms for a soil core from the top area of the slope, eroded sediment and the control soil. These data clearly illustrate the dominance of the 5β-stanols in the slurry-treated samples relative to the con-trol soil. The concentration of 5β-stanols, a robust biomarker for slurry-derived IOM, in the slurry was 12 982 ng g−1 com-pared with an average of 67.7 ng g−1in the control soil. The soil cores taken from the slurry application area were signif-icantly enriched with concentrations averaging 2850 ng g−1 (Mann–Whitney, control vs. slurry, p=0.010). Generally, the 5β-stanol concentrations in the soil cores decreased exponentially with distance downslope, with average con-centrations at the bottom of the slope of 84 ng g−1 which were not significantly different from the control soil (Mann– Whitney, control vs. slurry,p=0.343). The average concen-tration of the eroded sediment was 2040 ng g−1 which was
loca-60 mm h-1, 5o
60 mm h-1, 10o
120 mm h-1
, 5o
120 mm h-1
, 10o
Figure 10.Plots showing the change in average concentration of 5β-stanols in soil cores downslope for each of the slurry-treated experiments. The dashed line shows the mean concentration in the control soil, and the triangles represent the average concentrations in the eroded sediment.
tions the range of concentrations was large, possibly due to preferential surface runoff pathways which distributed sedi-ment laterally across the slope as well as downslope.
In addition to absolute concentrations the ratio between 5β- (slurry-derived) and 5α- (soil-derived) stanols was cal-culated in order to assess the contribution of slurry-derived IOM versus native soil IOM in the soil cores (data not shown). Results showed a spatial pattern in the distribution of the ratio of 5β-:5α-stanols in the soil across the slope sur-face for each experiment, exhibiting an exponential decline in 5β-:5α-stanols ratio in the downslope direction from where slurry was applied. The main difference between the experiments was in the variability of stanol ratios, which was a function of slope gradient. The standard deviation and vari-ance of the stanol ratios was calculated for each experiment (not including the top of the slope where the slurry was ini-tially applied) in order to assess the variation in transported slurry-derived material between experiments (Table 2). The analysis showed that increasing slope gradient resulted in an increase in the standard deviation of the ratios in soil cores across the slope suggesting that surface runoff at lower gradi-ents was flowing more evenly over the soil surface compared to the steeper slopes which may have exhibited more prefer-ential flow routing.
The concentrations of 5β-stanols were also quantified in the sediment eroded from the slope during each experiment. In order to obtain an adequate sample of sediment for 5β -stanol analysis, the eroded sediment samples were combined into three time segments, representing the beginning, mid-dle, and end of the rainfall simulation (see Table 3 for the ex-perimental time covered by each composite sample). As the sediment flux from the 5◦, 60 mm h−1experiment was rela-tively low only one analysis was possible which represented
Table 2.Spatial variability in the ratios of 5β:5α-stanols in soil cores across the slope for each experiment (excluding samples taken in the slurry application area).
Standard deviation Variance
60 mm h−1 5
◦ 0.14 0.02
10◦ 0.79 0.62
120 mm h−1 5
◦ 0.39 0.15
10◦ 0.42 0.17
the entire event. The average concentrations of 5β-stanols are shown in Fig. 9 and the temporal variations in concen-trations are shown in Table 3. The lowest concentration of 5β-stanols was recorded in the eroded sediment from the ex-periment with the lowest volume of surface runoff, suggest-ing that transport of slurry-derived POM was therefore lim-ited, and therefore reflected in the low sediment yield under these conditions. Experiments with higher volumes of sur-face runoff resulted in an increase in the 5β-stanol concen-trations by up to a factor of 10. Increasing rainfall intensity appeared to have little effect on the concentrations of 5β-stanols exported at the beginning of the rainfall simulations at a slope gradient of 5◦. However, increasing slope gradient
Table 3.Concentrations of 5β-stanols in the eroded sediment (dry weight basis) through time and the total exported mass throughout the experiment.
60 mm h−1 120 mm h−1
5◦ 10◦ 5◦ 10◦
Time Conc. Mass Conc. Mass Time Conc. Mass Conc. Mass
(min) (ng g−1) (µg) (ng g−1) (µg) (min) (ng g−1) (µg) (ng g−1) (µg)
Beginning 0–30 351∗ 3.3 3477.2 666.7 0–20 306.1 3611.0 2024.4 6912.5
Middle 30–60 – – 3005.2 716.5 20–35 545.0 1032.2 1426.0 9274.2
End 60–100 – – 2533.1 734.0 35–50 360.7 417.1 1280.2 6725.3
Total 3.3 2123 5060 22 912
∗This experiment only had one time interval due to the lack of sediment to analyse.
4 Discussion
This study used a series of six controlled laboratory experi-ments to assess the effect of slope gradient and rainfall inten-sity on the transport of slurry-derived compounds. This work also provided an extension to the proof of concept developed in Lloyd et al. (2012) for using fluorescence and 5β-stanols simultaneously to trace both the vertical and lateral transport of slurry-derived material in both dissolved and particulate forms.
4.1 Role of slope gradient and rainfall intensity on transport slurry-derived compounds
It was hypothesised that changes in slope gradient and rain-fall intensity would alter the relative partitioning of slope flow pathways and erosion rates which would in turn exert a strong control on the flux and yield of slurry-derived com-pounds. The impact of these variables on slurry transport can be described by two main hydrologically driven scenarios.
(1)Overland flow dominated systems, which typically
oc-cur on steep slopes and/or high rainfall intensities. High
overland flow rates typically result in high erosion rates and the combination of the two enhances transport of slurry-derived compounds via surface pathways (dissolved in runoff and bound to eroded sediment), which are rapid and interact directly with the source of applied slurry material. The con-centration of the dissolved components depends on the vol-ume of runoff produced. Higher intensity rainfall events gen-erally transported the overall largest load of slurry-derived dissolved material but the concentrations were lower. This result is supported by Delpla et al. (2011), who showed in a field study that it was the highest intensity rainfall events which generated overland flow that yielded the highest DOC export prior to cattle slurry application. Dissolved compo-nents of slurry which have been diluted by increased volumes of discharge will have a lower immediate impact on stream ecology. However, the larger total load exported during high-intensity storms will result in greater total losses of nutrients
from the soil and could result in pressures on receiving wa-ters, such as increased biological oxygen demand (BOD). It is estimated that input of cattle slurry can produce a BOD of between 10 000 and 30 000 mg L−1, leading to reduced oxy-gen levels and ultimately the death of aquatic life (Khaleel et al., 1980; Baker, 2002a; Foy and Kirk, 1995).
The concentrations of slurry-derived particulates were controlled primarily by the slope gradient, however, the over-all load increased substantiover-ally (between 1 and 3 orders of magnitude) with increased rainfall intensity due to the in-creased sediment transport by overland flow. This is sup-ported by Michaelides et al. (2012) who showed the impor-tance of erosion events on landscape nutrient loss. Although small amounts of subsurface and percolated flow occurred at the higher rainfall intensity, they do not play a key role in the transport of slurry-derived particulates. In the overland flow dominated experiment (10◦, 120 mm h−1) over 4 kg of sediment was exported (over an area of 15 m2), containing 2.3 mg of 5β-stanols in under 1 h of rainfall, compared with a total of∼9.7 mg of 5β-stanols added to the soil as slurry before the experiment. The experiment that generated less than 1 % of its discharge by overland flow (5◦, 60 mm h−1)
eroded just 14 g of sediment (3 µg 5β-stanols) during the ex-periment. Due to the rapid movement of slurry-derived ma-terial in this overland flow scenario there is little time for the slurry-derived components to transform, for example the ni-trification of NH+4 to NO−2 and NO−3 or the mineralisation of the organic fraction to more labile inorganic forms. As a re-sult, over short timescales after slurry application, the trans-ported fractions of slurry tended to reflect the original slurry composition. This result can also be expected to be observed in a field scenario where material is rapidly transported from an area of slurry application.
(2)A predominance of vertical, percolated flow, which
typ-ically occur due to low slope gradients coupled with lower
rainfall intensities.Under this regime, the export of
compared with an overland flow dominated regime due to the time needed for percolation to occur through the soil ma-trix (Kirkby, 1969). If surface runoff develops during a rain-fall event due to saturation excess, some dissolved slurry-derived material will be transported towards the slope outlet, but the concentrations will be lower than in an overland flow-dominated system. This is because a large proportion of the dissolved slurry-derived material will have already infiltrated into the subsurface in the time taken for the soil to saturate and initiate overland flow. Buda and DeWalle (2009) showed that larger storm events which caused saturation-excess over-land were responsible for flushing stored nutrients via shal-low subsurface pathways. In addition, overland fshal-low trans-ports sediment-bound components which have been shown to remain in the top layers of the soil regardless of the vol-ume of infiltration (Lloyd et al., 2012). Under systems domi-nated by infiltration and vertical percolated pathways there is a potential longer-term contamination threat to surface sedi-ment and groundwater. The percolated slurry-derived mate-rial will remain in the deeper soil layers and be available for leaching during subsequent rainfall events and potentially as-similated by the microbial community. The NH+4 is subject to nitrification resulting in increased NO−3 and the organic com-ponents will be mineralised over time to add further NO−3 to the inorganic nutrient pool. This provides a large supply of accessible nutrients for plant growth, however, if there is a surplus after plant uptake or it is leached below the root zone then these nutrients can be transported into ground-water or via deeper subsurface flows to ground-water courses (Vi-tousek et al., 2009; Burow et al., 2010; Melo et al., 2012; Morari et al., 2012), thereby posing a longer-term contami-nation threat.
Overall, we conclude that the controls on the transport of slurry-derived material (soluble and insoluble) are complex and that flow pathway partitioning induced by slope gradient, rainfall intensity, and duration play important roles. Rainfall is an important transport driver for both dissolved and partic-ulate components. Raindrop action is a well-known mecha-nism for detaching and mobilising sediment particles, but it can also act to eject soil water and therefore release solute into runoff (Gao et al., 2004). In addition, when the rainfall event acts to saturate the soil profile diffusion will occur, al-lowing diffusion to liberate chemicals from the soil matrix. Experiments run by Gao et al. (2004) showed that at the be-ginning of a rain event raindrop impact was the main mecha-nism for liberating solute, followed by diffusion at the latter stages of the storm. In addition, research has also shown that storms which have variable rainfall intensities can increase the transport of solute in surface runoff and via preferential subsurface routes (Zhang et al., 1997; Malone et al., 2004).
4.2 Use of a combined tracer approach to monitor the transport of slurry-derived material
This study also aimed to test efficacy of the use of a com-bined biomarker approach to monitor the vertical and lateral transport of dissolved and particulate slurry fractions. In the current study the transport of dissolved slurry-derived ma-terial within different flow pathways was monitored using NH+4 concentrations and fluorescence. Over short timescales (hours) NH+4 concentrations can provide useful information regarding the timing and spatial patterns of movement of dis-solved slurry compounds. Field data have shown that areas which have high N-loading, such as those treated with slurry, could receive N at a higher rate than can be incorporated into the organic fraction, resulting in inorganic-N, especially NH+4 becoming available for rapid transfer to watercourses, often via preferential flow pathways (Heathwaite and Johnes, 1996). However, within days the signal will degrade due to nitrification of NH+4 into NO−3, which would be difficult to distinguish from soil-derived N, without the use of isotopic enrichment additions.
Fluorescence spectroscopy was shown by Lloyd et al. (2012) to be a robust tracer of DOM, which was slurry-derived over short timescales and in relatively small-scale soil columns. However when this technique was applied to the more complex 3-D laboratory system the results were not as clear. While the fluorescence intensity at an excita-tion at 270 nm was not significantly different between the slurry-treated and control experiments, using the ratio be-tween 270 and 360 intensities provided a detectable signal. The ratio was able to identify smaller changes in the cence spectra which were not possible using the 270 fluores-cence intensity alone. The fluoresfluores-cence intensities recorded from the TRACE experiments were several orders of mag-nitude lower than those from the soil column experiments (Lloyd et al., 2012), due to the larger volume of rainfall added in the TRACE experiments which resulted in a signif-icantly smaller slurry : soil ratio. The slurry was only applied to the top 1 m strip of the slope and therefore the signal was rapidly diluted both by the rainfall and the additional signal from the soil-derived DOM. Furthermore, the 270:360 ratio of the slurry was calculated at 1.7, which is lower than the range cited in the literature (∼2–5) for cattle slurries (Baker, 2002a). This could be because when the slurry was collected (during April 2008), it had been a very wet spring and as a result the farm slurry store had received higher than average volumes of rainwater, potentially diluting the slurry before application.
in-tensity rainfall experiments due to the additional water being transported with the slurry. If a larger section of the slope had been treated with slurry then it is more likely that the signal could have been seen. Naden et al. (2010) showed that drainage water from field lysimeters treated with slurry could be distinguished from control experiments, even though only a small proportion of the applied slurry was thought to have been leached from the system. However, work by Old et al. (2012) showed that fluorescence differences could not be identified in storm runoff samples after an application of cat-tle slurry to undrained plots. The authors suggest that this was due to rapid absorption or microbially mediated im-mobilisation of the slurry material in the soil matrix. Baker (2002b) showed that river water samples from the UK ex-hibited 270:360 ratios of 0.37±0.41 (n=242), suggesting that cattle slurries may be difficult to detect once they are di-luted compared to the background river fluorescence. How-ever, Baker (2002b) concludes that the techniques would be able to detect cattle slurry inputs from large point sources, such as slurry tank failures.
The particulate fraction was investigated using bulk ele-mental analysis, followed by quantifying the 5β-stanol con-centrations. Soil analyses of bulk C and N were found to be generally ineffective at tracing transport pathways of slurry-derived POM. The eroded sediments from all of the exper-iments showed increases in TOC and TN values compared with the control but the source of origin of the TOC and TN cannot be identified (i.e. slurry or soil). The use of the specific biomarkers 5β-stanols provides more robust infor-mation about the transport of slurry-derived particulates as they have been shown to be an unequivocal tracer of rumi-nant slurry (Bull et al., 2002; Elhmmali et al., 2000; Ev-ershed et al., 1997; Nash et al., 2005). The concentration of the 5β-stigmastanol in the slurry used in this study was lower than other published values, with an average concen-tration of∼12 µg g−1of freeze-dried slurry, compared with ∼46 µg g−1(Leeming et al., 1996). However, there was still a large difference between the slurry concentration and the initial soil, so this did not cause any issues for using the biomarker as a tracer. On the other hand, the ratios of the 5β:5α-stanols determined in the current study were very similar to other published values, where ratios from soil cores taken from the slurry application area ranged from 2.4 to 2.9, compared with an average ratio of∼2 measured in cow ma-nures (Evershed et al., 1997). Data collected here further il-lustrate that 5β-stanols are a robust tracer of slurry-derived IOM, and therefore could be used to monitor the transport of particulate forms of slurry.
Overall, the results show that using a combination of trac-ers and biomarktrac-ers for both soluble and insoluble fractions can be very effective for tracing the movement of slurry via multiple transport pathways. This work provides a proof of concept that the methodology works in larger and more complex controlled laboratory systems. While elements of this type of methodology have been tested in field scenarios
(e.g. Naden et al., 2010; Granger et al., 2010; Evershed et al., 1997; Bull et al., 1998; Nash et al., 2005), there is still a need to test this combined tracer approach in a larger field study.
5 Conclusions
This work has provided important and new insights into flow partitioning across a range of controlled hillslope and rain-fall scenarios and has allowed quantification of the impact this has on the transport of slurry-derived compounds. Re-sults indicate that the dissolved components of slurry-derived material (traced using NH+4 and the ratio between 270:360 fluorescence intensities) were transported rapidly through the soil system, while the predominant pathway depended on the flow partitioning. When the conditions favoured surface runoff, i.e. high slope gradients and/or high rainfall intensi-ties, larger quantities of slurry-derived material were moved in the surface and subsurface flow pathways. These shallow flow pathways transport water more rapidly to the slope out-let compared with vertical percolated flow which travelled slowly through the soil matrix. The movement of slurry-derived particulates (traced using 5β-stanols) is driven ex-clusively by the erosion rates on the slope.
Rainfall events which produced flashy hydrological re-sponses, resulting in large quantities of surface runoff, were likely to move sediment and also flush dissolved components of slurry-derived material from the slope, increasing the con-tamination risk. Rainfall events which produced slower hy-drological responses were dominated by vertical percolated flows removing less sediment-associated material, but pro-duced leachate which could contaminate deeper soil layers, and potentially groundwater, over a more prolonged period.
This work has also provided one of the first examples of using multiple biomarkers to assess the effects of slope gradi-ent and rainfall intensity on the movemgradi-ent of slurry-derived OM. The results have shown that this approach can be suc-cessfully applied to more complex 3-D systems (than simple soil columns) and can yield valuable data about the interac-tions between slurry and the soil-water system. Overall, this research provides new insights into the partitioning of slurry-derived material when applied to an unvegetated slope and the transport mechanisms by which contamination risks are created.
Acknowledgements. This work was funded by NERC Studentship (NE/F008856/1) to C. E. M. Lloyd.
References
Aksoy, H., Unal, N. E., Cokgor, S., Gedikli, A., Yoon, J., Koca, K., Inci, S. B., and Eris, E.: A rainfall simulator for laboratory-scale assessment of rainfall–runoff-sediment trans-port processes over a two-dimensional flume, Catena, 98, 63–72, doi:10.1016/j.catena.2012.06.009, 2012.
Asam, Z. U., Kaila, A., Nieminen, M., Sarkkola, S., O’Driscoll, C., O’Connor, M., Sana, A., Rodgers, M., and Xiao, L. W.: Assess-ment of phosphorus retention efficiency of blanket peat buffer ar-eas using a laboratory flume approach, Ecol. Eng., 49, 160–169, doi:10.1016/j.ecoleng.2012.08.020, 2012.
Baker, A.: Spectrophotometric discrimination of river dis-solved organic matter, Hydrol. Process., 16, 3203–3213, doi:10.1002/hyp.1097, 2002a.
Baker, A.: Fluorescence properties of some farm wastes: impli-cations for water quality monitoring, Water Res., 36, 189–195, 2002b.
Barker, J. D., Sharp, M. J., and Turner, R. J.: Using synchronous fluorescence spectroscopy and principal components analysis to monitor dissolved organic matter dynamics in a glacier system, Hydrol. Process., 23, 1487–1500, doi:10.1002/hyp.7274, 2009. Berthelot, M. P. E.: Berthelot’s reaction mechanism, Report Chim
Appl., 384, p. 284, 1859.
Birdwell, J. E. and Engel, A. S.: Characterization of dissolved or-ganic matter in cave and spring waters using UV-Vis absorbance and fluorescence spectroscopy, Org. Geochem., 41, 270–280, doi:10.1016/j.orggeochem.2009.11.002, 2010.
Blanchard, P. E. and Lerch, R. N.: Watershed vulnerability to losses of agricultural chemicals: interactions of chemistry, hy-drology, and land-use, Environ. Sci. Technol., 34, 3315–3322, doi:10.1021/es991115+, 2000.
Buda, A. R. and DeWalle, D. R.: Dynamics of stream nitrate sources and flow pathways during stormflows on urban, forest and agri-cultural watersheds in central Pennsylvania, USA, Hydrol. Pro-cess., 23, 3292–3305, doi:10.1002/hyp.7423, 2009.
Bull, I. D., Van Bergen, P. F., Poulton, P. R., and Evershed, R. P.: Or-ganic geochemical studies of soils from the Rothamsted Classical Experiments – II, Soils from the Hoosfield Spring Barley Experi-ment treated with different quantities of manure, Org. Geochem., 28, 11–26, 1998.
Bull, I. D., Lockheart, M. J., Elhmmali, M. M., Roberts, D. J., and Evershed, R. P.: The origin of faeces by means of biomarker de-tection, Environ. Int., 27, 647–654, 2002.
Burow, K. R., Nolan, B. T., Rupert, M. G., and Dubrovsky, N. M.: Nitrate in groundwater of the United States, 1991–2003, Environ. Sci. Technol., 44, 4988–4997, doi:10.1021/es100546y, 2010. Chadwick, D. R. and Chen, S.: Manures, in: Agriculature,
Hydrol-ogy and Water Quality, edited by: Haygarth, P. M. and C., J. S., CAB International, Wallingford, UK, 57–82, 2003.
Chambers, B. J., Smith, K. A., and Pain, B. F.: Strategies to encour-age better use of nitrogen in animal manures, Soil Use Manencour-age., 16, 157–161, 2000.
Coelho, B. B., Lapen, D., Murray, R., Topp, E., Bruin, A., and Khan, B.: Nitrogen loading to offsite waters from liquid swine manure application under different drainage and tillage practices, Agr. Water Manage., 104, 40–50, doi:10.1016/j.agwat.2011.11.014, 2012.
CSF Evidence Team: Catchment Sensitive Farming ECSFDI Phase 1 & 2, Full Evaluation Report, London, 2011.
Delconte, C. A., Sacchi, E., Racchetti, E., Bartoli, M., Mas-Pla, J., and Re, V.: Nitrogen inputs to a river course in a heavily impacted watershed: a combined hydrochemical and isotopic evaluation (Oglio River Basin, N Italy), Sci. Total Environ., 466, 924–938, doi:10.1016/j.scitotenv.2013.07.092, 2014.
Delpla, I., Baures, E., Jung, A.-V., and Thomas, O.: Impacts of rain-fall events on runoff water quality in an agricultural environ-ment in temperate areas, Sci. Total Environ., 409, 1683–1688, doi:10.1016/j.scitotenv.2011.01.033, 2011.
Diaz, R. J. and Rosenberg, R.: Spreading dead zones and con-sequences for marine ecosystems, Science, 321, 926–929, doi:10.1126/science.1156401, 2008.
Dungait, J. A. J., Cardenas, L. M., Blackwell, M. S. A., Wu, L., Withers, P. J. A., Chadwick, D. R., Bol, R., Murray, P. J., Macdonald, A. J., Whitmore, A. P., and Goulding, K. W. T.: Advances in the understanding of nutrient dynamics and man-agement in UK agriculture, Sci. Total Environ., 434, 39–50, doi:10.1016/j.scitotenv.2012.04.029, 2012.
Durand, P., Breuer, L., and Johnes, P. J.: Nitrogen process in aquatic systems, in: The European Nitrogen Assessment: Sources, Ef-fects and Policy Perspectives, edited by: Sutton, M. A., Howard, C. M., Erisman, J. W., Billen, G., Bleeker, A., Grennfelt, P., van Grinsven, H., and Grizzetti, B., Cambridge University Press, Cambridge, 126–146, 2011.
Eastman, M., Gollamudi, A., Stampfli, N., Madramootoo, C. A., and Sarangi, A.: Comparative evaluation of phosphorus losses from subsurface and naturally drained agricultural fields in the Pike River watershed of Quebec, Canada, Agr. Water Manage., 97, 596–604, doi:10.1016/j.agwat.2009.11.010, 2010.
Edwards, A. C., Watson, H. A., and Cook, Y. E. M.: Source strengths, transport pathways and delivery mechanisms of nu-trients, suspended solids and coliforms within a small agricul-tural headwater catchment, Sci. Total Environ., 434, 123–129, doi:10.1016/j.scitotenv.2011.10.055, 2012.
Elhmmali, M. M., Roberts, D. J., and Evershed, R. P.: Combined analysis of bile acids and sterols/stanols from riverine particu-lates to assess sewage discharges and other fecal sources, Envi-ron. Sci. Technol., 34, 39–46, 2000.
Evans, D. J. and Johnes, P. J.: Physico-chemical controls on phos-phorus cycling in two lowland streams. Part 1 – The water col-umn, Sci. Total Environ., 329, 145–163, 2004.
Evershed, R. P., Bethell, P. H., Reynolds, P. J., and Walsh, N. J.: 5β
-Stigmastanol and Related 5β-Stanols as Biomarkers of
Manur-ing: Analysis of Modern Experimental Material and Assessment of the Archaeological Potential, J. Archaeol. Sci., 24, 485–495, doi:10.1006/jasc.1996.0132, 1997.
Foy, R. H. and Kirk, M.: Agriculture and water-quality – a regional study, J. Chart. Inst. Water E., 9, 247–256, 1995.
Gao, B., Walter, M. T., Steenhuis, T. S., Hogarth, W. L., and Parlange, J. Y.: Rainfall induced chemical transport from soil to runoff: theory and experiments, J. Hydrol., 295, 291–304, doi:10.1016/j.jhydrol.2004.03.026, 2004.
Guo, T., Wang, Q., Li, D., and Wu, L.: Sediment and solute transport on soil slope under simultaneous influence of rain-fall impact and scouring flow, Hydrol. Process., 24, 1446–1454, doi:10.1002/hyp.7605, 2010.
Haygarth, P. M., Wood, F. L., Heathwaite, A. L., and Butler, P. J.: Phosphorus dynamics observed through increasing scales in a nested headwater-to-river channel study, Sci. Total Environ., 344, 83–106, 2005.
Haygarth, P. M., Page, T. J. C., Beven, K. J., Freer, J., Joynes, A., Butler, P., Wood, G. A., and Owens, P. N.: Scaling up the phosphorus signal from soil hillslopes to headwater catchments, Freshwater Biol., 57, 7–25, doi:10.1111/j.1365-2427.2012.02748.x, 2012.
Heathwaite, A. L. and Johnes, P. J.: Contribution of nitro-gen species and phosphorus fractions to stream water quality in agricultural catchments, Hydrol. Process., 10,
971–983,
doi:10.1002/(sici)1099-1085(199607)10:7<971::aid-hyp351>3.0.co;2-n, 1996.
HELCOM: Eutrophication in the Baltic Sea: An integrated as-sessment of the effects of nutrient enrichment in the Baltic Sea Region, Baltic Marine Environment Protection Commission Helsinki, Finland, 2009.
Hudson, N., Baker, A., and Reynolds, D.: Fluorescence analysis of dissolved organic matter in natural, waste and polluted waters – a review, River Res. Appl., 23, 631–649, doi:10.1002/rra.1005, 2007.
Johnes, P. J. and Burt, T. P.: Water-quality trends in the windrush catchment – nitrogen speciation and sediment interactions, in: Sediment and Stream Water Quality in a Changing Environment: Trends and Explanation, IAHS Publications, Wallingford, UK, 203, 349–357, 1991.
Jones, D. L., Healey, J. R., Willett, V. B., Farrar, J. F., and Hodge, A.: Dissolved organic nitrogen uptake by plants – an impor-tant N uptake pathway?, Soil Biol. Biochem., 37, 413–423, doi:10.1016/j.soilbio.2004.08.008, 2005.
Khaleel, R., Reddy, K. R., and Overcash, M. R.: Transport of poten-tial pollutants in runoff water from land areas receiving animal wastes – a review, Water Res., 14, 421–436, 1980.
Kirkby, M. J.: Infiltration, throughflow and overland flow, in: Water, Earth and Man a Synthesis of Hydrology Geomorphology and Socio-Economic Geography, edited by: Chorley, R. J., Methuen and Co. Ltd., London, UK, 215–227, 1969.
Lakowicz, J. R.: Principles of Fluorescence Spectroscopy, Plenum, New York, 1983.
Leeming, R., Ball, A., Ashbolt, N., and Nichols, P.: Using faecal sterols from humans and animals to distinguish faecal pollution in receiving waters, Water Res., 30, 2893–2900, 1996.
Lloyd, C. E. M., Michaelides, K., Chadwick, D. R., Dun-gait, J. A. J., and Evershed, R. P.: Tracing the flow-driven vertical transport of livestock-derived organic matter through soil using biomarkers, Org. Geochem., 43, 56–66, doi:10.1016/j.orggeochem.2011.11.001, 2012.
Malone, R. W., Weatherington-Rice, J., Shipitalo, M. J., Fausey, N., Ma, L. W., Ahuja, L. R., Wauchope, R. D., and Ma, Q. L.: Her-bicide leaching as affected by macropore flow and within-storm rainfall intensity variation: a RZWQM simulation, Pest Manag. Sci., 60, 277–285, doi:10.1002/ps.791, 2004.
Melo, A., Pinto, E., Aguiar, A., Mansilha, C., Pinho, O., and Ferreira, I. M. P. L. V. O.: Impact of intensive horticulture practices on groundwater content of nitrates, sodium, potas-sium, and pesticides, Environ. Monit. Assess., 184, 4539–4551, doi:10.1007/s10661-011-2283-4, 2012.
Michaelides, K., Ibraim, I., Nord, G., and Esteves, M.: Trac-ing sediment redistribution across a break in slope usTrac-ing rare earth elements, Earth Surf. Proc. Land., 35, 575–587, doi:10.1002/esp.1956, 2010.
Michaelides, K., Lister, D., Wainwright, J., and Parsons, A .J.: Linking runoff and erosion dynamics to nutrient fluxes in a degrading dryland landscape, J. Geophys. Res., 117, G00N15, doi:10.1029/2012JG002071, 2012.
Mitsch, W. J., Day, J. W., Gilliam, J. W., Groffman, P. M., Hey, D. L., Randall, G. W., and Wang, N. M.: Reduc-ing nitrogen loadReduc-ing to the Gulf of Mexico from the Mis-sissippi River Basin: strategies to counter a persistent eco-logical problem, Bioscience, 51, 373–388, doi:10.1641/0006-3568(2001)051[0373:rnlttg]2.0.co;2, 2001.
Montenegro, A. A. A., Abrantes, J. R. C. B., de Lima, J. L. M. P., Singh, V. P., and Santos, T. E. M.: Impact of mulching on soil and water dynamics under intermittent simulated rainfall, Catena, 109, 139–149, doi:10.1016/j.catena.2013.03.018, 2013. Morari, F., Lugato, E., Polese, R., Berti, A., and Giardini, L.:
Nitrate concentrations in groundwater under contrasting agri-cultural management practices in the low plains of Italy, Agr. Ecosyst. Environ., 147, 47–56, doi:10.1016/j.agee.2011.03.001, 2012.
Naden, P. S., Old, G. H., Eliot-Laize, C., Granger, S. J., Hawkins, J. M. B., Bol, R., and Haygarth, P.: Assessment of natural fluo-rescence as a tracer of diffuse agricultural pollution from slurry spreading on intensely-farmed grasslands, Water Res., 44, 1701– 1712, 2010.
Nash, D., Leeming, R., Clemow, L., Hannah, M., Halliwell, D., and Allen, D.: Quantitative determination of sterols and other alcohols in overland flow from grazing land and possible source materials, Water Res., 39, 2964–2978, doi:10.1016/j.watres.2005.04.063, 2005.
Ohno, T.: Fluorescence inner-filtering correction for determining the humification index of dissolved organic matter, Environ. Sci. Technol., 36, 742–746, doi:10.1021/es0155276, 2002.
Old, G. H., Naden, P. S., Granger, S. J., Bilotta, G. S., Bra-zier, R. E., Macleod, C. J. A., Krueger, T., Bol, R., Hawkins, J. M. B., Haygarth, P., and Freer, J.: A novel application of natural fluorescence to understand the sources and trans-port pathways of pollutants from livestock farming in small headwater catchments, Sci. Total Environ., 417, 169–182, doi:10.1016/j.scitotenv.2011.12.013, 2012.
Osterman, L. E., Poore, R. Z., Swarzenski, P. W., Senn, D. B., and DiMarco, S. F.: The 20th-century development and expansion of Louisiana shelf hypoxia, Gulf of Mexico, Geo-Mar. Lett., 29, 405–414, doi:10.1007/s00367-009-0158-2, 2009.
Peuravuori, J., Koivikko, R., and Pihlaja, K.: Characterization. dif-ferentiation and classification of aquatic humic matter separated with different sorbents: synchronous scanning fluorescence spec-troscopy, Water Res., 36, 4552–4562, 2002.
Pretty, J. N., Brett, C., Gee, D., Hine, R. E., Mason, C. F., Morison, J. I. L., Raven, H., Rayment, M. D., and van der Bijl, G.: An as-sessment of the total external costs of UK agriculture, Agr. Syst., 65, 113–136, doi:10.1016/s0308-521x(00)00031-7, 2000. Quemada, M., Baranski, M., Nobel-de Lange, M. N. J., Vallejo,
A., and Cooper, J. M.: Meta-analysis of strategies to con-trol nitrate leaching in irrigated agricultural systems and their effects on crop yield, Agr. Ecosyst. Environ., 174, 1–10, doi:10.1016/j.agee.2013.04.018, 2013.
Rozemeijer, J. C. and Broers, H. P.: The groundwater contribution to surface water contamination in a region with intensive agricul-tural land use (Noord-Brabant, the Netherlands), Environ. Pol-lut., 148, 695–706, doi:10.1016/j.envpol.2007.01.028, 2007. Sutton, M. A.: The European Nitrogen Assessment: Sources,
Ef-fects, and Policy Perspectives, Cambridge University Press, Cambridge, 612 pp., 2011.
van Bergen, P. F., Bull, I. D., Poulton, P. R., and Evershed, R. P.: Or-ganic geochemical studies of soils from the Rothamsted classical experiments – I. Total lipid extracts, solvent insoluble residues and humic acids from Broadbalk wilderness, Org. Geochem., 26, 117–135, 1997.
Vinolas, L. C., Healey, J. R., and Jones, D. L.: Kinetics of soil mi-crobial uptake of free amino acids, Biol. Fert. Soils, 33, 67–74, doi:10.1007/s003740000291, 2001.
Vitousek, P. M., Naylor, R., Crews, T., David, M. B., Drinkwater, L. E., Holland, E., Johnes, P. J., Katzenberger, J., Martinelli, L. A., Matson, P. A., Nziguheba, G., Ojima, D., Palm, C. A., Robertson, G. P., Sanchez, P. A., Townsend, A. R., and Zhang, F. S.: Nutrient imbalances in agricultural development, Science, 324, 1519–1520, doi::10.1126/science.1170261, 2009.
Willett, V. B., Reynolds, B. A., Stevens, P. A., Ormerod, S. J., and Jones, D. L.: Dissolved organic nitrogen regulation in freshwa-ters, J. Environ. Qual., 33, 201–209, 2004.