www.adv-geosci.net/35/55/2013/ doi:10.5194/adgeo-35-55-2013
© Author(s) 2013. CC Attribution 3.0 License.
Advances in
Geosciences
Geoscientiic
Geoscientiic
Geoscientiic
Geoscientiic
Simulating river discharge in a snowy region of Japan using output
from a regional climate model
X. Ma1, H. Kawase1, S. Adachi1, M. Fujita1, H. G. Takahashi1,2, M. Hara1, N. Ishizaki1, T. Yoshikane1, H. Hatsushika3, Y. Wakazuki4, and F. Kimura1
1Research Institute for Global Change, Japan Agency for Marine-Earth Science and Technology, Kanagawa, Japan 2Department of Geography, Tokyo Metropolitan University, Tokyo, Japan
3Toyama Prefectural Environmental Science Research Center, Toyama, Japan
4Graduate School of Life and Environmental Sciences, University of Tsukuba, Ibaraki, Japan
Correspondence to:X. Ma ([email protected])
Received: 9 February 2013 – Revised: 8 June 2013 – Accepted: 11 June 2013 – Published: 2 July 2013
Abstract. Snowfall amounts have fallen sharply along the eastern coast of the Sea of Japan since the mid-1980s. Toyama Prefecture, located approximately in the center of the Japan Sea region, includes high mountains of the north-ern Japanese Alps on three of its sides. The scarcity of me-teorological observation points in mountainous areas limits the accuracy of hydrological analysis. With the development of computing technology, a dynamical downscaling method is widely applied into hydrological analysis. In this study, we numerically modeled river discharge using runoff data derived by a regional climate model (4.5-km spatial reso-lution) as input data to river networks (30-arcseconds res-olution) for the Toyama Prefecture. The five main rivers in Toyama (the Oyabe, Sho, Jinzu, Joganji, and Kurobe rivers) were selected in this study. The river basins range in area from 368 to 2720 km2. A numerical experiment using cli-mate comparable to that at present was conducted for the 1980s and 1990s. The results showed that seasonal river dis-charge could be represented and that disdis-charge was generally overestimated compared with measurements, except for Oy-abe River discharge, which was always underestimated. The average correlation coefficient for 10-year average monthly mean discharge was 0.8, with correlation coefficients rang-ing from 0.56 to 0.88 for all five rivers, whereas the Nash-Sutcliffe efficiency coefficient indicated that the simulation accuracy was insufficient. From the water budget analysis, it was possible to speculate that the lack of accuracy of river discharge may be caused by insufficient accuracy of precipi-tation simulation.
1 Introduction
In Japan, snowfall amounts have fallen sharply in some gions. The Japan Meteorological Agency (JMA, 2005) re-ported that annual maximum snow depth has significantly decreased since the peak was from early 1980s through 1990. Although a slight upward trend has been observed since then, snowfall levels remain much lower than those in the early 1980s. This downward trend can be attributed mainly to a dramatic rise in mean winter temperatures in northern and western Japan since the mid-1980s, resulting in a noticeable decrease in river discharge in spring (Ma et al., 2010). More-over, snowfall amounts have been predicted to decrease fur-ther in all of Japan’s regions except Hokkaido, under a sce-nario in which temperatures rise by 2.8◦C by the end of the
21st century (JMA, 2008).
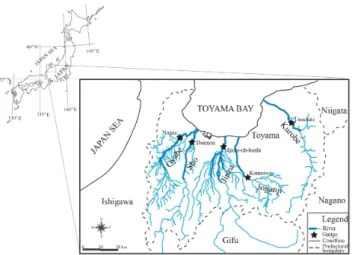
Fig. 1.Location of Toyama Prefecture and its main five rivers.
Haberlandt, 1999; Wood et al., 2004; Weber et al., 2010). The Weather Research and Forecasting (WRF; http://www.mmm. ucar.edu/wrf/users/) model, one of the regional climate mod-els supported by the National Center for Atmospheric Re-search (NCAR), has many users and is freely available for community use. A land-surface scheme is included in the WRF model to simulate the runoff for each grid. Therefore, it is practicable for river discharge modeling using the runoff data with a river routing process. Kawase et al. (2012) re-ported the maximum snow depth could be accurately simu-lated using the WRF model over the Hokuriku District, in-cluding the Toyama region in the late 20th century. However, the hydrological analysis using the WRF model output has never been examined.
In this study, we conducted a numerical investigation of river discharge by downscaling data derived from the WRF model to 4.5-km resolution, instead of using station data. Five main rivers in Toyama (Oyabe, Sho, Jinzu, Joganji, and Kurobe rivers) were selected for this study. A 20-year-long numerical experiment, intended to reproduce the current cli-mate, was carried out for the 1980s and 1990s to verify model performance in this area.
2 Study area and model setting
Toyama Prefecture (4247 km2 in area, Fig. 1), located ap-proximately at the center of the Sea of Japan coast, in-cludes high mountains of the northern Japanese Alps on three of its sides. The topographic relief is greater than 3000 m, and the monthly mean temperature and total precipitation in January–February are approximately 2.7◦C and 600 mm,
re-spectively. The entire prefecture is part of the heavy snow-fall region along the Sea of Japan. Toyama’s rich natural en-vironment includes areas of sea, mountain, river, and plain, with four clear seasons and abundant plant and animal life. Rain and snowfall in the mountains deliver rich, clean water
50N
45N
40N
35N
30N
25N
120E 125E 130E 135E 140E 145E 150E
a)
b)
Fig. 2.Domains of the WRF model:(a)the parent domain (in 18-km spatial resolution);(b)the inner domain (in 4.5-km spatial res-olution).
throughout the year, supporting the industry and lifestyle of Toyama.
The WRF model is a mesoscale numerical weather pro-jection system designed to serve both operational forecast-ing and atmospheric research needs. The model uses fully compressible, nonhydrostatic equations. We used the Ad-vanced Research WRF (ARW) version 3.2.1 (Skamarock et al., 2008) with a two-way nesting technique and the WRF single-moment six-class microphysics scheme (Hong and Lim, 2006). In this version, the Noah land-surface model (Chen and Dudhia, 2001) is adopted to simulate the land-surface process. The output variables from the WRF model are over one hundred including downward longwave and shortwave fluxes at the ground surface, surface air pressure, accumulated total grid-scale precipitation, surface air tem-perature, wind speed at 10 m height, etc. Two components of runoff, namely, subsurface and surface runoff, are calculated for one grid without the river-routing process. In this study, we used the WRF model with dynamic downscaling to sim-ulate runoff data as input variables for a river-routing model. The calculation domain of WRF was set to two levels. The parent domain was set to a wide area, between 25–50◦N and
115–155◦E on an 18-km grid. The inner domain was located
in a smaller area between 35.25–37.5◦N and 136.25–139◦E
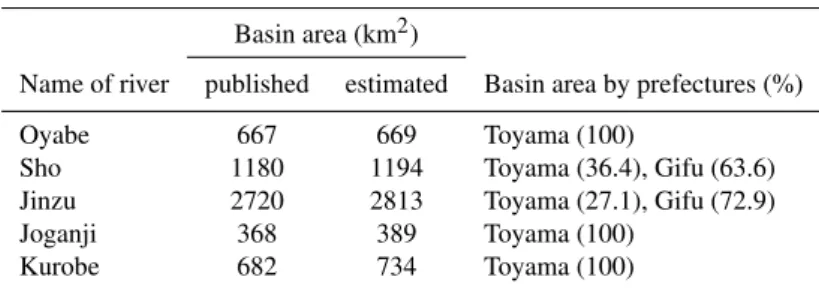
Table 1.Published and estimated river basin area of the five rivers in Toyama Prefecture.
Basin area (km2)
Name of river published estimated Basin area by prefectures (%)
Oyabe 667 669 Toyama (100)
Sho 1180 1194 Toyama (36.4), Gifu (63.6)
Jinzu 2720 2813 Toyama (27.1), Gifu (72.9)
Joganji 368 389 Toyama (100)
Kurobe 682 734 Toyama (100)
Table 2.Ten-year average runoff (mm) and relative error between observations (ob) and estimations (ca) for the five rivers.
Gauge (catchment area, km2) River 1980s 1990s error (%)
ob ca ob ca 1980s 1990s
Nagae (606) Oyabe 2872 1772 2840 1633 −44.7 −47.8
Daimon (1184) Sho 1030 2641 984 2484 201.6 176.0
Jinzu-oh-hashi (2786) Jinzu 2175 2454 2116 2325 17.2 14.0
Kameiwa (363) Joganji 1393 4670 1763 4462 283.4 180.2
Unaduki (677) Kurobe 1754 3837 1247 3608 256.2 265.6
Table 3.Correlation coefficients (CC) and Nash-Sutcliffe efficiency coefficients (NC) of monthly mean discharges for the five rivers in the 1980s and 1990s.
Oyabe Sho Jinzu Joganji Kurobe
CC NC CC NC CC NC CC NC CC NC
1980s 0.76 −1.45 0.51 −3.35 0.74 −0.14 0.72 −9.44 0.65 −1.28
1990s 0.44 −2.52 0.41 −5.20 0.80 0.28 0.77 −3.85 0.60 −4.61
Channelized river flow is simulated by a river-routing model, part of the Soil-Vegetation-Atmosphere Trans-fer and Hydrological Cycle (SVAT&HYCY; Ma et al., 2000) model. Here, river routing is designed as lin-ear. That is, water flow is given a constant velocity in the channel system. The river networks for the Oyabe, Sho, Jinzu, Joganji, and Kurobe rivers were constructed using the GTOPO30 dataset (http://eros.usgs.gov/#/Find Data/Products and Data Available/gtopo30 info) with 30-arcseconds resolution. The estimated basin areas are shown in Table 1 and are close to the reported values.
The sum of both subsurface and surface runoff calculated by the WRF on a 4.5-km grid was redistributed onto the river network system on a 30-arcseconds grid, and the river rout-ing was conducted from upstream to downstream. In consid-eration of the mountainous topography, the velocity of the river flow was set at 0.6 m s−1(Ma et al., 2010). The effect
of dams was not considered in this study.
The WRF model was run for hydrological years spanning from 1 July of the “previous” year to 31 July of the “current” year. Taking into account the initial effects, the first month was considered the spin-up period of the model, and the re-maining period was used for the analysis.
Daily discharge data for the five rivers are available from the Japan River Association. River flow was measured in a hydrological year from August of the previous year to July of the current year to avoid snow pack.
3 Results and discussion
In Kawase et al. (2012), interannual variation in regional mean maximum snow depth and its drastic decrease from the late 1980s were well simulated in the control run for present climate compared to JMA station data. In this study, the model performance was checked for past river discharge us-ing the runoff output data for the 1980s (from August 1980 to July 1990) and 1990s (from August 1990 through July 2000) at the Nagae (Oyabe River), Daimon (Sho River), Jinzu-oh-hashi (Jinzu River), Kameiwa (Joganji River), and Unaduki (Kurobe River) gauge stations.
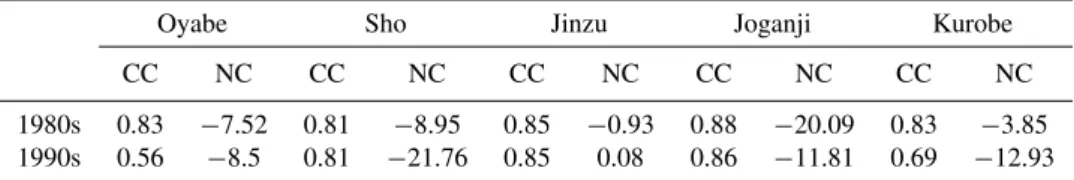
Table 4.Correlation coefficients (CC) and Nash-Sutcliffe efficiency coefficients (NC) of 10-year average monthly mean discharges for the five rivers in the 1980s and 1990s.
Oyabe Sho Jinzu Joganji Kurobe
CC NC CC NC CC NC CC NC CC NC
1980s 0.83 −7.52 0.81 −8.95 0.85 −0.93 0.88 −20.09 0.83 −3.85
1990s 0.56 −8.5 0.81 −21.76 0.85 0.08 0.86 −11.81 0.69 −12.93
Table 5. Simulated basin average precipitation (Prec.), runoff (R ca.) and their different (Loss) for the five river basins in the 1980s and 1990s (unit: mm).
River 1980s 1990s
Prec. R ca. Loss Prec. R ca. Loss
Oyabe 2538 1772 766 2451 1633 818
Sho 3407 2641 766 3292 2484 808
Jinzu 3101 2454 647 2998 2325 673
Joganji 5110 4670 440 4907 4462 445 Kurobe 4319 3837 482 4202 3608 594
Oyabe River with a range of−44 % to−48 % through two decades. The calculated monthly mean discharges were com-pared with observations over time; the correlation coeffi-cients ranged from 0.41 to 0.80 (Table 3), with an average of 0.64, for all rivers in the 1980s and 1990s. In the comparison of 10-year average monthly mean discharges, the correlation coefficients were clearly improved. The average correlation coefficient was increased to 0.80 and the range of correlation coefficients was from 0.56 to 0.88 (Table 4).
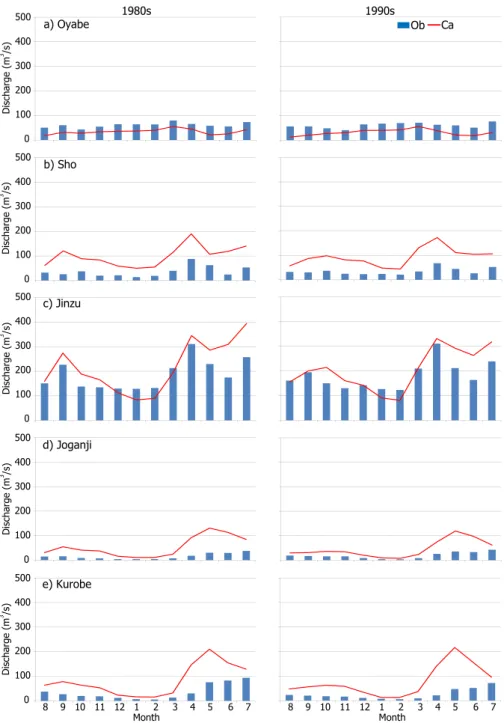
Figure 3 depicts the representative river discharge in the 1980s and 1990s. In general, the simulations were overes-timated compared with observations, except for the Oyabe River, where discharge was underestimated throughout the two decades. The seasonal variation was represented well. Discharge was lower in winter (December to March) and higher in spring and early summer (April to July) in both the 1980s and 1990s except in the Oyabe River. The results in-dicated that the simulations are affected by terrain, underes-timated for the Oyabe located in the western part of Toyama, and overestimated in the remaining area. The relative errors for the Jinzu River, which has the largest basin area, were slightly smaller than those for the other rivers. There were maximum differences of 4675 mm in 1999 in the Joganji River and 3522 mm in 1988 in the Kurobe River.
The Nash-Sutcliffe efficiency coefficient (Nash and Sut-cliffe, 1970) is used to evaluate the hydrological modeling. The values are ranged from 1 (perfect match of calculated discharge to that of observed one) to minus infinity. An effi-ciency of 0 indicates that the model can simulate an average discharge. The negative value shows that there is a big dif-ference between the simulated and observed discharges. In
this study, the high value for monthly mean discharge was obtained in the Jinzu River, ranged from 0.28 for the 1990s to−0.14 for the 1980s (Table 3). On the other hand, it also indicated that the simulation accuracy for other rivers was insufficient. A comparative summary of the 10-year annual runoff between the calculations and observations is shown in Table 4.
Simulated river basin average annual precipitations of the five rivers are listed in Table 5. The difference between the precipitation and runoff for each river presents the water loss on evapotranspiration and shows in a normal range for this region (about 500 mm, Ma et al., 2010), namely, the land-surface model used in the WRF had a rational performance. It is possible to speculate that the lack of accuracy of river discharge may be caused by insufficient accuracy of precip-itation simulation. A low precipprecip-itation over the Oyabe basin results the underestimation of river discharge and it is contary in other river basins.
4 Conclusions
Toyama Prefecture is one of heavy snowfall regions in Japan. The monthly mean temperature and total precipitation in the period of January–February are around 2.7◦C and 600 mm,
respectively. A numerical investigation of river discharge was conducted using runoff data derived by the WRF model (4.5-km grid) and a linear river-routing model (approximately 30 arcseconds). The model performance was evaluated for the main five rivers in Toyama Prefecture, which have basin ar-eas ranging from 363 to 2786 km2.
Using the climate of the 1980s and 1990s, the simulations overestimated river discharge compared to observations, ex-cept for the Oyabe River. However, the seasonal variation was reproduced, with low discharge in winter (December to February) and high discharge in spring and early summer (March to July) in both the 1980s and 1990s.
Ob Ca 1980s 1990s
a) Oyabe
b) Sho
c) Jinzu
d) Joganji
e) Kurobe 500
400
300
200
100
0
500
400
300
200
100
0
500
400
300
200
100
0
500
400
300
200
100
0
500
400
300
200
100
0
Discharge (m
3 /s)
Discharge (m
3 /s)
Discharge (m
3 /s)
Discharge (m
3 /s)
Discharge (m
3 /s)
Month Month
8 9 10 11 12 1 2 3 4 5 6 7 8 9 10 11 12 1 2 3 4 5 6 7
Fig. 3.Comparison of 10-year monthly mean discharge from observations and simulations for the five rivers in the 1980s and 1990s:
(a)Oyabe River,(b)Sho River,(c)Jinzu River,(d)Joganji River, and(e)Kurobe River. (Ob: Observed discharge; Ca: Calculated discharge).
and 1990s. For the Jinzu River, discharge calculations for both the 1980s and 1990s agreed well with measured values. The calculated monthly mean discharges had average cor-relation coefficients ranging from 0.64 to 0.80 for all rivers in the 10-year-long time series and the 10-year average series. However, most of the Nash-Sutcliffe efficiency coefficients were lower than zero, showing the simulation accuracy of river discharge was insufficient. Acorrding to the water bud-get analysis, it was suggested that the accuracy of precipita-tion simulaprecipita-tion must be improved.
Acknowledgements. This research was supported by the Research Program on Climate Change Adaptation of the Ministry of Educa-tion, Culture, Sports, Science and Technology, Japan.
Edited by: K. Tokeshi
Reviewed by: two anonymous referees
References
Chen, F. and Dudhia, J.: Coupling an advanced land surface-hydrology model with the Penn State-NCAR MM5 modeling system. Part I: model implementation and sensitivity, Mon. Wea. Rev., 129, 569–585, 2001.
Hong, S. Y. and Lim, J. O. J.: The WRF singlemoment 6-class mi-crophysics scheme (WSM6), J. Korean Meteor. Soc., 42, 129– 151, 2006.
Japan Meteorological Agency (JMA): Report on Climate Change 2005, JMA, Tokyo, 57 pp., 2005 (in Japanese).
Japan Meteorological Agency (JMA): Global Warming Projection Vol.7, JMA, Tokyo, available at: http://ds.data.jma.go.jp/tcc/tcc/ products/gwp/gwp7/index-e.html, 2008.
Kawase, H., Yoshikane, T., Hara, M., Fujita, M., Ishizaki, N. N., Kimura, F., and Hatsushika, H.: Downscaling of snow cover changes in the late 20th Century using a past climate simulation method over Central Japan, Sci. Online Lett. Atmos., 8, 61–64, doi:10.2151/sola.2012-016, 2012.
Kite, G. W. and Haberlandt, U.: Atmospheric model data for macroscale hydrology, J. Hydrol., 217, 303–313, doi:10.1016/S0022-1694(98)00230-3, 1999.
Ma, X., Fukushima, Y., Hiyama, T., Hashimoto, T., and Ohata, T.: A macro-scale hydrological analysis of the Lena River basin, Hydrol. Process., 14, 639–651, doi:10.1002/(SICI)1099-1085(20000228)14:3<639::AID-HYP959>3.0.CO;2-0, 2000.
Ma, X., Yoshikane, T. Hara, M. Wakazuki, Y., Takahashi, H. G., and Kimura, F.: Hydrological response to future climate change in the Agano River basin, Japan, Hydrol. Res. Lett., 4, 25–29, doi:10.3178/HRL.4.25, 2010.
Nash, J. and Sutcliffe, J.: River flow forecasting through conceptual models part I – A discussion of principles, J. Hydrol., 10(3), 282– 290, doi:10.1016/0022-1694(70)90255-6, 1970.
Skamarock, W. C., Klemp, J. B., Dudhia, J., Gill, D. O., Barker, D. M., Duda, M. G., Huang, X.-Y., Wang, W., and Powers, J. G.: A description of the Advanced Research WRF version 3, NCAR, Boulder, CO., NCAR/TN-475, 113 pp., 2008.
Weber, M., Braun, L., Mauser, W., and Prasch, M.: Contribution of rain, snow- and icemelt in the Upper Danube discharge today and in the future, Geografia Fisica e Dinamica Quaternaria, 33, 221–230, 2010.