Sediment transport in runoff on rugous soil surface submitted
to simulated rainfall
Ildegardis Bertol
1*; Wilson Antonio Zoldan Junior
1; Antonio Paz González
2; Fabrício
Tondello Barbosa
1; Romeu de Suza Werner
11
UDESC – Depto. de Solos e Recursos Naturais – C.P. 281 – 88520-000 – Lages, SC – Brasil. 2
Universidade da Coruña – Edafologia y Química Agrícola – 15071 – La Coruña – Espanha. *Corresponding author <[email protected]>
ABSTRACT: Soil management influences water erosion and sediment size in runoff. With the objective of quantifying sediments in runoff and their relation to runoff velocity (Rv), random roughness (RR), and Ir index, this experiment was carried out from 2003 to 2006, on a typical Hapludox with the following soil management systems submitted to chiseling: i) bare soil with plowing+two disking tillage (BSC); ii) plowing+two disking tillage (CTC); iii) no tillage with crop residues burned (BNTC); and iv) traditional no-tillage (TNTC). CTC, BNTC and TNTC treatments were cultivated with crop rotation and the BSC treatment was not cultivated. Five simulated rainfall tests were applied, with intensity of 64 mm h–1
and duration of 20, 30, 40, 50 and 60 min. RR was influenced by the residual effect of soil management and by simulated rainfall, and affected the Rv in the three initial rainfall tests. Sediments carried by runoff were influenced by soil management and by simulated rainfall. Most of the sediments were in the size range from 0.5 to > 2 mm, with a higher quantity of fine sediment in BNTC and TNTC treatments than in the other treatments. The D50 index of sediments changed with soil management system and with rainfall tests, decreasing with the increase of the RR and increasing with the increment of Rv and Ir index.
Key words: water erosion, chiseling, no-till, sediment D50 index
Sedimentos transportados na enxurrada em superfície de solo
rugosa submetida à chuva simulada
RESUMO: O manejo do solo influencia a erosão hídrica e o tamanho de sedimentos na enxurrada. Com o objetivo de quantificar os sedimentos na enxurrada e relacioná-los com sua velocidade (Ve), com a rugosidade (RR) e com o índice Ir, conduziu-se este estudo entre 2003 e 2006, em um Nitossolo, sob sistemas de manejo do solo submetidos a uma escarificação: i) solo descoberto com aração e duas gradagens (SCE); ii) aração e duas gradagens (PCE); iii) semeadura direta em solo nunca preparado e com resíduos queimados (SQE); e iv) semeadura direta tradicional (STE). Os tratamentos PCE, SQE e STE foram cultivados com rotação de culturas e o SCE não foi cultivado. Foram aplicados cinco testes de chuva simulada, com intensidade constante de 64 mm h–1
e durações de 20, 30, 40, 50 e 60 minutos cada um. A RR foi influenciada pelo efeito residual do manejo do solo e pelas chuvas simuladas e afetou a Ve nos três testes iniciais de chuva. Os sedimentos transportados pela enxurrada foram influenciados pelo manejo do solo e pelas chuvas simuladas; tais sedimentos ocorreram em maior quantidade no tamanho entre 0,5 e > 2 mm do que nos tamanhos menores, com maior quantidade de sedimentos menores nos tratamentos SQE e STE do que nos demais tratamentos. O índice D50 dos sedimentos variou com o manejo do solo e com os testes de chuva, diminuindo com o incremento de RR e aumentando com o incremento de Ve de Ir.
Palavras-chave: erosão hídrica, escarificação, semeadura direta, índice D50 dos sedimentos
Introduction
It is important to know the quantity and sediment size distribution eroded by runoff, as well as their re-lation to soil surface roughness and runoff parameters, in order to select soil management systems and soil conservative practices. Long-term soil cultivation with intensive mechanical mobilization increases the amount of disaggregated sediments and their disposal for runoff, while a reduced mobilization decreases the amount of those sediments (Bertol et al., 2008; Cogo et al., 1983; Engel et al., 2009; Leite et al., 2004; Sadeghi et al., 2007).
cover of crop residue, which adds organic matter to the soil surface (Bertol et al., 2004). The resultant conditions of those management practices can modify the soil sur-face, especially in relation to roughness and quantity and size of desegregated sediments (Bertol et al., 2008; Panuska et al., 2008; Zoldan Júnior et al., 2008). These conditions affect water erosion differently (Bertol et al., 2008; Sadeghi et al., 2007), and its potential to transport sediments (Bertol et al., 1997; Engel et al., 2009).
The roughness stability also differs when the soil is submitted to a till practice and of soils cropped for a long period of time influence the quantity and size of sediments transported by runoff. Chiseling is an impor-tant soil till operation to increase soil surface roughness (Bertol et al., 2008; Cogo et al., 1983). Thus, this research quantified sediments transported in runoff under differ-ent soil managemdiffer-ent systems after six and half years, and studied the effect of chisel till operations on the surface soil and runoff characteristics.
Material and Methods
This research was carried out from 2003 to 2006 in Santa Catarina State, Brazil, on a site located at latitude 28º56’ S, longitude 51º09’ W. The climate is humid sub-tropical (Cfb) according to Köppen’s classification; the soil a clayey loamy Hapludox, with 680 g kg–1 of clay, 210 g kg–1 of sand, 110 g kg–1 of silt, 2.8 g cm–3 of particle
density and 32 g kg–1 of total organic carbon in the 0-0.2
m soil layer (Zoldan Júnior et al., 2008).
The experimental unit was made up of plots, with 3.5 m wide and 11 m long installed up-and-down the slope. The plots were framed by galvanized sheets (0.2 m high) put 0.1 m into the soil. A runoff-collector gutter was placed at the lower boundary, which was connected by a tube that, after collect, canalized the runoff to be collection 6 m below the plot. The slope of the plots ranged from 0.13 to 0.21 m m–1.
The treatments, with two replicates, consisted of four soil management systems conducted for 5.5 years as following - i) bare soil with one plowing (0.2 m depth) + two disking (0.15 m depth) up-and-down the slope, twice a year with additional manual weeding and chis-eling, in order to maintain soil surface weed free and with no crust throughout time, without crop (BS); ii) one plowing (0.2 m) + two disking (0.15 m) twice a year; the residues were incorporated into the soil and oat resi-dues were maintained on the soil surface for the last 6 months (CT); iii) no-till on natural grassland area culti-vated without soil till; residues were burned (NTB); and iv) continuous no-till after one conventional till at the establishment of the area named traditional no till; resi-dues were maintained on the soil surface (TNT). Crop sequences of oat (Avena sativa), soybean (Glycine max), vetch (Vicia sativa), maize (Zea mays), oat, bean (Phaseollus vulgaris), fodder radish (Raphanus sativus), soybean, vetch, maize and oats were cultivated in CT, NTB and TNT treatments for 5.5 years. Oat residues
were removed from the plots in the CT and TNT treat-ments and were burned in NTB treatment in January, 2006, prior to soil chiseling. One day after these opera-tions, a chiseling was carried out on all treatments, when soil had good friability, and adequate water content. The chisel plough equipment had 13 tines (0.25 m between each other), working 0.18 m into the soil. So, the previ-ous BS, CT, NTB and TNT treatments were then named BSC, CTC, NTBC and TNTC, respectively.
A rotating-boom rainfall simulator was used in this research, operating at a constant rainfall intensity and covering simultaneously two plots, 3.5 m apart from each other. The rotating-boom operated on 3.5 m inter-val between the two plots, according to Swanson’s rec-ommendation (1965). The following rainfall simulation tests (with 64 mm h–1 intensity) were applied: - test 1,
January 12, 2006, for 20 minutes, one day after the soil chiseling; test 2, for 30 minutes, applied four days after test 1; test 3, for 40 minutes, applied seven days after test 2; test 4, for 50 minutes, applied nine days after test 3; and test 5, for 60 minutes, applied six days after test 4. The rainfall intensity of 64 mm h–1 is a critical intensity
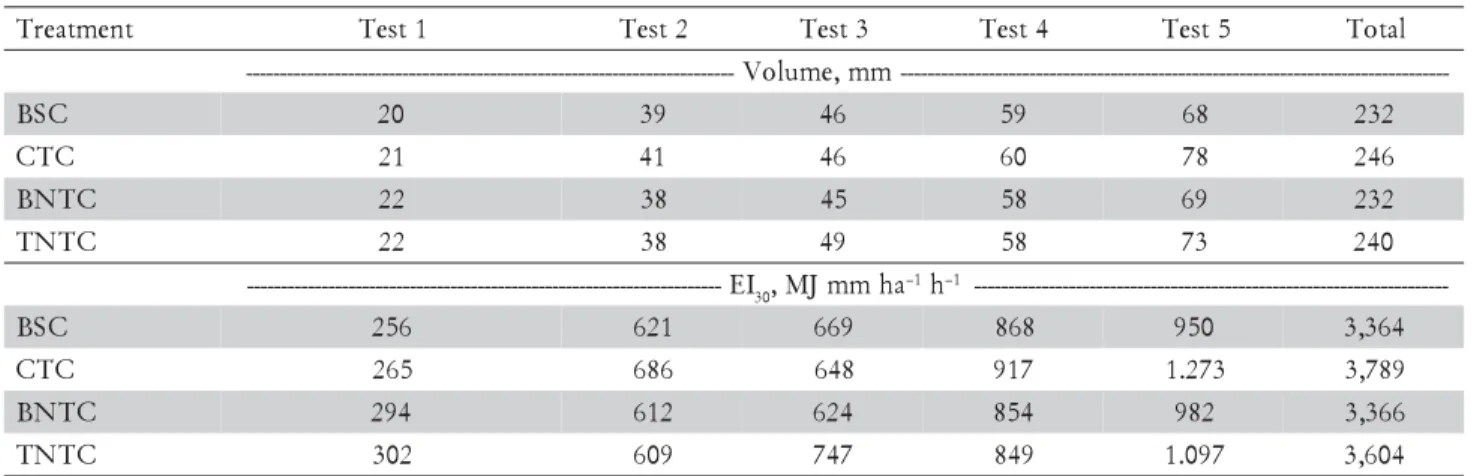
for this region; consequently, it is recommended for a soil water erosion study. Rainfall simulated volume and erosivity are shown in Table 1. The natural rainfall dur-ing the experiment period was of 57 mm between tests 2 and 3, 21 mm between tests 3 and 4, and 30 mm be-tween tests 4 and 5.
The soil surface roughness was evaluated immediately before each simulated rainfall test, using equipment with 20 aluminum sticks of 600 mm length, diameter of 8 mm, disposed 30 mm from each other along a level support, in which a digital camera was connected 1.80 m from the sticks (more details in Zoldan Júnior et al., 2008). Rough-ness index was calculated by the standard deviation of soil surface height data with no transformation and no elimi-nation of extreme values, according to the method pro-posed by Kamphorst et al. (2000). Runoff velocity was measured using a 2% methylene blue-based solution ap-plied on the surface flow, at 6 m intervals in the interme-diate position of each experimental plot.
Sediments transported in the runoff were collected 10 min before the end of each simulated rainfall, sepa-rating into different sizes using, a set of sieves with 2; 1; 0.5 and 0.25 mm installed inside a 2.5 L container, col-lecting the flow for 30 s until it was completely full. In the laboratory, the collected material was passed through an additional set of sieves with 0.125; 0.053, and 0.038 mm, to separate the following sediment size classes: > 2; 1 2; 0.5 1; 0.25 0.5; 0.125 0.25; 0.053 -0.125; 0.038 - 0.053; and < 0.038 mm, according to pro-cedure described by Bertol et al. (2006). After wards, the D50 index of sediments was calculated using the proce-dure adopted by Gilley et al. (1987).
sur-face roughness and runoff velocity (Bertol et al., 2008; Cogo et al., 1983), among other factors, which justifies the formulation of that index.
The effect of the treatments was tested through vari-ance analysis, considering a split-plot model, using treat-ments as a main factor and time as a secondary factor. The differences between means were compared by T test (p < 0.05). The D50 index of sediments was related to the Ir index, by a y=axb model, and the D
50 index of
sediments was related to the soil surface random rough-ness and to the runoff velocity, by a y=a+bx model.
Results and Discussion
Soil surface roughness and runoff velocity
The soil management systems in cropped treatments (TNTC, BNTC and CTC) had surface roughness
val-ues 61% higher than the bare soil and the treatment with-out crop systems (BSC), on the average of treatments and rainfall tests (Table 2). This result demonstrates the im-portance of the soil crop to conserve physical proper-ties related to soil aggregation, independent of the soil management system. A negative correlation between soil surface random roughness decay and water aggre-gate stability (MWD and GMD) in the 0-0.1 m layer of an Inceptisol was found by Bertol et al. (2006). Further-more, physically-desegregated soils had lower surface roughness than those better structured, as observed by Zoldan Júnior et al. (2008).
Although TNTC treatment showed a similar surface roughness in relation to CTC treatment (p < 0.05 - Table 2), there was an addition of 17% in TNTC roughness (p < 0.2), in comparison with the CTC treatment, on the average of the rainfall tests. This is an important
in-Table 1 – Simulated rainfall volume and erosivity (EI30), applied after the chiseling operation.
BSC: bare soil with plowing+double disking tillage without crop soil; CTC: plowing+double disking tillage; BNTC: no-tillage in a never tilled soil and with residues burned; TNTC: traditional no-tillage (CTC, BNTC and TNTC, tillage with crop soil).
t n e m t a e r
T Test1 Test2 Test3 Test4 Test5 Total
-m m , e m u l o V -C S
B 20 39 46 59 68 232
C T
C 21 41 46 60 78 246
C T N
B 22 38 45 58 69 232
C T N
T 22 38 49 58 73 240
I E
-- 30,MJmmha–1h–1 ---------------------------------------------------------------------
-C S
B 256 621 669 868 950 3,364
C T
C 265 686 648 917 1.273 3,789
C T N
B 294 612 624 854 982 3,366
C T N
T 302 609 747 849 1.097 3,604
Table 2 – Soil surface random roughness determined immediately before each simulated rainfall, and runoff velocity determined during the simulated rainfall after the chiseling operation.
BSC: bare soil with plowing + double disking tillage without crop soil; CTC: plowing + double disking tillage; BNTC: no-tillage in a never tilled soil and with residues burned; TNTC: traditional no-tillage (CTC, BNTC and TNTC, tillage with crop soil). Means followed by the same letters not differ (T test, p < 0.05). Upper case letters in column and lower case letters in line. CV: coefficient of variation. t n e m t a e r
T Test1 Test2 Test3 Test4 Test5 Mean CV
-m m , s s e n h g u o R --- % C S
B 8.19Ba 7.55Ba 5.11Ba 5.63Aa 9.56Aa 7.22B 24.76
C T
C 14.94Aa 12.02Aab 9.61ABab 9.40Aab 8.46Ab 10.78A 20.42
C T N
B 15.07Aa 13.89Aa 10.65ABb 9.49Ab 8.70Ab 11.56A 10.87
C T N
T 17.55Aa 12.91Aab 11.89Aab 11.19Aab 9.40Ab 12.60A 20.31
) % ( V
C 12.60 13.27 21.95 27.00 24.41 -
-s m , y t i c o l e v f f o n u R
---- –1 --------------------------------------------------------
--C S
B 0Ac 0Ac 0.25Ab 0.26Ab 0.31Aa 0.27A 5.45
C T
C 0Ad 0Ad 0.17Bc 0.27Ab 0.33Aa 0.26A 10.61
C T N
B 0Ad 0Ad 0.12Cc 0.14Bb 0.19Ba 0.15B 6.30
C T N
T 0Ad 0Ad 0.05Dc 0.06Cb 0.10Ca 0.07C 2.61
) % ( V
-crease in the surface water storage capacity in no-till-age in relation to conventional tillno-till-age, when both are scarified by a chisel operation. Probably, that differ-ence (p < 0.2) was due to a better soil structure in TNTC treatment than in CTC treatment. Soil surface roughness decreased 44% from the first to the fifth simu-lated rainfall test, on the average of the cropped treat-ments, and 38% in the no cropped treatment. The low reduction in roughness values observed in the cropped treatments in relation to bare soil demonstrates the im-portance of soil cultivation to conserve soil physical properties. A rapid decrease in random roughness in the no cropped soil during rainfalls was also verified by Paz-Ferreiro et al. (2008) and Zoldan Júnior et al. (2008), while, low reduction in roughness in a cropped soil was verified by Bertol et al. (2006).
Runoff velocity was evaluated only after the third test because, before that, water infiltration capacity was higher than the simulated rainfall height. In TNTC treat-ment the runoff velocity was 27% of that verified in CTC treatment and, in relation to BNTC treatment, it was 47%, on the average of rainfall tests (Table 2). Thus, TNTC treatment was more efficient in increasing the surface roughness in comparison to CTC (p < 0.2). Moreover, it was also more efficient in reducing runoff velocity, as also verified by Bertol et al. (2006). The soil surface roughness is an important soil property which influences runoff velocity, soil water infiltration and run-off quantity. Runrun-off velocity increased 59% in CTC treatment and 20% in TNTC treatment, from test 3 to test 4 (Table 2), explained because of the better soil physi-cal quality in TNTC treatment. When comparing TNTC and BNTC treatments in this period, runoff ve-locity increased less in BNTC (17%) than in TNTC (20%), which demonstrates lower degradation of the soil surface despite one residue removal by burning, but with no tillage at the establishment the experiment, as veri-fied by Bertol et al. (2006).
Sediments transported by runoff
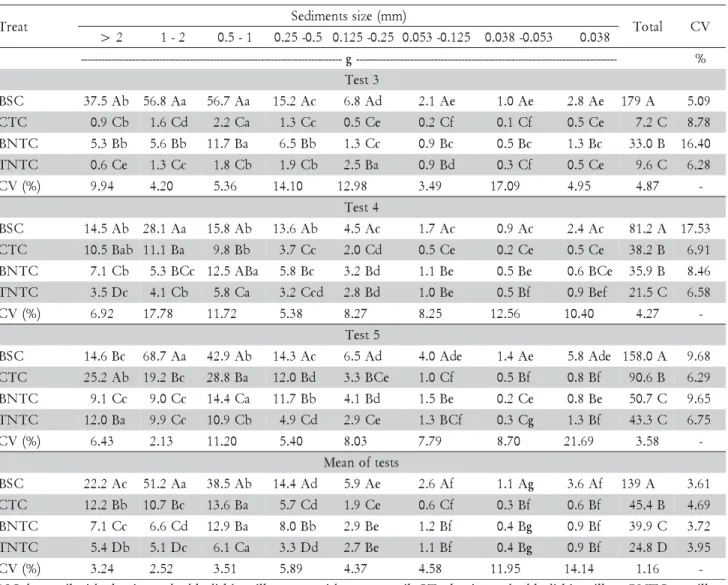
Sediment transported by runoff varied between treat-ments, sediment sizes and rainfall tests, with a tendency of increasing the quantity of coarse-size sediments and decreasing quantity of fine-size sediments (Table 3). This tendency is normal and can be justified due to the chis-eling operation, considered as minimal soil tillage, per-formed in all treatments, causing the formation of coarse sediments, predominantly. Expressive variations in sedi-ment quantity and sedisedi-ment size distribution from run-off as a function of soil management systems were found by Bertol et al. (2006), Bertol et al. (2008) and Panuska et al. (2008).
Sediment size from 0.038 to 0.053 mm occurred in low quantity (0.4 g in BNTC and TNTC treatments), while sediment size from 1 to 2 mm showed the highest quantity (51.2 g in BSC treatment) (Table 3), on the av-erage of the rainfall tests. Soil mechanical mobilization with plowing and disking with no crop in BSC treatment, and soil no-till and the presence of crops in BNTC and
TNTC treatments justify these results. This demon-strates the importance of minimum soil mobilization to reduce the quantity of sediments available for transport by runoff, since, fine-size sediments are more easily trans-ported by runoff than coarse-size sediments. Similar re-sults were found by Bertol et al. (2006), Cogo et al. (1983) and Panuska et al. (2008).
Comparing CTC and TNTC treatments, in the CTC, 93% of the total sediment size was from 0.5 to > 2 mm, while, in TNTC, this size class reached 80% of total sediment, on the average of the rainfall tests (Table 3). On the other hand, size from < 0.038 to 0.125 mm accounted for only 3.3% of the sediments in CTC treat-ment and, in TNTC, 9.68%. Clearly, these results dem-onstrate that no-till had finer sediments in comparison to plowing plus disking treatment (with intense soil me-chanical mobilization), as also reported by Bertol et al. (2006), Cogo et al. (1983) and Leite et al. (2004). That fact can be related to off site results in environmental con-tamination, mainly on water resources, because fine sedi-ments are more efficient in adsorbing and transporting chemical products in runoff.
In sediment sizes from 0.5 to > 2 mm, the amount of sediments transported by runoff increased from rain-fall test 4 to test 5. Conversely, such amount decreased in size from < 0.038 to 0.125 mm (Table 3). In coarse sediments the values were 87% of the total transported in test 4 and 90% in test 5, while in fine sediments (on the average of treatments) the amounts were only 8% and 7% of total transported sediments in the respective tests. In CTC treatment, coarse sediments represent 92% of the total transported in test 4 and 94% in test 5. Fine sediments, reach only 3.1% of the total transported in test 4 and 2.5% in test 5. In the TNTC treatment, on the other hand, considering coarse sediments, these amounts were 77% in test 4 and 87% in test 5, while, in fine sedi-ments, the values were of 11% in test 4 and 7% in test 5. Those tendencies are normal, considering that the chis-eling mechanical operation occurred in all treatments, partially revolved the soil, and produced available sedi-ments to be transported. Coarse sedisedi-ments generated by soil till operation were transported, mainly in rainfall test 4, and, in test 5, these coarse sediments were prob-ably produced mainly by rainfall energy and water flow on the rills, according to Lu et al. (1989).
erosion impacts, is caused mainly by fine sediments from the no-till system.
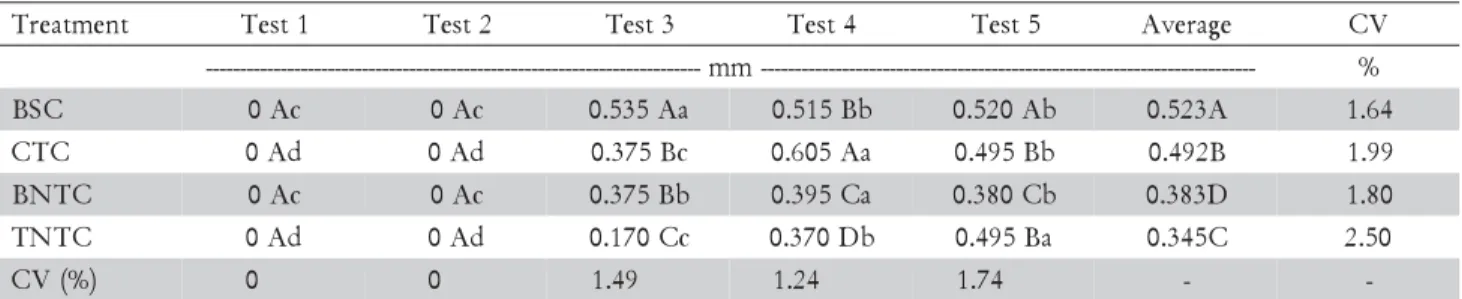
The D50 index of the runoff transported sediments were different between the treatments in the three rain-fall tests in which runoff occurred (Table 4), as verified by Bertol et al. (2006), Cogo et al. (1983) and Leite et al. (2004). In rainfall test 3 the D50 index was lower in TNTC than in the other treatments. Considering the average of the tests, D50 index in TNTC was 30% lower than in CTC treatment. The absence of soil mechanical till dur-ing several years in TNTC could explain why this in-dex was lower than in the CTC treatment, in which soil till was routinely done with plowing and disking, al-though both treatments were cultivated and after, sub-mitted to the same chiseling operation. In the TNTC treatment, the reduction caused in the D50 index was (on the average of the rainfall tests) 34% (in relation to the BSC treatment), due to the absence of a soil crop in BSC. Thus, the soil crop and mechanical till operation
in-crease the quantity of coarse sediments in comparison with soil cultivated under no-till system.
Random roughness (RR) negatively influenced the D50 index of the sediments, as also verified by Bertol et al. (2006), Cogo et al. (1983) and Panuska et al. (2008); 75% of the D50 index was explained by RR, on the aver-age rainfall tests (Figure 1). Thus, rougher surfaces and/ or more stable roughness (as in CTC and TNTC treat-ments) can retain more sediments and, in general, the eroded sediments were coarser than on smoother sur-faces and/or with fewer stable roughness (as in CTC and BSC treatment), as also verified by Darboux and Huang (2005). The main consequence of increasing superficial roughness is to decrease runoff velocity, volume and run-off transport energy (Bertol et al., 2006; Cogo et al., 1983 and Lu et al., 1989).
Runoff velocity (Rv) positively influenced the D50 in-dex of sediments, as also reported by Bertol et al. (1997), Bertol et al. (2006), Cogo et al. (1983) and Leite et al. Table 3 – Sediments size distribution presents in runoff, in different treatments (Treat.) after chiseling operation.
BSC: bare soil with plowing + double disking tillage crop without crop soil; CT: plowing + double disking tillage; BNTC: no-tillage in a never soil tilled and with residues burned; TNTC: traditional no-tillage (CTC, BNTC and TNTC, tillage with crop soil). Means followed by the same letters not differ (T test, p < 0.05). Upper case letters in column and lower case letters in line. CV: coefficient of variation.
t a e r
T Sedimentssize(mm) Total CV
2
> 1-2 0.5-1 0.25-0.5 0.125-0.25 0.053-0.125 0.038-0.053 0.038 -g
--- %
3 t s e T C
S
B 37.5Ab 56.8Aa 56.7Aa 15.2Ac 6.8Ad 2.1Ae 1.0Ae 2.8Ae 179A 5.09 C
T
C 0.9Cb 1.6Cd 2.2Ca 1.3Cc 0.5Ce 0.2Cf 0.1Cf 0.5Ce 7.2C 8.78 C
T N
B 5.3Bb 5.6Bb 11.7Ba 6.5Bb 1.3Cc 0.9Bc 0.5Bc 1.3Bc 33.0B 16.40 C
T N
T 0.6Ce 1.3Cc 1.8Cb 1.9Cb 2.5Ba 0.9Bd 0.3Cf 0.5Ce 9.6C 6.28 )
% ( V
C 9.94 4.20 5.36 14.10 12.98 3.49 17.09 4.95 4.87 -4
t s e T C
S
B 14.5Ab 28.1Aa 15.8Ab 13.6Ab 4.5Ac 1.7Ac 0.9Ac 2.4Ac 81.2A 17.53 C
T
C 10.5Bab 11.1Ba 9.8Bb 3.7Cc 2.0Cd 0.5Ce 0.2Ce 0.5Ce 38.2B 6.91 C
T N
B 7.1Cb 5.3BCc 12.5ABa 5.8Bc 3.2Bd 1.1Be 0.5Be 0.6BCe 35.9B 8.46 C
T N
T 3.5Dc 4.1Cb 5.8Ca 3.2Ccd 2.8Bd 1.0Be 0.5Bf 0.9Bef 21.5C 6.58 )
% ( V
C 6.92 17.78 11.72 5.38 8.27 8.25 12.56 10.40 4.27 -5
t s e T C
S
B 14.6Bc 68.7Aa 42.9Ab 14.3Ac 6.5Ad 4.0Ade 1.4Ae 5.8Ade 158.0A 9.68 C
T
C 25.2Ab 19.2Bc 28.8Ba 12.0Bd 3.3BCe 1.0Cf 0.5Bf 0.8Bf 90.6B 6.29 C
T N
B 9.1Cc 9.0Cc 14.4Ca 11.7Bb 4.1Bd 1.5Be 0.2Ce 0.8Be 50.7C 9.65 C
T N
T 12.0Ba 9.9Cc 10.9Cb 4.9Cd 2.9Ce 1.3BCf 0.3Cg 1.3Bf 43.3C 6.75 )
% ( V
C 6.43 2.13 11.20 5.40 8.03 7.79 8.70 21.69 3.58 -s
t s e t f o n a e M C
S
B 22.2Ac 51.2Aa 38.5Ab 14.4Ad 5.9Ae 2.6Af 1.1Ag 3.6Af 139A 3.61 C
T
C 12.2Bb 10.7Bc 13.6Ba 5.7Cd 1.9Ce 0.6Cf 0.3Bf 0.6Bf 45.4B 4.69 C
T N
B 7.1Cc 6.6Cd 12.9Ba 8.0Bb 2.9Be 1.2Bf 0.4Bg 0.9Bf 39.9C 3.72 C
T N
T 5.4Db 5.1Dc 6.1Ca 3.3Dd 2.7Be 1.1Bf 0.4Bg 0.9Bf 24.8D 3.95 )
% ( V
-(2004); 61% of the D50 index was explained by Rv, on the average simulated rainfall tests (Figure 2). Moreover, in treatments with more coarse sediments (CTC and BSC), runoff velocity was higher and, of course, transported more sediments than in treatments in which runoff was lower and transported finer-size sediments (BNTC and TNTC). Runoff velocity is the principal hydrological variable that influences the transport of sediments by soil water erosion.
The relation between D50 sediments index and the Ir index indicated that 63% of the D50 was explained by Ir, on the average of the simulated rainfall tests (Figure 3). This still shows that the runoff velocity influences the
D50 index more than the surface roughness, when these variables are individually related to D50 index, as also verified by Bertol et al. (1997) and Cogo et al. (1983). This occurs because the D50 index increases with the in-crement of runoff velocity, and consequently, with the increase of Ir index, but it decreases with the roughness increase, as previously explained.
Acknowledgements
To Conselho Nacional de Desenvolvimento Científico e Tecnológico – CNPq for Research Scholar-ship and financial resources (Edital Universal 019/2004).
Table 4 – D50 index of the sediments transported by runoff, determined in applied simulated rainfall, after chiseling operation (means of two replicates).
BSC: bare soil with plowing + double disking tillage crop without crop soil; CTC: plowing + double disking tillage; BNTC: no-tillage in a never soil tilled and with residues burned; TNTC: traditional no-tillage (CTC, BNTC and TNTC, tillage with crop soil). Means followed by the same letters not differ (T test, p < 0.05). Upper case letters in column and lower case letters in line. CV: coefficient of variation.
t n e m t a e r
T Test1 Test2 Test3 Test4 Test5 Average CV
-m m
--- %
C S
B 0Ac 0Ac 0.535Aa 0.515Bb 0.520Ab 0.523A 1.64
C T
C 0Ad 0Ad 0.375Bc 0.605Aa 0.495Bb 0.492B 1.99
C T N
B 0Ac 0Ac 0.375Bb 0.395Ca 0.380Cb 0.383D 1.80
C T N
T 0Ad 0Ad 0.170Cc 0.370Db 0.495Ba 0.345C 2.50
) % ( V
C 0 0 1.49 1.24 1.74 -
-Figure 2 – Relationship between runoff velocity (Rv) and D50 index of the sediments transported by runoff, on the average of the simulate rainfall tests. BSC: bare soil with plowing + double disking tillage crop without crop soil; CTC: plowing + double disking tillage; BNTC: no-tillage in a never soil tilled and with residues burned; TNTC: traditional no-tillage (CTC, BNTC and TNTC, tillage with crop soil).
Figure 1 – Relationship between random roughness (RR) of the soil surface and D50 index of sediments transported by runoff, on the average of the simulated rainfall tests. BSC: bare soil with plowing + double disking tillage crop without crop soil; CTC: plowing + double disking tillage; BNTC: no-tillage in a never tilled soil and with residues burned; TNTC: traditional no-tillage (CTC, BNTC and TNTC, tillage with crop soil).
0.30 0.35 0.40 0.45 0.50 0.55 0.60
6 8 10 12 14
D50
in
dex of
sedi
m
e
n
ts,
m
m
RR, mm
D50= 0.769 - 0.032RR R2= 0.75**
0.30 0.35 0.40 0.45 0.50 0.55 0.60
0.05 0.10 0.15 0.20 0.25 0.30
D50
in
de
x of
se
d
im
e
n
ts,
m
m
Runoff velocity, Rv, m s–1 D50= 0.359 + 0.551Rv
References
Amado, T.J.C.; Conceição, P.C.; Bayer, C.; Eltz, F.L.F. 2007. Soil quality evaluated by “soil quality kit” in two long-term soil management experiments in Rio Grande do Sul State, Brazil. Revista Brasileira de Ciência do Solo 31: 109-121. (in Portuguese, with abstract in English).
Bertol, I.; Albuquerque, J.A.; Leite, D.; Amaral, A.J.; Zoldan Jr., W.A. 2004. Soil physical properties under conventional tillage and no-tillage, in crop rotation and succession after years six, to compared with natural pasture. Revista Brasileira de Ciência do Solo 28: 155-163. (in Portuguese, with abstract in English). Bertol, I.; Amaral, A.J.; Vidal Vázquez, E.; Paz González, A.;
Barbosa, F.T.; Brignoni, L.F. 2006. Relations of the soil surface roughness with the rainfall volume and with the aggregate stability on water. Revista Brasileira de Ciência do Solo 30: 543-553. (in Portuguese, with abstract in English).
Bertol, I.; Cogo, N.P.; Miquelluti, D.J. 1997. Size-distribution of eroded sediments in the runoff water as affected by residue mulch, surface roughness, and discharge rate. Pesquisa Agropecuária Gaúcha 3: 199-206. (in Portuguese, with abstract in English).
Bertol, I.; Barbosa, F.T.; Fabian, E.L.; Pegoraro, R.; Zavaschi, E.; Paz González, A.; Vidal Vázquez, E. 2008. Surface runoff in different soil management systems on typical Hapudox soil. Revista Brasileira de Engenharia Agrícola e Ambiental 12: 243-250. (in Portuguese, with abstract in English).
Bertol, I.; Mello, E.L.; Cogo, N.P.; Vidal Vázquez, E.; Paz González, A. 2006. Water-erosion related parameters under steady runoff-rate, in different soil tillage methods. Revista Brasileira de Ciência do Solo 30: 715-722. (in Portuguese, with abstract in English).
Bertol, I.; Zoldan Jr., W.A.; Fabian, E.L.; Zavaschi, E.; Pegoraro, R.; Paz González, A. 2008. Effect of a chiseling and rainfall erosivity on some parameters of water erosion in management systems of a typical Hapludox. Revista Brasileira de Ciência do Solo 32: 747-757. (in Portuguese, with abstract in English). Cogo, N.P.; Moldenhauer, W.C.; Foster, G.R. 1983. Effect or crop
residue, tillage-induced roughness, and runoff velocity on size distribution of eroded soil aggregates. Soil Science Society of America Journal 47: 1005-1008.
Darboux, F.; Huang, C. 2005. Does soil surface roughness increase or decrease water erosion and particle transfers? Soil Science Society of America Journal 69: 748-756.
Engel, F.L.; Bertol, I.; Ritter, S.R.; Paz González, A.; Paz-Ferreiro, J.; Vidal Vázquez, E.. 2009. Soil erosion under simulated rainfall in relation to phenological stages of soybeans and tillage methods in Lages, SC, Brazil. Soil & Tillage Research 103: 216-221. Gilley, J.E.; Finkner, S.C.; Varvel, G.E. 1987. Size distribution of
sediment as affected by surface residue and slope length. American Society of Agricultural Engineering 30: 1419-1424. Kamphorst, E.C.; Jetten, V.; Guèrif, J.; Pitränen, J.; Iversen, B.V.;
Douglas, J.T.; Paz, A. 2000. Predicting depressional storage from soil surface roughness. Soil Science Society of America Journal 64: 1749-1758.
Leite, D.; Bertol, I.; Guadagnin, G.C.; Santos, E.J.; Ritter, S.R. 2004. Water erosion on a Hapludox submitted to different soil managements under simulated rainfall. I. Soil and water losses. Revista Brasileira de Ciência do Solo 28: 1033-1044. (in Portuguese, with abstract in English).
Lu, J.Y.; Cassol, E.A.; Moldenhauer, W.C. 1989. Sediment transport relationships for sand and silt loam soils. American Society of Agricultural Engineering 32: 1923-1931.
Panuska, J.C.; Karthikeyan, K.G.; Miller, P.S. 2008. Impact of surface roughness and crusting on particle size distribution of edge-of-field sediments. Geoderma 145: 315-324.
Paz-Ferreiro, J.: Bertol, I.: Vidal Vázquez, E. 2008. Quantification of tillage, plant cover, and cumulative rainfall effects on soil surface microrelief by statistical, geostatistical and fractal indices. Nonlinear Processes in Geophysics 15: 575-590.
Sadeghi, S.H.R.; Ghaderi V.B.; Safaeeian, N.A. 2007. Comparison between effects of open grazing and manual harvesting of cultivated summer rangelands of northern Iran on infiltration, runoff and sediment yield. Land Degradation and Development 18: 608-620.
Swanson, N.P. 1965. Rotating-boom rainfall simulator. American Society of Agricultural Engineering 8: 71-72.
Tormena, C.A.; Silva, A.P.; Imhoff, S.D.; Dexter, A.R. 2008. Quantification of the soil physical quality of a tropical Oxisol using the index. Scientia Agricola 65: 56-60.
Zoldan Júnior, W.A.; Bertol, I.; Pegoraro, R; Fabian, E.L.; Zavaschi, E.; Vidal Vázquez, E. 2008. Soil superficial roughness formed by chiseling and affected by rainfall erosivity. Revista Brasileira de Ciência do Solo 32: 353-362. (in Portuguese, with abstract in English).
Received July 08, 2008 Accepted May 04, 2010 Figure 3 – Relationship between index (Ir) and D50 index of the
sediments transported by runoff, on the average of the simulated rainfall tests. BSC: bare soil with plowing + double disking tillage crop without crop soil; CTC: plowing + double disking tillage; BNTC: no-tillage in a never tilled soil and with residues burned; TNTC: traditional no-tillage (CTC, BNTC and TNTC, tillage with crop soil).
0.30 0.35 0.40 0.45 0.50 0.55 0.60
0.4 0.8 1.2 1.6 2.0 2.4 2.8 3.2
D50
in
dex of
sedi
m
e
n
ts,
m
m
Ir index