ISSN 1553-6203
© 2007 Science Publications
Corresponding Author: Dr. D. Guillermo Pérez Ishiwara (Ph. D),Program of Molecular Biomedicine, ENMyH-IPN. Guillermo Massieu Helguera #239. Fracc “La Escalera”, Ticomán, CP 07320, México, D.F. Tel/fax (55) 55864741
AFLPs in Warmblood Sporting Horses: Genetic Correlation with Height at the Withers
1,3
V. Sanchez,
2C. Lemus,
1A. Inchaustegui,
1R. Vazquez, and
3D.G. Perez
1
Multidisciplinary Research Laboratory, Military School of Medical Graduate and Army School of
Medicine, University of the Army and Air Force, México. Lomas de San Isidro, CP 11620, México, D.F.
2University of Nayarit. Medicine School of Veterinary, Ciudad de la Cultura Amado Nervo, Tepic, Nayarit, México
3
Program of Molecular Biomedicine, ENMyH-IPN, Fracc. “La Escalera”, Ticomán, CP 07320, México,D.F.
Abstract: The Mexican army produces Warmblood horses for jumping proposes. However, breeding is based on phenotype and stallions are selected stepwise until the end of growth, representing a high care and maintenance cost. In this work using 64 selective primer combinations and AFLP technology we identified specific molecular markers related with height at the withers measurements of Warmblood horses. AFLPs generated 14 specific polymorphic bands, giving a polymorphic ratio of 1.6%. Heterozygosity values were 0.205 and 0.311 for high and short groups, respectively. A 70 pb specific band present only in males, suggest that it could be used as specific marker to determine sex. Three specific bands were selected to determine genetic distances. UPGMA dendogram showed one branch that clearly grouped most of the shorter horses and other branch that grouped all higher horses, with a mixture of four organisms defined within the short group. Experiments currently in progress will allow us to identify other specific markers to make a genetic selection of high performance individuals in early stages of life.
Key words: Warmblood horses; conformation; AFLP; polymorphisms; horses.
INTRODUCTION
In the breeding of Warmblood horses for riding purposes, great emphasis is placed on conformation and movement [1-4] .Several studies have showed positive correlations between body measurements and jumping ability [5,6] . Holsmstrom et al. 1990[1], using the variations in several Swedish Warmblood individuals, described the conformation characteristics of elite sport horses and determined an average height at the withers of 1.63 m. Selection of individuals suitable for breeding depends almost exclusively of phenotypic characteristics of horses, which is usually subjective and based on experience. In Mexican army, the Warmblood horse is reproduced under a specific program entitled “High Sportive Performance for the production of the Warmblood Military Horse”. One of the main goals of the program is to produce equestrian horses with the best conformation characteristics. The breeding is based on phenotype and stallions are selected stepwise until the end of growth development taking in consideration mainly the height at the wither measurement. The process takes at least five years, representing a high care and maintenance cost [7]. In this work, we used Molecular Biology technology to generate amplified fragment length polymorphisms
METHODS
Animals and phenotypic measurements
We used 47 Warmblood horses, 22 male and 25 female, produced in the Mexican Army. The breeding animals were ≥ 5 years old and engendered from two Europeans Warmblood stallions with different Pureblood English mothers.
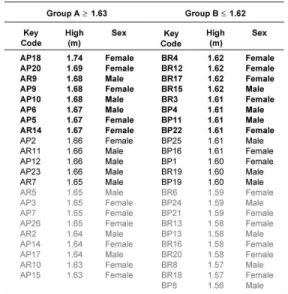
The height at the withers was measured using a hypometre, taking the distance between the floor and 5th thoracic vertebra at the left part of the body. The selection was done considering animals whose height at withers measurements fall out of the range of one standard deviation of the average height of the population studied. The selected animals were grouped as follows: Group A, 8 animals of height ≥ 1.67 m and Group B, 10 animals of height ≤ 1.59. Parental stallions named P and R were included as positive controls for each group, respectively. For identification of horses, a key code of two letters and one number was assigned. The first letter (A or B) indicate the group, the second (P or R) indicate the progenitor stallion, and the number indicate the organism analyzed.
Molecular Analysis
DNA extraction. Genomic DNAs from horses were extracted from blood and purified according to the protocol described by Sambrook et al. [9]. The concentration was spectrophotometrically measured and the integrity was checked on agarose gels.
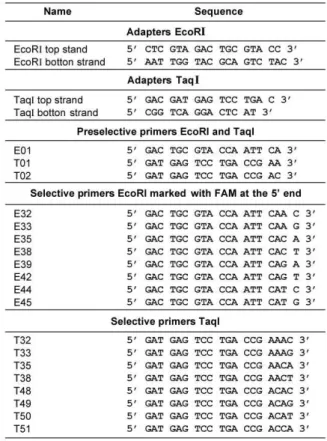
DNA restriction and ligation of oligonucleotides adapters. The DNA was digested with TaqI and EcoRI enzymes (Invitrogen). Briefly, 400 ng of DNA were incubated for 1 h at 65 0C with 5U TaqI in a final volume of 25 µl, containing: 50mM Tris-HCl pH 8.0, 10mM MgCl2 and 50mM NaCl. Then, 5U EcoRI were added and incubated at 37oC for 1 h. To ligate oligonucleotide adapters, 5 pmol EcoRI and 50 pmol TaqI adapters (Table 1), and 1U DNA ligase (Invitrogen) were incubated overnight at 14oC in the appropriated buffer.
Preselective Amplification. Five microlitres of DNA template were added to the PCR reaction mix containing: 0.5U Taq polymerase (Invitrogen); 1 µM each of EcoRI and TaqI primers carrying one selective nucleotide at the 3’end (A for EcoRI and A or C for TaqI, see Table 1); 2.5mM MgCl2, 0.2 mM each of the four dNTPs, and 1X buffer for Taq polymerase, in a total volume of 25µl. The PCR reaction was performed using the following profile: 10 min at 940C, 30 cycles at (940C, 60 s, 560C, 60 s and 720C, 60 s) and a final extension at 720C for 10 min. The pre-amplified template was 1:10 water diluted and processed further.
Selective Amplification. Five microlitres of diluted preamplified template were added to 20 µl of PCR reaction mix containing: 0.5U Taq polymerase, 1 µM
each of selective primers EcoRI and TaqI, 2.5 mM MgCl2, 0.2 mM each of dNTPs, and 1X buffer for Taq polymerase. Different sets of EcoRI and TaqI carboxyfluorescein (FAM) 5´end labeled selective primers were used. E32 to E45, for EcoRI and T32 to T51 for Taq I (Table 1).
Table 1: Adapters and primers used for AFLP analysis.
The selective PCR reactions were performed using the following profile: 10 min at 940C; 5 cycles at (940C, 60 s; 650C, 60 s and 720C, 60 s); 5 cycles at (940C, 60 s; 600C, 60 s and 720C, 60 s); 30 cycles at (940C, 60 s; 560C, 60 s and 720C, 60 s) and a final extension at 720C for 10 min.
Analysis of AFLP fragments. The PCR products were separated on a 15 X 17 cm 12% polyacrylamide (acrylamide/bisacrylamide 29:1) gels in TBE buffer (Tris-HCl, 100 mM Boric acid, 2mM EDTA). Electrophoresis was performed at constant voltage (150 V) for 3 h. Subsequently, the gels were ethidium bromide stained (0.5 µg/ml), visualized in UV transiluminator and photographed.
artiodactyla and perissodactyla organisms. Finally AFLP patterns were done using the ABI PRISM 310 DNA Sequencer and the GeneScan 2.1 software in addition of polyacrylamide gels.
Statistical Analysis
The polymorphic fragments obtained were considered as dominant markers, and the electrophoretic patterns were converted in a binary matrix using the following criteria: 1 represents band presence and 0, represents band absence. Only clear bands were considered for the analysis, the ambiguous ones were discarded. From molecular data, allele frequencies and the heterozygosity of each group was calculated using BIOSYS 2 computer program [10]. To determine the statistical differences of the polymorphic fragments between groups, X2 analysis was carried out.
The genetic distances and similarity between groups were calculated using the alleles with significant differences, according the binary date method described by Nei [11] with PHYLTOOLS computer program [12]. Association among groups was determinated by unweighted pair group method with arithmetic mean (UPGMA) clustering based on genetic distances using PHYLIP version 3.5 computer program[13] .
RESULTS
AFLP patterns, reproducibility and specificity.
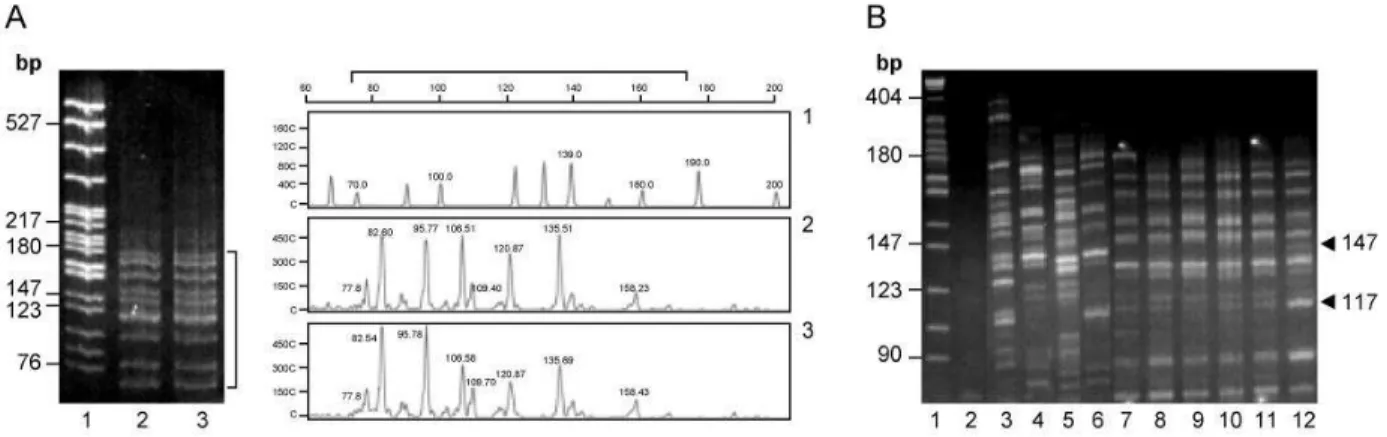
To date no AFLP genetic polymorphisms have been carried out in Warmblood horses, thus to determine the reproducibility of AFLP polymorphic patterns, DNA extracted from blood and mane were used as template for PCR reaction with the E42-T51 selective oligonucleotides, chosen randomly. As it is showed in Figure 1A, identical AFLP patterns, with specific bands ranging from 70 to 180 bp, were reproducible observed in DNA extracted from different origin. These results demonstrated that polymorphic bands are highly reproducible and do not represent technical artifacts. Specificity of AFLP was tested using DNA extracted from different species and the E42-T51 oligonucleotides set. As it is observed in Figure 1B, the AFLP patterns obtained from less phylogenetic related mammals showed important differences (Fig 1B, lanes 3-6), while the AFLP patterns obtained from close related species shared several bands (Fig 1B, lanes 7-11). Warmblood horse AFLP (Fig 1B, lane 12) shared several bands with a phylogenetic related species from actiodactyla order (Fig 1B lanes 7-11). However Warmblood horse AFLP has two specific bands of 147 and 117 pb (Fig 1B, arrowheads). These results suggest that AFLP using complete sets of selective oligonucleotides, could be also a useful method to infer phylogenetic relationships between animals.
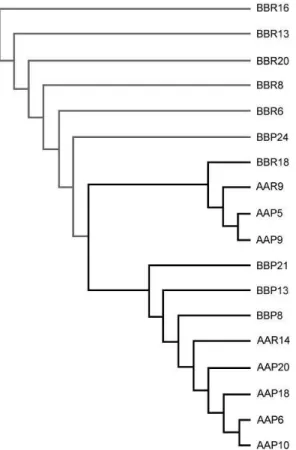
Phenotypic selection of Warmblood horses and polymorphic genotypification. Forty seven Warmblood horses of 5 years old from Mexican army, were measured and selected as high or short organisms depending of the height at the withers ≥ 1.67 m or ≤ 1.59 m, respectively (Table 2). DNA from blood or manes from the selected animals were obtained and AFLP analyses were done using 64 selective primer combinations. Primer sets that generated polymorphic fragments as well as the number of fragments are showed in Table 3. The combinations generated 14 polymorphic bands out of 863, in the range of 50 to 500 bp, giving a polymorphic ratio of 1.6%. The E32-T48 was the primer set that generated more polymorphic bands. Interestingly, E32-T50 primers set generated a specific band of 70 pb, present only in male individuals, suggesting that this band could be used as specific marker to determine sex (Fig 2 lanes 2-7 arrowhead). Using the set primers that generated polymorphic fragments, we estimated the variability of Warmblood horses calculating the heterozigosity by BIOSYS 2 [10]. The results showed that expected and observed heterozygosity values (Table 3) were low in both groups, due military horse’s population represent a selected animals group. Three polymorphic fragments showing significative differences between the groups were selected and differences in allele frequency were used to determine the genetic distances to construct the UPGMA dendogram. In Figure 3, two main branches were observed, one of the branches group mainly shorter horses (60%), while the other branch grouped 100% of higher horses and 40% of the shorter ones.
Fig 1: Reproducibility and Specificity of AFLP assays. AFLPs were obtained using the selective primers E42-T51. A. Reproducibility. The panel shows the AFLP patterns; (Left) 12% polyacrilamide gels; (Right) Electropherograms obtained on ABI PRISM 310 DNA Sequencer 1. pBR322/MspI. DNA marker and ROX 500 size standards, respectively; AFLPs obtained from blood (2) and mane (3) DNA extracted. Square bracket marks the same regions of AFLPs in gel and electropherogram. B. Specificity. AFLP patters obtained from different mammalian species analysed on 12% polyacrilamide gel. Lane 1, pBR322/MspI. DNA marker; Lane 2, negative control of PCR; Lane 3, primates order (human); Lane 4, rodentia order (mouse); Lane 5, lagomorpha order (rabbit); Lane 6, carnivora order (dog); Lane 7-11, actiodactyla order (buffalo, goat, ovine, cow, pig); Lane 12, Warmblood horse. The arrows heads indicates specific polymorphic bands for Warmblood horse.
Table 3: Polymorphic fragments generated with specific set of primers
Table 4: Values of observed an expected heterozygosity
Fig 3: Dendogram representing genetic distances of Warmblood horses polymorphisms of groups A o B. The dendogram was constructed using the UPGMA cluster analysis of genetic distance based on AFLP data. The horses are represented for their key code.
DISCUSSION
AFLP technology are based on a high-stringency PCR reaction that ensures the preferential amplification of template regions between annealing sites which have perfect complementarities to primers used. In this work, AFLP amplified a high number of restriction fragments (863), with highly reproducible profiles across independent DNA extraction and template preparations. This characteristics distinguishes AFLP from RAPDs markers, making it very useful to determine both, genetic relationship studies between non-phylogenetic related organisms [14-16] and for localizing genetic factors, within the same groups, controlling physical or economical important simple and complex traits[17] . Our results also demonstrated that Warmblood horses polymorphisms are very specific due although it shared several bands with close related mammals, we were able to define specific
Warmblood polymorphic bands. Thus, making sure about the reability and reproducibility of AFLPs, we search for markers to elucidate some putative correlations between genetic markers and the height at the withers. We decided to score the produced markers as mendelians ones, presence or absence of bands, considering to important evidences: i) Mexican Military Warmblood horse population is highly selected and ii) conformation characteristic are well defined and grouped. As results, sixty four EcoRI/TaqI primer combinations generated 863 amplified bands; fourteen of them were polymorphic giving a polymorphic ratio of 1.6%. Bailey in 1994, using 212 primers for randomly amplified polymorphic DNA (RAPD), found only 9 bands, two of which could be useful to differentiate Thoroughbred and Arabian horses [18]. The heterozigosity results showed, as expected, that calculated values were low in both groups, but especially in horses of group A. These data are in concordance with the selection process within Warmblood horse population, where the highest females are mated with the highest selected stallions, showing less genetic variability; while in the group B, breeding horses came from the mating of several high females with shorter stallions, contributing with a more genetic variation pool.
stallion (P) and the other came from shorter one (R), but their mothers were the highest females used for breeding (data not shown). Taking together the results of this work, we suggest that 1) AFLP is a very robust and reproducible polymorphic technology that could be used in horses to determine genetic diversity, genetic relationships among populations, phylogenesis and importantly for determining the relationship between genetic characteristics with phenotypic and economical traits. 2) The conformation characteristics of sporting horses, such as the high at the withers would be predict by the use of AFLP polymorphisms. 3) A specific AFLP marker for male sex was identified. Experiments currently in progress with organism from different genetic pools as well as using other primers combinations, will allow us to identify the AFLPs markers that togheter will be use for the early selection of Warmblood sporting horses.
ACKNOWLEDGEMENTS
This work was supported by CONACYT given to Dr. Pérez. We express our gratitude to Alfredo Padilla Barberi for graphical design.
REFERENCES
1. Holmstrom M., Magnusson L.E.& Philipsson J., 1990. Variation in conformation of Swedish Warmblood horses and conformational characteristics of elite sport horses. Equine Veterinary Journal 22(3): 186-193.
2. Manning J. T. & Ockenden L., 1994. Fluctuating asymmetry in race horses. Nature 370 (6486): 185-6.
3. Barrey E., Blanchard G.& Orange F., 1994. Influence of the level of competition, breed, sex and genetic factors on stride kinematics of show jumping Horses. The Equine Athlete 7, 14-17. 4. Belloy E.& Bathe A.P. (1996) The importance of
standardising the evaluation of conformation in the horse. Equine Veterinary Journal 28(6): 429-430.
5. Muller J. & Schwark, H.J., 1979. Merkmalsvarians und Genetische Bedingtkeit von imTurniersport Erfassten Leistungsmerkmalen. Zuchterische Weiterentwicklung der Sprodpferderassen. Vortrage des III Int. Wissenschaftliches Symp., Leipzig 22-23 Mai, pp. 105-115.
6. Holmstrom M. & Philipsson J., 1993. Relationships between conformation performance and health in 4-year-old Swedish Warmblood Riding. Livestock Production Science 33(3-4): 293-312.
7. Lerma D.E., 1999. The horse of the century. Revista del Ejercito y FAM Mexicana. 6, 3-6 8. Vos P., Hogers R., Bleeker M., Reijans M., Lee
Th Van de., Frijters A., Pot J., Peleman J., Kuiper M & Zabeau M., 1995. AFLP: a new technique for DNA fingerprinting. Nucleic Acids Research 23(21): 4407-14.
9. Sambrook J., Fritsh E.F. & Maniatis T., 1989. Molecular Cloning: A laboratory Manual. Cold Spring Harbor, New York.
10. William C. Black IV .,1997. BIOSYS2 Department of Microbiology Colorado State University Ft. Collins, CO 80523 (wcb4@lamar.colostate.edu).
11. Nei M. & Li W.H., 1979. Mathematical model for studying genetic variation in term restriction endonucleases. Proceedings of the National Academy of Sciences USA. 76 (10): 5269-5273. 12. Buntjer J.B. 2001 PHYLTOOLS Phylogenetic
Computer Tools V. 1.32 for Win. Wageningen Agricultural University, The Netherlands.
13. Felsenstein J. 1995 PHYLIP (Phylogeny Inference Package) University of Washington; Seattle, USA. Version 3.5c.
14. Ajmone-Marsan P.,Valentini A., Casandro M., Vecchiotti Antaldi, G., Bertoni G. & Kuiper M., 1997. AFLPTM markers for DNA fingerprinting in cattle. Animal Genetics 28 (6): 418-26.
15. Ajmone-Marsan P., Pocar P., Kuiper M. & Cicogna M. 1999 Genetic diversity in rare Norther Italian goat breed as revealed by AFLPTM markers. Zootecnica e Nutrizione Animale 25, 107-16.
16. Buntjer J.B., Otsen M., Nijman I.J., Kuiper M.T.R. & Lenstra J.A., 2002. Phylogeny of bovine species based of AFLP fingerprinting. Hereditary88(1): 46-51.
17. Ovilo C., Cervera M.T., Castellanos C. & Martinez-Zapater J.M., 2000. Characterization of Iberian pig genotypes using AFLP markers. Animal Genetics 31 (2): 117-22.
18. Bailey E.& Lear T.L., 1994. Comparison of thoroughbred and Arabian horses using RAPD markers. Animal Genetics 25, Suppl 1:105-8. 19. Bailey E.& Lear T.L., 1994. Comparison of
thoroughbred and Arabian horses using RAPD markers. Animal Genetics 25, Suppl 1:105-8. 20. Pomp D., Good B.A., Geisert R.D., Corbin C.J. &