F-Fluorothymidine PET-CT for Resected
Malignant Gliomas before Radiotherapy:
Tumor Extent according to Proliferative
Activity Compared with MRI
Fen Zhao1,2, Minghuan Li1,2, Zhiheng Wang3, Zheng Fu1,4, Yunfeng Cui3, Zhaoqiu Chen1,5, Jinming Yu1,2*
1Department of Radiation Oncology, Shandong Cancer Hospital, Shandong Academy of Medical Sciences, Jinan, China,,2Key Laboratory of Radiation Oncology of Shandong Province, Shandong Cancer Hospital and Institute, Jinan, Shandong, China,3Department of Radiation Oncology, Duke University Medical Center, Durham, NC, United States of America,4Department of Nuclear Medicine, Shandong Cancer Hospital and Institute, Jinan, Shandong, China,5Department of radiology, Shandong Cancer Hospital and Institute, Jinan, Shandong, China
Abstract
Objective
To compare the presence of post-operative residual disease by magnetic resonance imag-ing (MRI) and [18F]fluorothymidine (FLT)-positron emission tomography (PET)-computer tomography (CT) in patients with malignant glioma and to estimate the impact of18F-FLT PET on the delineation of post-operative target volumes for radiotherapy (RT) planning.
Methods
Nineteen patients with post-operative residual malignant gliomas were enrolled in this study. For each patient,18F- FLT PET-CT and MRI were acquired in the same week, within 4 weeks after surgery but before the initiation of RT. The PET-CT and MRI data were co-registered based on mutual information. The residual tumor volume defined on the18F-FLT PET (Vol-PET) was compared with that of gadolinium [Gd] enhancement on T1-weighted MRI (Vol-T1) and areas of hyperintensity on T2-weighted MRI (Vol-T2).
Results
The mean Vol-PET (14.61 cm3) and Vol-T1 (13.60 cm3) were comparable and smaller than
the mean Vol-T2 (32.93 cm3). The regions of18F-FLT uptake exceeded the contrast
en-hancement and the hyperintense area on the MRI in 14 (73.68%) and 8 patients (42.11%), respectively. In 5 (26.32%) of the 19 patients, Vol-PET extended beyond 25 mm from the margin of T1; in 2 (10.53%) patients, PET extended 20 mm from the margin of Vol-T2. Vol-PET was detected up to 35 mm away from the edge of Vol-T1 and 24 mm away from the edge of Vol-T2. In 16 (84.21%) of the 19 patients, the Vol-T1 extended beyond the
a11111
OPEN ACCESS
Citation:Zhao F, Li M, Wang Z, Fu Z, Cui Y, Chen Z, et al. (2015)18F-Fluorothymidine PET-CT for
Resected Malignant Gliomas before Radiotherapy: Tumor Extent according to Proliferative Activity Compared with MRI. PLoS ONE 10(3): e0118769. doi:10.1371/journal.pone.0118769
Academic Editor:Anita B. Hjelmeland, University of Alabama at Birmingham, UNITED STATES
Received:March 31, 2014
Accepted:January 6, 2015
Published:March 4, 2015
Copyright:© 2015 Zhao et al. This is an open access article distributed under the terms of the
Creative Commons Attribution License, which permits unrestricted use, distribution, and reproduction in any medium, provided the original author and source are credited.
Data Availability Statement:All relevant data are within the paper and its Supporting Information files.
Funding:Fen Zhao reports research grants from Shandong Academy of Medical Sciences (2012–23), during the conduct of the study. The funders had no role in study design, data collection and analysis, decision to publish, or preparation of the manuscript. The other authors have nothing to disclose.
PET. In all of the patients, at least some of the T2 was located outside of the Vol-PET.
Conclusions
The volumes of post-operative residual tumor in patients with malignant glioma defined by
18F-FLT uptake on PET are not always consistent with the abnormalities shown on
post-op-erative MRI. Incorporation of18F-FLT-PET in tumor delineation may have the potential to
improve the definition of target volume in post-operative radiotherapy.
Introduction
Malignant gliomas are the most common primary central nervous system tumors in adults. Maximal surgical resection followed by external-beam radiotherapy (EBRT) and adjuvant temozolomide (TMZ) chemotherapy is the standard treatment to date. The prognosis of pa-tients with malignant glioma remains poor [1]. The most common failure pattern is the pro-gression of the residual lesion or recurrence of the tumor bed, which is the so-called in-field failure [2–4]. Precise residual tumor identification and target volume delineation are of crucial importance for radiotherapy after surgery. However, magnetic resonance (MR) technology, such as magnetic resonance spectroscopy (MRS), diffusion-weighted imaging (DWI), perfu-sion-weighted imaging (PWI), and cerebral blood volume measurements with dynamic suscep-tibility-weighted contrast material-enhanced (DSC) MR imaging (MRI), were reported to be extremely useful in the differential diagnosis, grading, and treatment response evaluation of gli-omas [5–9]. Some of these evolving technologies have not been comprehensively applied clini-cally. Conventional MRI and computed tomography (CT) are still considered the standard methods for post-surgical target volume delineation. However, in patients treated with neuro-surgery, the persistent tumor is sub-optimally differentiated from the nonspecific post-opera-tive changes in either conventional CT or MRI because of treatment-related blood—brain barrier (BBB) disturbances. Additionally, these post-operative changes can persist for months after surgery [10–12]. In this context, it is clearly justified to search for new methods to define the tumor volume more precisely in post-operative imaging.
In recent years, positron emission tomography (PET) has been introduced in the manage-ment of primary brain tumors. PET imaging can reveal specific biological events and has the potential to complement the anatomical information derived from traditional radiological techniques. 30
- Deoxy-30
the literature have quantified tumor extension in18F-FLT PET and MRI and have compared these two imaging modalities using image fusion.
The purpose of this prospective study was to compare the post-operative volumes of residu-al disease defined by18F-FLT PET and MRI in patients with malignant gliomas prior to receiv-ing radiotherapy (RT). Furthermore, we also aimed to estimate the potential impact of18F-FLT PET on the delineation of post-operative target volumes for RT planning.
Patients and Methods
Patients
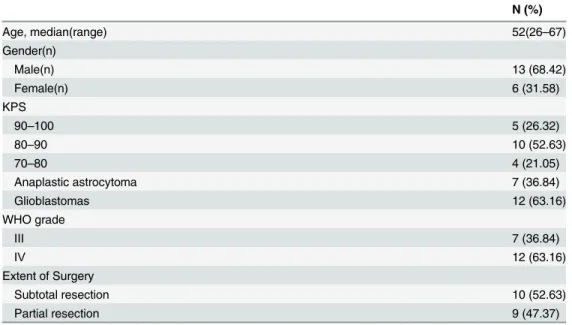
From May 2012 to August 2013, 19 adult patients (13 males and 6 females; median age, 52 years) with histologically confirmed malignant astrocytoma were included in the present study. Surgical resection was performed in all of the cases. The inclusion criteria were the diag-nosis (or suspicion) of residual tumor on MRI performed within 24 hours after surgery and/or the intra-operative diagnosis of possible residual tumor. Twelve of the 19 patients had World Health Organization (WHO) grade IV glioblastomas (GBM), and the other 7 patients had WHO grade III anaplastic astrocytomas. The Karnofsky performance status (KPS) scores of all patients were between 70 and 100. For each patient, MRI and18F- FLT PET-CT were per-formed during the same week, within 4 weeks after surgery but before the initiation of radio-therapy (RT). The steroid dose was not changed during this week of MRI and PET
examinations. The present prospective study was approved by the Institutional Review Board of Shandong Cancer Hospital and Institute, and all patients provided written informed con-sent. The characteristics of the included patients are listed inTable 1andS1 Table.
MRI
MRI was performed using a Philips 3.0 Tesla scanner Achieva 3.0T X-series (Philips Medical Systems, Best, The Netherlands). The patient’s head was immobilized by individual thermo-plastic mask fixation during the MRI examination. Because the standard head coil was too
Table 1. Patient’s characteristic (n = 19).
N (%)
Age, median(range) 52(26–67)
Gender(n)
Male(n) 13 (68.42)
Female(n) 6 (31.58)
KPS
90–100 5 (26.32)
80–90 10 (52.63)
70–80 4 (21.05)
Anaplastic astrocytoma 7 (36.84)
Glioblastomas 12 (63.16)
WHO grade
Ⅲ 7 (36.84)
Ⅳ 12 (63.16)
Extent of Surgery
Subtotal resection 10 (52.63)
Partial resection 9 (47.37)
small to use with thermoplastic mask fixation, acquisition was performed using a standard body coil. T1-weighted imaging was performed using a fast field echo sequence with a repeti-tion time (TR) of 433 ms, an echo time (TE) of 2.3 ms, a flip angle (FA) of 70°, and a bandwidth of 173.7 Hz/pixel; T2-weighted imaging was performed using a turbo spin echo sequence with a TR of 4393 ms, a TE of 380 ms, an FA of 90°, and a bandwidth of 255.1 Hz/pixel. The field of view (FOV) was 87.5 mm. Contrast-enhanced T1-weighted imaging was acquired 180 seconds after the administration of gadolinium diethylenetriaminepentaacetic acid (DTPA) 6.6 ±0.9mmol (Magnevist; 0.1 mmol/kg body weight; Bayer Schering Pharma, Osaka, Japan), using the same parameters as those for T1-weighted imaging. The slice thickness was 4.25 mm with one signal average and a 512×512 acquisition matrix.
Radiopharmaceuticals and
18F-FLT PET scan
18F-FLT was synthesized by a cyclotron (Mini Trace; GE Healthcare, Milwaukee, WI, USA)
and a synthesizer (TracerLab FxFN; GE Healthcare) and was prepared according to the method described by Yue et al. [23]. The products had to meet pre-specified criteria (e.g., radiochemical yield>10%, radiochemical purity>95%) to qualify for use in imaging.
18F-FLT PET-CT studies were performed using an integrated PET system (Discovery LS;
GE Medical Systems, Milwaukee, WI, USA), and the patients were scanned in the same posi-tion (immobilized with a head mask) as they were for the MRI scan. The imaging system en-abled the simultaneous acquisition of 35 transverse PET slices per FOV, with an axial sampling thickness of 4.25 mm, for a total axial FOV of 14.5 cm.
No specific dietary instructions were given to the patients before the18F-FLT PET-CT study. Patients rested for 15 minutes prior to the administration of FLT (374.2±36.7 MBq). Next, patients were instructed to rest peacefully for 53±6 minutes (used for uptake) after the in-jection. Noncontrast CT (parameters: 80 mA, 140 kV, 0.8 s/tube rotation, and reconstructed slice thickness of 4.25 mm) for attenuation correction was first performed covering the vertex of skull to the second cervical vertebra using a multi-detector helical CT scanner. PET was then acquired immediately in the three-dimensional mode with a scan time of 7 minutes per bed po-sition. Data were reconstructed using the ordered subsets expectation maximization (OSEM) algorithm with two iterations and 16 subsets, applying a matrix size of 128×128. The PET im-ages were viewed on a Xeleris workstation (GE Healthcare).
PET-CT and MRI-CT image fusion
All of the images were transferred to the Pinnacle3 treatment planning system (Philips Radia-tion Oncology Systems, Milpitas, CA, USA) for analysis. The Syntegra toolkit in the Pinnacle3 TPS was used to perform rigid body image registration automatically. The T1- and
T2-weighted MR images were aligned automatically with the CT images of PET-CT, respec-tively, using the normalized mutual information metric. Manual correction was then per-formed, if necessary, by the investigator and a senior staff member to mitigate the mismatching based on anatomies (such as clivus, orbital cavity, nasal cavity, lateral ventricles, mastoid air cells, and optic nerve) [24]. When contoured on the MR or PET images, the contours could be simply transferred and superimposed onto the CT image based on the fusion.
Image analysis
The images were analyzed visually by two experienced nuclear medicine radiologists indepen-dently. The maximum standardized uptake value (SUVmax) of the tumor was derived by
calculated as the mean SUV inside a commensurate ROI placed manually on the uninvolved contralateral hemisphere by referring to diagnostic MRI and MRS. If it was impossible to posi-tion the reference ROI at the contralateral hemisphere due to the tumor locaposi-tion, the ROI was placed on intact brain regions in the plane that showed the maximum18F-FLT uptake. The tumor-to-normal brain tissue (T/N) ratio was determined by dividing the SUVmaxof the
tumor by the SUVmeanof the reference brain tissue.
Biological and morphological tumor volume delineation
Each image data set was contoured by three investigators, and the final determination of tumor delineation was obtained by consensus among them. The residual tumor volume after surgery defined by the18F-FLT uptake was delineated semi-automatically in the18F-FLT PET images (Vol-PET). For the target margin in all of the patients, we used a threshold value of 2.0 for the T/N ratio (18). The high uptake regions in the normal tissues, such as the lacrimal glands or mucosa, were subtracted manually from the Vol-PET. The contrast-enhancement lesions on T1-weighted MRI after subtraction of the distinct areas of hemorrhage (defined on T1-native images) were contoured as Vol-T1. The hyperintense areas on the T2-weighted images, includ-ing residual tumor tissue, edema, post-operative changes, and the resection cavity, were delin-eated as Vol-T2. The volumes of18F-FLT uptake hyperactivity and the abnormal signal changes on MRI were calculated by the treatment planning system.
We also assessed the following parameters: 1) summed Vol: for those with18F-FLT uptake beyond the abnormity signal changes on MRI, or vice versa, the summed volume MRI/PET (summed Vol-T1/PET and summed Vol-T2/PET) were calculated; summed Vol-T1/PET = Vol-T1∪Vol-PET and summed Vol-T2/PET = Vol-T2∪Vol-PET, where∪indicates the sum; 2) intersection Vol: intersection Vol-T1/PET = Vol-T1\Vol-PET and intersection Vol-T2/PET = Vol-T2\Vol-PET, where\indicates the intersection; 3) the portion of Vol-PET that is not over-lapping with Vol-T1 (or Vol-T2) was defined as Vol-(PET minus T1) (or Vol-(PET minus T2)). The portion of Vol-T1 (or Vol-T2) that is not overlapping with Vol-PET was defined as Vol-(T1 minus PET) (or Vol-(T2 minus PET)). The maximum distance between the margin of FLT up-take and that of the MRI changes for each patient was quantified (in mm) in the CT image, which was fused with PET and MRI, respectively.
Results
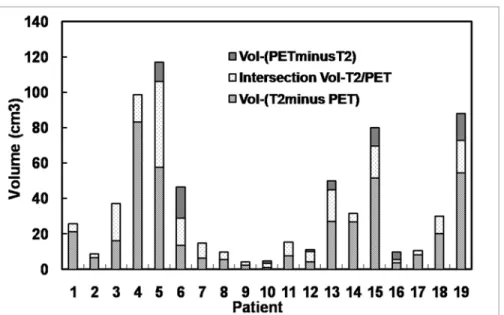
The comparisons between the tumor volumes defined by18F-FLT PET and MRI are presented inFig. 1andFig. 2, respectively. The statistical results are listed inTable 2andS1 Table.
The extents of Vol-PET and Vol-T2 differed in all 19 patients.18F-FLT uptake extended be-yond the scope of the hyperintense area in 8 of the 19 patients (42.11%); however, in all pa-tients (100%), the region of hyperintensity on T2-weighted MRI extended beyond the18F-FLT uptake area (Table 3andFig. 4).18F-FLT uptake was measured up to 24 mm (range, 0–24 mm) outside the margin of the hyperintense areas on T2-weighted MRI. In 2 (10.52%) of the 19 pa-tients,18F-FLT uptake extended beyond 20 mm from the margin of the hyperintense areas (Table 3andFig. 4).
Discussion
C-Fig 1. Comparison of tumor volumes defined by T1-weighted MRI with contrast enhancement and18 F-FLT PET.For all 19 cases, the mean Vol-T2 was 32.93 cm3(range, 3.3
–106.60 cm3). The average summed volume Vol-(T2∪PET) was 36.36 cm3, and the average intersection Vol-(T2\PET) was 11.12 cm3. The average
Vol-(T2 minus PET) was 21.78 cm3(range, 0.8–83.20 cm3), and the average Vol-(PET minus T2) was 3.43 cm3(range,
0–17.5 cm3).
doi:10.1371/journal.pone.0118769.g001
Fig 2. Comparison of tumor volumes defined by T2-weighted MRI and18F-FLT PET.Based on the PET/
CT and MRI/CT fusion images, the tumor contours derived from PET and MRI images were superimposed together on CT images and compared. In two patients (10.5%), the regions elevated between18F-FLT uptake in PET images and the Gd enhancement in T1-weighted MR images corresponded exactly to each other. In 14 patients (73.68%), the18F-FLT uptake was detected beyond the scope of Gd enhancement up to 35 mm from the tumor margin in MRI (range, 2–35 mm). In 5 (26.3%) of the 19 patients,18F-FLT uptake extended beyond 25 mm from the margin of Gd enhancement. Additionally, in 16 patients (84.2%), the Gd
enhancement was located outside the18F-FLT uptake range (Table 3andFig. 3).
methionine (MET) PET versus MRI (20). Perhaps, these findings could explain, to some extent, the distant or out-field failure patterns in patients with gliomas who underwent tumor resec-tion and post-operative radiotherapy. According to the method of target delinearesec-tion of GBM used by the Radiation Therapy Oncology Group (RTOG), the initial plan tumor volume (PTV) is defined as peri-tumoral edema plus a 2-cm margin, and the dose prescribed to this area is 46 Gy. The boost tumor volume (BTV) is defined as the contrast-enhanced area plus a 2.5-cm margin, and the dose prescribed to this area is 60 Gy [25,26]. If all of the18F-FLT-positive le-sions, including the portions not visible on MRI, are considered tumor tissues, the creation of PTV and BTV without integrating18F-FLT PET would have resulted in an insufficient PTV in two (10.53%) patients and insufficient BTV in five (26.32%) patients. These findings may have significant implications in the treatment strategy for patients with resected malignant glioma, for whom a major obstacle to effective radiation therapy is the inability to delineate the target volume precisely.
Presently, for anatomical delineation of target volumes and identification of organs at risk, MRI provides useful information and is considered the standard tool for the diagnosis and tar-get volume delineation in gliomas. However, evidence has shown that the margin of the con-trast-enhancement area or the peri-tumoral edema of the malignant gliomas defined by MRI was not sufficient [27]. Hochberg [28] reported that the malignant cells had the propensity to Table 2. Results of tumor volumes measured by18F-FLT PETvs. T1- and T2-weighted MRI (cm3).
Parameters Min Max Mean SD
Vol-PET 1.80 59.40 14.61 15.09
Vol-T1 1.70 78.20 13.60 18.58
Vol-T2 3.30 106.60 32.93 31.81
Intersection Vol-T1/PET 0.5 23.10 6.91 6.89
Summed Vol-T1/PET 2.20 78.2 21.24 22.16
Vol-(T1minus PET) 0.00 52.72 6.16 12.23
Vol-(PETminusT1) 0.00 51.60 7.71 12.68
Intersection Vol-T2/PET 1.80 48.40 11.12 11.18
Summed Vol-T2/PET 3.90 117.60 36.36 34.96
Vol-(T2 minus PET) 0.80 83.20 21.78 23.30
Vol-(PETminusT2) 0.00 17.50 3.43 5.69
For the entire group, the mean Vol-T1 was 13.60 cm3(range, 1.7
–78.20 cm3). The mean Vol-PET was 14.61 cm3(range, 1.8
–59.40 cm3). The average summed volume Vol-(T1∪PET) was 21.24 cm3, and the average summed Vol-(T1\PET) was 6.91 cm3. The mean Vol-(T1 minus PET) was 6.16 cm3
(range, 0–52.70 cm3), and the mean Vol-(PET minus T1) was 7.71 cm3(range, 0–51.60 cm3).
doi:10.1371/journal.pone.0118769.t002
Table 3. Comparison of tumor extent defined by18F-FLT uptake in PET image and abnormal signal change on MR image.
Outcomes N (%)
18F-FLT uptake corresponding exactly to contrast-enhancement 2 (10.53%) 18F-FLT uptake beyond abnormal contrast-enhancement 14 (73.68%)
Abnormal contrast-enhancement beyond18F-FLT uptake 16 (84.21%) 18F-FLT uptake corresponding exactly to hyperintensity areas 0 (0%)
18F-FLT uptake beyond hyper-intensity areas 8 (42.11%)
Hyper-intensity areas beyond18F-FLT uptake 19 (100%)
invade the peri-tumoral edema or normal-appearing brain parenchyma. Several reports have also shown that tumors infiltrate into areas congruent with an abnormal signal on MRI images, a finding confirmed by stereotactic biopsies [29,30]. The cause may be due to the frequent in-ability to distinguish a persistent tumor from reparative changes after surgery, and the true ex-tension of the remaining tumor may be under- or overestimated by MRI [31].
PET, as a molecular imaging tool, provides another way to visualize residual tumor in post-operative glioma patients.18F-FDG is the most widely used PET tracer in various malignancies. However, the specificity of18F-FDG is low for brain tumors because of its high uptake in the normal brain cortex.11C-MET, a natural amino acid, is another radiopharmaceutical that can be used for brain tumor imaging [32]. It is taken up avidly by glioma cells, and the uptake by normal brain tissue is relatively low.11C-MET PET has shown promise for delineating the mar-gins of gliomas [33]. It has been suggested that11C-MET PET has greater accuracy in outlining the true extent of viable tumor tissue compared with MRI and CT [34]. Tumors in patients
Fig 4. MRI and18F-FLT PET-CT images from a patient with GBM.Images were taken 21 days post-operatively and 2 days before radiotherapy. a. T2-weighted MRI. b.18F-FLT PET image. c. CT image of PET-CT scan. Residual tumor regions defined by T2-MRI (blue line) and18F-FLT PET (yellow line) are superimposed on the CT image.
doi:10.1371/journal.pone.0118769.g004
Fig 3. MRI and18F-FLT PET images for a patient with glioblastoma (GBM).Images were taken 21 days post-operatively and 2 days before radiotherapy.
a. T1-weighted MRI with contrast enhancement. b.18F-FLT PET images. c. CT image of PET-CT scan. Residual tumor regions defined by T1-MRI (red line) and18F-FLT PET (yellow line) are superimposed on the CT image.
tended to progress in regions that showed high11C-MET uptake but were not covered by the high radiation dose from radiation therapy [35]. However, the short half-life of11C limited the application of this tracer in clinical practice.
The 109-minute half-life of18F makes18F-FLT PET scanning possible at centers without an in-house cyclotron facility and makes this tracer ideal for brain imaging in oncology. There is a sharp border between residual tumor tissue and healthy brain tissue because of the low uptake of18F-FLT in intact brain tissue. Thus,18F-FLT PET is considered an attractive imaging meth-od for malignant brain tumors. Earlier studies have shown that18F-FLT PET has a high sensi-tivity and specificity for diagnosing high-grade gliomas, and the uptake of18F-FLT was correlated with tumor proliferation [36]. Regarding post-operative radiation therapy planning, it is desirable that the additional information from18F-FLT PET can help correct the evaluation of the surgical results and help define the gross tumor volume (GTV) and clinical tumor vol-ume (CTV) with high accuracy, which is impossible to achieve 1–8 weeks after surgery using anatomical imaging alone [13]. In our study, as mentioned above, the volume of residual tumor defined using18F-FLT PET images was different from that drawn on MR images. The latter finding was consistent with that in the study by Idemaet al. [37], which observed that the intracerebral uptake of18F-FLT was not limited to areas of contrast enhancement as seen on MRI and, in fact, exceeded the area of contrast enhancement on MRI in most cases. These find-ings indicated that18F-FLT PET provides additional information compared with MRI in defin-ing target volumes in high-grade glioma, particularly for the boost volumes.
In addition to the above findings, we found that the extension of18F-FLT uptake outside of the MRI abnormal signal areas was not distributed uniformly around the Vol-T1 and Vol-T2 (Figs.3and4). Therefore, a uniform margin for PTV around the target drawn on MR images does not ensure covering the residual tumor adequately in the radiation fields. There is an im-portant role for18F-FLT PET in the delineation of residual disease from the post-surgical changes that, consequently, will influence target volume delineation in radiotherapy. The latter observation may be the most crucial for decreasing recurrence and improving prognosis, in-cluding both the survival time and quality of life.
In our study, we found that the integration of18F-FLT- PET into tumor volume delineation for gliomas had another important effect—improved sparing of the normal brain tissue. Con-trast-enhancement and edema regions in MRI extended outside the18F-FLT uptake region in 16 patients (84.2%) and 19 patients (100%), respectively. The mean volumes of the MRI abnor-mal areas beyond the high18F-FLT uptake region were 6.16 cm3on T1-weighted MRI and 21.78 cm3on T2-weighted MRI. If the T1 abnormal enhancement and T2 hyperintensity areas outside the18F-FLT uptake were a result of the surgery, these regions should not be included in the GTV for radiotherapy planning and should be spared from the high radiation dose.
as shown in mathematical models indicating that dose escalation has a possible positive effect on survival [38,39]. In addition to this, our study did not perform dynamic PET scanning, although the proliferation index correlates best with the Ki derived from dynamic PET [40]. Considering that previous studies have shown a good correlation between the SUVmaxand Ki-67 index (15),
and that the calculation of the residual tumor volume does not require a kinetic model, use of a single time point for PET scanning was acceptable in our study.
Conclusions
The post-operative residual tumor volumes defined by18F-FLT uptake in PET images and ab-normalities on post-operative MR images were not in complete concordance.18F-FLT PET provides additional information, compared with MRI, to the target volume definition in high-grade gliomas, particularly for the boost volumes. Incorporation of18F-FLT PET data into the target volume definition may potentially improve residual tumor detection, as well as improve tumor control while reducing complications.
Supporting Information
S1 Table. Patient characteristics and results of volumetric measurements of T1 and T2-weighted MRI vs. FLT-PET in 19 patients with resected malignant gliomas.
(PDF)
Acknowledgments
We thank the staff of the PET/CT Center and Department of Radiology, Shandong Cancer Hospital & Institute, particularly Shuqiang Zhao, Jinsong Zheng, Li Ma, Xiaorong Sun, and Shanshan Li, for their technical support.
Author Contributions
Conceived and designed the experiments: JY ZW. Performed the experiments: FZ ML ZF ZC. Analyzed the data: FZ ZW ML. Contributed reagents/materials/analysis tools: ZC ZF ML YC. Wrote the paper: FZ ZW YC.
References
1. Stupp R, Mason WP, van den Bent MJ, Weller M, Fisher B, Taphoorn MJ, et al. Radiotherapy plus con-comitant and adjuvant temozolomide for glioblastoma. N Engl J Med. 2005; 352:987–996. PMID: 15758009
2. Garden AS, Maor MH, Yung WK, Bruner JM, Woo SY, Moser RP, et al. Outcome and patterns of failure following limited-volume irradiation for malignant astrocytomas. Radiother Oncol. 1991; 20:99–110. PMID:1851573
3. Aydin H, Sillenberg I, von Lieven H. Patterns of failure following CT-based 3-D irradiation for malignant glioma. Strahlenther Onkol. 2001; 177:424–431. PMID:11544905
4. Sherriff J, Tamangani J, Senthil L, Cruickshank G, Spooner D, Jones B, et al. Patterns of relapse in glio-blastoma multiforme following concomitant chemoradiotherapy with temozolomide. Brit J Radiol. 2013 Feb: 20120414. doi:10.1259/bjr.20120414PMID:23385995
5. Majos C, Alonso J, Aguilera C, Serrallonga M, Acebes JJ, Arus C, et al. Adult primitive neuroectodermal tumor: proton MR spectroscopic findings with possible application for differential diagnosis. Radiology. 2002; 225:556–566. PMID:12409595
7. Gupta RK, Cloughesy TF, Sinha U, Garakian J, Lazareff J, Rubino G, et al. Relationships between cho-line magnetic resonance spectroscopy, apparent diffusion coefficient and quantitative histopathology in human glioma. J Neuro-oncol. 2000; 50:215–226.
8. Mardor Y, Pfeffer R, Spiegelmann R, Roth Y, Maier SE, Nissim O, et al. Early detection of response to radiation therapy in patients with brain malignancies using conventional and high b-value diffusion-weighted magnetic resonance imaging. J Clin Oncol. 2003; 21:1094–1100. PMID:12637476
9. Barajas RF Jr, Chang JS, Segal MR, Parsa AT, McDermott MW, Berger MS, et al. Differentiation of re-current glioblastoma multiforme from radiation necrosis after external beam radiation therapy with dy-namic susceptibility-weighted contrast-enhanced perfusion MR imaging. Radiology. 2009;
253:486–496. doi:10.1148/radiol.2532090007PMID:19789240
10. Thornton AF Jr, Sandler HM, Ten Haken RK, McShan DL, Fraass BA, La Vigne ML, et al. The clinical utility of magnetic resonance imaging in 3-dimensional treatment planning of brain neoplasms. Int J Radiat Oncol Biol Phys. 1992; 24:767–775. PMID:1429103
11. Kelly PJ, Daumas-Duport C, Scheithauer BW, Kall BA, Kispert DB. Stereotactic histologic correlations of computed tomography- and magnetic resonance imaging-defined abnormalities in patients with glial neoplasms. Mayo Clinic proceedings. 1987; 62:450–459. PMID:3553757
12. Chamberlain MC, Murovic JA, Levin VA. Absence of contrast enhancement on CT brain scans of pa-tients with supratentorial malignant gliomas. Neurology. 1988; 38:1371–1374. PMID:2842701
13. Chen W, Cloughesy T, Kamdar N, Satyamurthy N, Bergsneider M, Liau L, et al. Imaging proliferation in brain tumors with 18F-FLT PET: comparison with 18F-FDG. J Nucl Med. 2005; 46:945–952. PMID: 15937304
14. Choi SJ, Kim JS, Kim JH, Oh SJ, Lee JG, Kim CJ, et al. [18F]30
-deoxy-30
-fluorothymidine PET for the di-agnosis and grading of brain tumors. Eur J Nucl Med Mol Imaging. 2005; 32:653–659. PMID:15711980
15. Saga T, Kawashima H, Araki N, Takahashi JA, Nakashima Y, Higashi T, et al. Evaluation of primary brain tumors with FLT-PET: usefulness and limitations. Clin Nucl Med. 2006; 31:774–780. PMID: 17117071
16. Spence AM, Muzi M, Link JM, O’Sullivan F, Eary JF, Hoffman JM, et al. NCI-sponsored trial for the eval-uation of safety and preliminary efficacy of 30
-deoxy-30
-[18F]fluorothymidine (FLT) as a marker of prolif-eration in patients with recurrent gliomas: preliminary efficacy studies. Mol Imaging Biol. 2009; 11:343–355. doi:10.1007/s11307-009-0215-2PMID:19326172
17. Schwarzenberg J, Czernin J, Cloughesy TF, Ellingson BM, Pope WB, Geist C, et al. 30
-deoxy-30
-18F-fluorothymidine PET and MRI for early survival predictions in patients with recurrent malignant glioma treated with bevacizumab. J Nucl Med. 2012; 53:29–36. doi:10.2967/jnumed.111.092387PMID: 22159180
18. Jacobs AH, Thomas A, Kracht LW, Li H, Dittmar C, Garlip G, et al. 18F-fluoro-L-thymidine and 11C-methylmethionine as markers of increased transport and proliferation in brain tumors. J Nucl Med. 2005; 46:1948–1958. PMID:16330557
19. Pirzkall A, McKnight TR, Graves EE, Carol MP, Sneed PK, Wara WW, et al. MR-spectroscopy guided target delineation for high-grade gliomas. Int J Radiat Oncol Biol Phys. 2001; 50:915–928. PMID: 11429219
20. Grosu AL, Weber WA, Riedel E, Jeremic B, Nieder C, Franz M, et al. L-(methyl-11C) methionine posi-tron emission tomography for target delineation in resected high-grade gliomas before radiotherapy. Int J Radiat Oncol Biol Phys. 2005; 63:64–74. PMID:16111573
21. Matsuo M, Miwa K, Tanaka O, Shinoda J, Nishibori H, Tsuge Y, et al. Impact of [11C]methionine posi-tron emission tomography for target definition of glioblastoma multiforme in radiation therapy planning. Int J Radiat Oncol Biol Phys. 2012; 82:83–89. doi:10.1016/j.ijrobp.2010.09.020PMID:21095072
22. Rieken S, Habermehl D, Giesel FL, Hoffmann C, Burger U, Rief H, et al. Analysis of FET-PET imaging for target volume definition in patients with gliomas treated with conformal radiotherapy. Radiother Oncol. 2013; 109:487–492. doi:10.1016/j.radonc.2013.06.043PMID:23953407
23. Yue J, Chen L, Cabrera AR, Sun X, Zhao S, Zheng F, et al. Measuring tumor cell proliferation with 18F-FLT PET during radiotherapy of esophageal squamous cell carcinoma: a pilot clinical study. J Nucl Med. 2010; 51:528–534. doi:10.2967/jnumed.109.072124PMID:20237030
24. Grosu AL, Lachner R, Wiedenmann N, Stark S, Thamm R, Kneschaurek P, et al. Validation of a method for automatic image fusion (BrainLAB System) of CT data and 11C-methionine-PET data for stereotac-tic radiotherapy using a LINAC: first clinical experience. Int J Radiat Oncol Biol Phys. 2003;
56:1450–1463. PMID:12873691
26. Urtasun RC, Kinsella TJ, Farnan N, DelRowe JD, Lester SG, Fulton DS. Survival improvement in ana-plastic astrocytoma, combining external radiation with halogenated pyrimidines: final report of RTOG 86–12, Phase I-II study. Int J Radiat Oncol Biol Phys. 1996; 36:1163–1167. PMID:8985039
27. Chang EL, Akyurek S, Avalos T, Rebueno N, Spicer C, Garcia J, et al. Evaluation of peritumoral edema in the delineation of radiotherapy clinical target volumes for glioblastoma. Int J Radiat Oncol Biol Phys.2007; 68:144–150. PMID:17306935
28. Hochberg FH, Pruitt A. Assumptions in the radiotherapy of glioblastoma. Neurology. 1980; 30:907–911. PMID:6252514
29. Watanabe M, Tanaka R, Takeda N. Magnetic resonance imaging and histopathology of cerebral glio-mas. Neuroradiology. 1992; 34:463–469. PMID:1436452
30. Kelly PJ, Daumas-Duport C, Kispert DB, Kall BA, Scheithauer BW, Illig JJ. Imaging-based stereotaxic serial biopsies in untreated intracranial glial neoplasms. J Neurosugy. 1987; 66:865–874.
31. Wen PY, Macdonald DR, Reardon DA, Cloughesy TF, Sorensen AG, Galanis E, et al. Updated re-sponse assessment criteria for high-grade gliomas: rere-sponse assessment in neuro-oncology working group. J Clin Oncol. 2010; 28:1963–1972. doi:10.1200/JCO.2009.26.3541PMID:20231676
32. Ogawa T, Shishido F, Kanno I, Inugami A, Fujita H, Murakami M, et al. Cerebral glioma: evaluation with methionine PET. Radiology. 1993; 186:45–53. PMID:8380108
33. Kaschten B, Stevenaert A, Sadzot B, Deprez M, Degueldre C, Del Fiore G, et al. Preoperative evalua-tion of 54 gliomas by PET with fluorine-18-fluorodeoxyglucose and/or carbon-11-methionine. J Nucl Med. 1998; 39:778–785. PMID:9591574
34. Mosskin M, Ericson K, Hindmarsh T, von Holst H, Collins VP, Bergstrom M, et al. Positron emission to-mography compared with magnetic resonance imaging and computed toto-mography in supratentorial gli-omas using multiple stereotactic biopsies as reference. Acta radiologica. 1989; 30:225–232. PMID: 2660886
35. Lee IH, Piert M, Gomez-Hassan D, Junck L, Rogers L, Hayman J, et al. Association of 11C-methionine PET uptake with site of failure after concurrent temozolomide and radiation for primary glioblastoma multiforme. Int J Radiat Oncol Biol Phys. 2009; 73:479–485. doi:10.1016/j.ijrobp.2008.04.050PMID: 18834673
36. Barwick T, Bencherif B, Mountz JM, Avril N. Molecular PET and PET/CT imaging of tumour cell prolifer-ation using F-18 fluoro-L-thymidine: a comprehensive evaluprolifer-ation. Nucl Med Commun. 2009; 30:908– 917. doi:10.1097/MNM.0b013e32832ee93bPMID:19794320
37. Idema AJ, Hoffmann AL, Boogaarts HD, Troost EG, Wesseling P, Heerschap A, et al. 30
-Deoxy-30
-18F-fluorothymidine PET-derived proliferative volume predicts overall survival in high-grade glioma pa-tients. J Nucl Med. 2012; 53:1904–1910. doi:10.2967/jnumed.112.105544PMID:23077112
38. Kirkby NF, Jefferies SJ, Jena R, Burnet NG. A mathematical model of the treatment and survival of pa-tients with high-grade brain tumours. J Theor Biol. 2007; 245:112–124. PMID:17084863
39. Meral R. Comment on: Mathematical modelling of survival of glioblastoma patients suggests a role for radiotherapy dose escalation and predicts poorer outcome after delay to start treatment (Burnet et al. Clin Oncol 2006; 18:93–103. PMID:16969995
40. Ullrich R, Backes H, Li H, Kracht L, Miletic H, Kesper K, et al. Glioma proliferation as assessed by 30
-fluoro-30