www.hydrol-earth-syst-sci.net/16/2893/2012/ doi:10.5194/hess-16-2893-2012
© Author(s) 2012. CC Attribution 3.0 License.
Earth System
Sciences
Towards an integrated soil moisture drought monitor for East Africa
W. B. Anderson1, B. F. Zaitchik2, C. R. Hain3, M. C. Anderson4, M. T. Yilmaz4, J. Mecikalski5, and L. Schultz5 1Department of Geography and Environmental Engineering, The Johns Hopkins University, Baltimore, MD, USA 2Department of Earth and Planetary Sciences, The Johns Hopkins University, Baltimore, MD, USA
3Earth System Science Interdisciplinary Center, University of Maryland, College Park, MD, USA 4Hydrology and Remote Sensing Laboratory, USDA-ARS, Beltsville, MD, USA
5Atmospheric Science Department, National Space Science and Technology Center, University of Alabama in Huntsville, Huntsville, AL 35805, USA
Correspondence to:W. B. Anderson (weston.b.anderson@gmail.com)
Received: 19 March 2012 – Published in Hydrol. Earth Syst. Sci. Discuss.: 5 April 2012 Revised: 29 June 2012 – Accepted: 26 July 2012 – Published: 22 August 2012
Abstract.Drought in East Africa is a recurring phenomenon with significant humanitarian impacts. Given the steep cli-matic gradients, topographic contrasts, general data scarcity, and, in places, political instability that characterize the re-gion, there is a need for spatially distributed, remotely de-rived monitoring systems to inform national and international drought response. At the same time, the very diversity and data scarcity that necessitate remote monitoring also make it difficult to evaluate the reliability of these systems. Here we apply a suite of remote monitoring techniques to charac-terize the temporal and spatial evolution of the 2010–2011 Horn of Africa drought. Diverse satellite observations al-low for evaluation of meteorological, agricultural, and hy-drological aspects of drought, each of which is of interest to different stakeholders. Focusing on soil moisture, we ap-ply triple collocation analysis (TCA) to three independent methods for estimating soil moisture anomalies to charac-terize relative error between products and to provide a ba-sis for objective data merging. The three soil moisture meth-ods evaluated include microwave remote sensing using the Advanced Microwave Scanning Radiometer – Earth Observ-ing System (AMSR-E) sensor, thermal remote sensObserv-ing us-ing the Atmosphere-Land Exchange Inverse (ALEXI) sur-face energy balance algorithm, and physically based land surface modeling using the Noah land surface model. It was found that the three soil moisture monitoring methods yield similar drought anomaly estimates in areas character-ized by extremely low or by moderate vegetation cover, par-ticularly during the below-average 2011 long rainy season. Systematic discrepancies were found, however, in regions of
moderately low vegetation cover and high vegetation cover, especially during the failed 2010 short rains. The merged, TCA-weighted soil moisture composite product takes advan-tage of the relative strengths of each method, as judged by the consistency of anomaly estimates across independent meth-ods. This approach holds potential as a remote soil moisture-based drought monitoring system that is robust across the di-verse climatic and ecological zones of East Africa.
1 Introduction
The 2010–2011 Horn of Africa drought affected over 13 million people (Ledwith, 2011). The failure of the Octo-ber to DecemOcto-ber 2010 “short” rains and delayed arrival of the April to June 2011 “long” rains caused crop failures across Somalia, Ethiopia and Kenya. The price of food reflected the effect of crop failures on a food-insecure region; the price of maize in Kenya, for example, rose 246 % over the span of a year (Funk, 2011). On 7 June 2011, the Famine Early Warn-ing System Network (FEWS NET) issued a statement declar-ing the crisis to be “the most severe food security emergency in the world today”. Over the course of the next two months, the crises worsened and the United Nations declared famine in five regions of Somalia (United Nations, 2011).
resilience due to poor harvests and rangeland conditions in recent years were recognized as a significant risk to the re-gion (Funk, 2011). Given such warnings – albeit warnings that come with substantial uncertainty – national govern-ments and international actors were in position to respond quickly when the rains failed. The failure to muster adequate disaster mitigation can be attributed largely to political in-stability and to the limitations of what can be accomplished in reactive drought response. At the same time, adequate emergency intervention is also limited by inadequate access to reliable, spatially distributed drought monitoring informa-tion available in near real-time. In situ monitoring networks, though critical to drought planning and response, are limited in this regard, both practically and inherently. While the Horn of Africa has limited networks and is affected by political in-stability, even if measurements were available, it would be difficult to capture the spatial variability of drought impacts using point monitoring stations alone.
For this reason, there has been considerable interest in de-veloping East African drought monitoring systems based on remotely sensed and model-derived analyses. The most ad-vanced of these systems is the Famine Early Warning Sys-tem Network (FEWS NET), which operates throughout East Africa, Afghanistan, and Central America. A United States Agency for International Development (USAID) project in operation since 1985, FEWS NET combines local socio-economic information with agricultural production and pre-cipitation information to predict food security conditions (Funk, 2009). Satellite data feed into the system in the form of remotely sensed vegetation indices and precipita-tion estimates, while a Water Requirements Satisfacprecipita-tion In-dex (WRSI) model is used to gauge crop conditions. Ad-ditional remote drought monitors covering East Africa in-clude the Experimental African Drought Monitor maintained by the Land Surface Hydrology Group at Princeton, which provides near real-time drought monitoring for all of Africa using the variable infiltration capacity (VIC) hydrological model and a long-term retrospective meteorological reanaly-sis (Sheffield et al., 2008) to quantify current drought condi-tions across the continent1. The International Research Insti-tute for Climate and Society Map Room2serves regional pre-cipitation anomaly maps derived from the Climate Anomaly Monitoring System Outgoing Longwave Radiation Precipi-tation Index (CAMS OMI; Janowiak and Xie, 1999), while the Global Drought Monitor provides drought monitoring that includes coverage of Africa at a spatial resolution of
∼100 km and at monthly intervals3. The Global Drought Monitor is based on the Standardized Precipitation Index (SPI) and the Palmer Drought Severity Index (PDSI).
Outside of Africa, there are numerous examples of experi-mental and operational drought monitoring systems that rely
1http://hydrology.princeton.edu/monitor
2http://iridl.ldeo.columbia.edu/maproom/ 3http://drought.mssl.ucl.ac.uk
on either remote sensing or hydrological models. In the US, these include the Vegetation Drought Response Index (Veg-DRI), which monitors drought conditions for the continen-tal US by combining climate-related variables with satellite-derived vegetation condition information obtained using Ad-vanced Very High Resolution Radiometer (AVHRR)-based vegetation indices (Brown, 2010), and the University of Washington Experimental Surface Water Monitor (Wood, 2008), based on a multi-model monitor employing VIC (Liang et al., 1994), Sacramento Soil Moisture Account-ing (SAC-SMA; Burnash, 1995), Community Land Model (CLM; Dai et al., 2003; Lawrence et al., 2011), Catchment (Koster et al., 2000), and Noah (Chen et al., 1996; Ek et al., 2003; Koren et al., 1999) land-surface models (LSMs). Other AVHRR-derived drought indices include the Vege-tation Condition Index (VCI), derived from AVHRR Nor-malized Difference Vegetation Index (NDVI) data and the Temperature Condition Index (TCI), which is calculated us-ing AVHRR thermal data (Kogan, 1990, 1995), as well as the Vegetation Health Index (VHI) which combines the VCI and TCI (Kogan, 1997). Remotely sensed land-surface tem-perature and vegetation cover information have also been combined within the Atmosphere-Land Exchange Inverse (ALEXI) surface energy balance algorithm (Anderson et al., 1997, 2007a) to generate an Evaporative Stress Index (ESI), quantifying anomalies in the ratio of actual to potential evap-otranspiration (Anderson et al., 2011a,b).
Combined satellite/model drought monitoring tools are also becoming more common. Data assimilation systems merge observations with physically based models, using the model to provide spatially and temporally complete esti-mates of all drought-relevant hydrologic variables and the observation record to correct for model error. Examples in-clude the North American Land Data Assimilation System (NLDAS; Sheffield et al., 2012; Xia et al., 2012) and Grav-ity Recovery and Climate Experiment (GRACE) Data As-similation System4Drought Monitors. The NLDAS Drought Monitor covers the continental US and is based on output from the Mosaic (Koster and Suarez, 1996), VIC (Liang et al., 1994), Sacramento Soil Moisture Accounting (SAC-SMA; Burnash, 1995), and Noah (Chen et al., 1996; Ek et al., 2003; Koren et al., 1999) LSMs. These models are un-coupled and forced mainly by observational data to avoid numerical weather prediction forcing biases. Anomalies and percentiles in soil moisture, stream flow and runoff are com-puted for each individual model and for ensemble averages with respect to climatological normal conditions computed for 1980 to 20075(Sheffield et al., 2012; Xia et al., 2012). The GRACE Data Assimilation System Drought Monitor produces weekly updated soil moisture and drought indi-cators. Terrestrial water storage observations from GRACE
4http://drought.unl.edu/MonitoringTools/
NASAGRACEDataAssimilation.aspx
satellite data are integrated with additional meteorological measurements using an ensemble Kalman filter within the Catchment Land Surface Model (Zaitchik et al., 2008). Cur-rent hydrologic conditions are expressed as percentiles rela-tive to baseline measurements from 1948 to 2009.
For all of the value that these satellite- and model-based drought monitors provide, a monitoring system based on a single algorithm or observational record is prone to system-atic and/or transient error. This is a particular concern in data poor regions like East Africa, where it is not possible to eval-uate a remote drought monitor comprehensively against in situ observations. In this context, it is desirable to apply mul-tiple, independent methods to remote drought monitoring in order to characterize systematic differences between meth-ods, to identify and address limitations in particular tech-niques, and to generate consensus drought indices. Merging independent methods to generate a consensus drought index will help reduce the random and systematic error components of the input datasets.
In this paper, we examine the 2010–2011 Horn of Africa drought using remotely sensed estimates of soil moisture, evapotranspiration, precipitation, and terrestrial water stor-age. The relative merits of each observational technique are discussed in qualitative terms, and soil moisture estimates are then assessed quantitatively and merged into a consen-sus drought monitor product by applying a least squares al-gorithm that depends on triple collocation analysis (TCA)-based errors associated with soil moisture anomalies derived from ALEXI, AMSR-E, and the Noah LSM. TCA is a sta-tistical method for characterizing consensus and discrepan-cies across multiple independent datasets. Though developed originally for oceanographic applications (Stoffelen, 1998), the method has recently been applied successfully to the problem of estimating soil moisture variability at regional to global scale (Scipal et al., 2008; Hain et al., 2011; Pari-nussa et al., 2011; Yilmaz et al., 2012). TCA is of particu-lar value in regions that lack in situ soil moisture monitoring networks, as consensus anomaly estimates derived from mul-tiple independent datasets can be interpreted as a measure of confidence in the absence of adequate in situ evaluation data. The least squares-based merging technique applied to these TCA-based error estimates was chosen as an objective offline merging method, because it requires minimal assumptions be made about the input datasets and their error characteristics.
2 Methods
2.1 Soil moisture estimates
2.1.1 AMSR-E passive microwave sensor
The Advanced Microwave Scanning Radiometer for EOS (AMSR-E) is a passive microwave-radiometer system mounted on the Aqua satellite. From July 2002 to
September 2011, AMSR-E retrievals of microwave bright-ness temperature were used to derive estimates of surface soil moisture with near-daily coverage. The instrument is cur-rently experiencing an antenna malfunction that may be ter-minal, but similar microwave measurements are available on existing and planned satellite missions. Several algorithms have been developed to estimate soil moisture on the basis of AMSR-E retrievals. In this application, we use the soil moisture product derived using the Land Parameter Retrieval Model (LPRM) developed by Vrije Universiteit Amsterdam (VUA) and the National Aeronautics and Space Adminis-tration (NASA). The LPRM algorithm relies on C-band ob-servations and can utilize X-band obob-servations under condi-tions of radio frequency interference in the C-band (Owe et al., 2008). The LPRM product was chosen over other avail-able AMSR-E soil moisture products on the basis of pre-viously published comparisons (Rudiger et al., 2008; Wag-ner et al., 2007; Draper et al., 2009; Hain et al., 2011). The product produces daily ascending and descending estimates at 01:30 a.m. and 01:30 p.m. (local time). To avoid compli-cations such as sun glint and strong temperature gradients, which are more prevalent in the ascending passes when using the VUA algorithm, only descending passes (01:30 a.m. LT) of the AMSR-E measurements were used (Kerr and Njoku, 1990; Crow et al., 2010).
While the temporal resolution of AMSR-E is relatively high, the spatial resolution remains coarse at∼25 km with a sensing depth of only∼1 cm. The native spatial resolution of AMSR-E and the remapping used in the LPRM algorithm are further discussed in Sect. 2.3.
2.1.2 ALEXI thermal infrared model
water. A relation betweenfPET and retrieved soil moisture values based on ALEXI estimates offPET may be derived that is of the following form:
θALEXI = θfc−θwp·fPET+θwp (1) whereθALEXIis the soil moisture value reported by ALEXI, θfcandθwpare the soil moisture at field capacity and wilting point, respectively, andfPET is the fraction of actual to po-tential evapotranspiration. Note that while Eq. (1) requires information about SM at field capacity and wilting point, these values drop out during the computation of standard-ized grid cell anomalies describing the deviation from mean conditions for each 8-day composite period at each pixel in the study period. Hain et al. (2009) validated this relationship by comparing soil moisture observations from the Oklahoma Mesonet to ALEXI soil moisture retrievals.
ALEXI was executed at 6-km spatial resolution over the Horn of Africa domain using hourly land-surface temper-ature and insolation products developed by the Land Sur-face Analysis Satellite Applications Facility (LSA SAF), us-ing imagery from the primary Meteosat Second Generation (MSG) geostationary satellite (landsaf.meteo.pt) (see Ander-son et al., 2011b). ALEXI output was then aggregated to the 25-km grid associated with the AMSR-E product. As a ther-mal remote sensing model, ALEXI is limited to cloud-free sky conditions during the morning hours when the ground is visible to the thermal satellite sensor.
2.1.3 Noah land surface model
Offline simulations of Noah LSM version 3.2 were per-formed using Global Data Assimilation System (Derber et al., 1991) meteorological forcing supplemented by the three hourly precipitation estimates from the gauge-adjusted Trop-ical Rainfall Measurement Mission (TRMM) Multisensor Precipitation Analysis (TMPA), version 6 (product 3B42; Huffman et al., 2007). Noah is a one-dimensional model that evaluates the surface energy and water budgets to cal-culate the distribution of soil moisture in the soil column. Evapotranspiration is defined as the sum of canopy transpi-ration, evaporation from the top soil layer, and evaporation of canopy-intercepted water (Ek et al., 2003; Chen et al., 1996). Soil moisture is a prognostic field for each of the model’s four vertical soil layers, which allows for the diagnosis of both near-surface and root zone soil moisture.
An LSM-based prediction of soil moisture offers the ben-efit of providing continuous estimates under all weather and surface cover conditions, as opposed to ALEXI and AMSR-E, which are hindered by clouds and dense vegeta-tion, respectively. Model output was stored and evaluated at three-hour intervals, but only outputs aligned with the over-pass times of AMSR-E retrievals were used in this anal-ysis to ensure a consistent comparison. The AMSR-E de-scending overpass time for the Horn of Africa is 04:30 GMT which corresponds to the 03:00–06:00 GMT output interval
of Noah. Model simulations were run at a spatial resolution of 25 km to match the spatial resolution of the AMSR-E mea-surements. Noah simulations in this region are the subject of ongoing evaluation, with early results indicating that sim-ulations forced with GDAS meteorology supplemented by TMPA precipitation provide reasonable results over much of the Nile Basin and surroundings (Zaitchik et al., 2010).
2.2 Supplementary satellite-derived observations
Additional data sources were included in the anomaly anal-yses to depict a more complete hydrologic picture. For all datasets, we compiled gridded data for East Africa for the period 2003–2011 and then calculated anomalies relative to the 2003–2010 climatology:
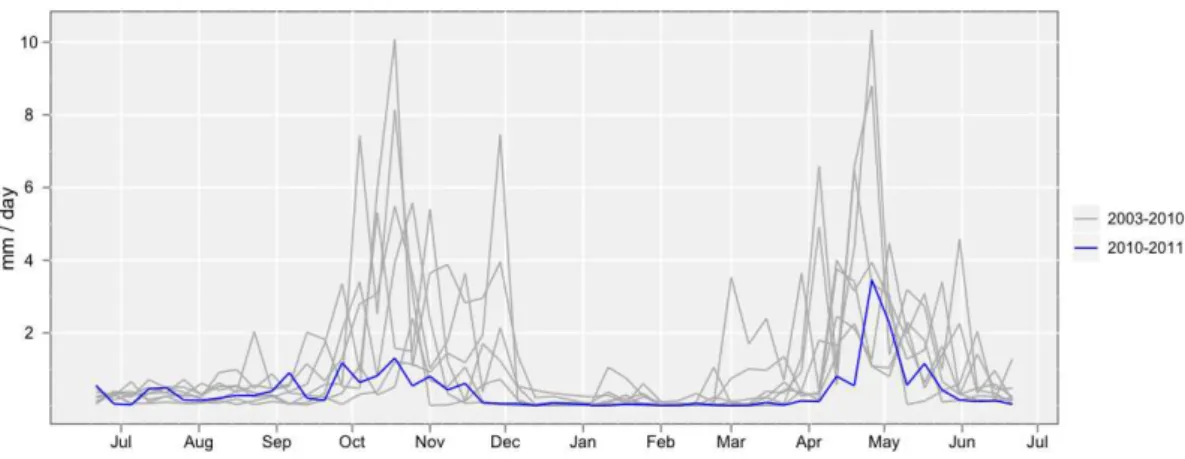
– precipitation: three hourly TMPAv6 precipitation esti-mates (25 km resolution), averaged over 8-day compos-ite periods, were used to compare the 2010–2011 sea-sonal rains to those from 2003–2010.
– vegetation index: 16-day, 0.05◦ resolution compos-ited MODerate Resolution Imaging Spectroradiometer (MODIS) NDVI estimates (product MOD13C1; Huete et al., 2002) were used to evaluate drought impacts on biomass production.
– terrestrial water storage: monthly estimates of terres-trial water storage anomaly derived from GRACE were used as an independent assessment of drought condi-tions. GRACE anomalies for the area of interest were extracted from the CSR level 2 GRACE gridded land product, release 4, with a 300 km smoothing radius. Land scaling factors were included in data extraction (Swenson and Wahr, 2006)6.
2.3 Comparison and data merging
For TCA, the three independent soil moisture datasets (LPRM, Noah and ALEXI) were standardized to a common spatial resolution, depth, frequency, and unit of measure.
2.3.1 Resampling to a common grid
Each dataset was resampled using a nearest neighbor resam-ple to match the 0.25×0.25◦flat grid of the LPRM data. The ALEXI model was run with a 6 km spatial resolution, which necessitated an aggregation of the data prior to resampling. The Noah LSM was run at 25 km spatial resolution, requiring only a resample to match the chosen grid.
6GRACE land data were processed by Sean Swenson, supported
2.3.2 Creating composite time periods
Although each methodology is capable of producing daily measurements for the domain of the analysis under favorable conditions, the satellite-derived records suffered from data gaps. LPRM gaps are a product of the overpass repeat cycle of Aqua, which results in spatial swaths of missing data on a regular repeat cycle, and of interference from precipitation, dense vegetation, radio signals or frozen ground. Retrievals that were flagged as poor quality due to such interference were removed from the analysis. Missing values were present in the ALEXI model, because the algorithm requires morning observations of radiometric surface temperature, which can only be observed for cloud-free regions. This creates season-ally repeating areas of sparse data coverage in climatologi-cally cloudy regions. Gap-filling algorithms for ALEXI have been developed to generate daily ET estimates (Anderson et al., 2007a), but they were not utilized in this study so as to focus only on direct retrievals of soil moisture (rather than in-terpolated values). Eight-day composites across the period of study were created for each dataset to avoid oversampling in the analysis due to seasonal weather events. All available ob-servations were averaged within a given compositing period.
2.3.3 Estimating root zone soil moisture for all products
To standardize the depth of soil moisture estimate across LPRM, ALEXI, and Noah, each dataset was converted to an estimate of soil moisture through the root zone. For this study, the root zone was defined as the top 1 m of the soil column.
ALEXI provides a single column-integrated soil moisture estimate that reflects soil moisture from the surface to the rooting depth of the vegetation: surface soil wetness cools the surface through direct evaporation, while root zone soil moisture leads to cooling through plant transpiration. The degree to which near-surface vs. deeper root zone soil mois-ture influences the ALEXI signal is assumed to be related to the observed green vegetation cover fraction (fc; Hain et al., 2009, 2011), as described further below.
The Noah LSM produces a stratified soil moisture esti-mate that is divided into four layers: 0–10 cm, 10–40 cm, 40– 100 cm and 100–200 cm. For the purposes of this study, the first layer (0–10 cm) was considered the surface layer, while the depth-weighted average of the first three layers (together 0–100 cm) was considered the root zone.
LPRM produces soil moisture estimates for only the top layer of soil (∼1 cm). An exponential filter (Eq. 2) was used to extrapolate these measurements and simulate infiltration of surface soil moisture into the root zone. The filter used was developed by Wagner et al. (1999) and has been em-ployed by Ceballos et al. (2005), Albergel et al. (2008) and Hain et al. (2011). The filter applies a two-layer water bal-ance that estimates the root zone soil moisture using a sur-face soil moisture measurement and a characteristic time of
variation between the surface and root zones (Wagner et al., 1999):
θ (tn)LPRM rz=
P
θ (ti)LPRM sfe− tn−ti
τ
P e−tn
−ti
τ
, (2)
whereθ (ti)LPRM sfrepresents the soil moisture retrieval for a past dayti,θ (t n)LPRM rzrepresents the root zone soil mois-ture estimation for a given day (tn), andτrepresents the
char-acteristic time of variation between the surface layer and root zone in the soil profile. Optimal values forτ were calculated as those that maximized the correlation between the Noah LSM root-zone estimates and root-zone estimates computed by running the Noah 0–10 cm soil moisture estimates from 2003–2011 through the exponential filter (Eq. 2).
The true depth of the soil moisture estimate produced by ALEXI is related to the fraction of green vegetation cover (fc). Over bare soil, the latent heat is dominated by the evap-oration from the top layer of soil, similar to the sensing depth of microwave sensors such as AMSR-E (Hain et al., 2011; Crow and Zhan, 2007). Over densely vegetated areas (fc>75 %), ALEXI latent heat is dominated by the evapo-transpiration from the canopy layer, which is indicative of soil moisture in the root zone. This relationship is approxi-mated by Eq. (3):
θALEXI =(1−fc) θALEXI sf+fcθALEXI rz, (3) whereθALEXI is the total profile soil moisture estimate re-trieved from ALEXI,θALEXI sfandθALEXI rzare respectively the surface and root zone soil moistures, andfc is the frac-tional green vegetation cover. For this study, θALEXI sf and θALEXI rz are not independently retrieved, but are included in Eq. (3) to illustrate the process conceptually. LPRM and Noah soil moisture measurements were scaled using the same methodology so that the physical value being measured remains consistent across all products:
θLPRM=(1−fc) θLPRM sf+fcθLPRM rz (4) θNoah=(1−fc) θNoah sf+fcθNoah rz (5) whereθLPRM sfis defined as the LPRM surface soil moisture retrieval andθLPRM rzis the estimate produced by the expo-nential filter. θNoah sf is the first Noah soil moisture output layer (0–10 cm), andθNoah rzis the sum of the first through third layers (0–10 cm, 10–40 cm and 40–100 cm).
The green vegetative cover of a pixel for LPRM and Noah was determined using MODIS 16-day NDVI esti-mates (MOD13C1) and the linear relationship of Gutman and Ignatov (1998):
fc =
(NDVI−NDVI0) (NDVI100−NDVI0)
. (6)
was calculated by averaging the five smallest observed val-ues. NDVI100 refers to the maximum observed NDVI and was calculated as the average of the five largest observed val-ues. NDVI is the specific NDVI for a given pixel at a given time. Small differences between MODIS-derivedfcand the Meteosat-derivedfc used in the ALEXI processing stream may have a small impact on estimates of relative error be-tween the three soil moisture products.
2.3.4 Calculation of anomalies
Weighted sums of surface and root zone soil moisture were generated for LPRM and Noah using the NDVIfc and the method described in the previous Sect. 2.3.3. These depth-matched datasets were then used in the anomaly analysis. Two categories of anomalies were produced for this study: time series anomalies averaged over the area of interest (40.625 to 48.125◦E,−3.1255 to 9.375◦N; Fig. 1), and
spa-tially distributed anomalies for all of East Africa in hydro-logic year 2010–2011. The area of interest was selected to capture the area of maximum drought intensity, as identi-fied through our own analyses and independent reports of the drought. All anomalies were calculated relative to the pre-drought baseline, 2003–2010. The ALEXI model was not included in the anomaly analysis, because the dataset for East Africa only dates back to 2007 due to limitations on the LSA SAF product archive extent.
2.3.5 TCA and TCA-based data merging
Triple collocation analysis (TCA) is a method that can be used to estimate the relative error variance associated with three collocated datasets, provided that the datasets are mutually linear and have independent error character-istics (Janssen et al., 2007; Zwieback et al., 2012). TCA is a powerful technique but only produces meaningful re-sults if each dataset is measuring the same physical param-eter (and are therefore mutually linear). To ensure that inde-pendent datasets were, indeed, appropriate for TCA, cross-correlations of the products were calculated. Pixels with very low cross-correlations (r <0.2) were interpreted as non-analogous and were excluded from the TCA. All datasets were converted to a single reference climatology to account for variations in mean and standard deviation, following the methods of Hain et al. (2011); in this case, Noah was chosen to be the reference dataset for the TCA calculations, but the choice of reference does not affect the results of the analysis. As part of the data normalization process, a seasonal mean (µ) and standard deviation (σ) were computed for each eight-day composite soil moisture estimate (θ) of each dataset. The seasonal mean and standard deviation were calculated for the years 2007–2010 using a 24-day centered window (one composite-week on either side of the composite of interest) and used to convert the ALEXI and LPRM soil moisture esti-mates into Noah climatology as outlined in Eqs. (7) and (8):
Fig. 1.Selected area of interest within the Horn of Africa (40.625, 48.125,−3.125, 9.375) [W, E, S, N].
θLPRM′ =µNoah+(θLPRM−µLPRM)
σ
Noah
σLPRM
(7)
θALEXI′ =µNoah+(θALEXI−µALEXI)
σ
Noah
σALEXI
. (8)
Following the conversion to a single climatology, the normal-ized seasonal composites (θ′) were linearly rescaled and used
as input for TCA as described in Eq. (9) through Eq. (10). A full discussion of these methods can be found in Stoffe-len (1998). Each pixel from each dataset was analyzed over the 2007–2010 time period to calculate TC values (ε2):
εNoah2 = θNoah−θLPRM′′
θNoah−θALEXI′′
(9)
ε2LPRM=
θLPRM′′ −θNoah θLPRM′′ −θ ′′ ALEXI
(10)
ε2ALEXI= θALEXI′′ −θLPRM′′
θALEXI′′ −θNoah (11) where θ′′ represents the rescaled seasonal composites and brackets indicate a temporal average taken over the study pe-riod 2007–2010.
Fig. 2.TMPA 3B42 precipitation estimates from 2003–2011: blue = 2010–2011; gray = all other years.
to derive the weights for each product following the meth-ods of Yilmaz et al. (2012). In order to produce an unbi-ased merged product, the sum of the weights of all products was constrained to one (wx+wy+wz= 1). The cost function
(J) to be minimized in this case is the error variance of the merged product obtained from the least squares-based merg-ing method that depends on the TCA-based errors. The cost function changes depending on the number of available soil moisture datasets for a given time and location. If only two datasets are available at a given pixel, the cost function is
J =ε2m =wxε2x+(1−wx) εy2. (12)
If all three datasets are available, the cost function becomes
J =ε2m =wxε2x+(1−wx−wz) εy2+wzε2z, (13)
and if only one dataset is available, it is given the full weight. Applying the least squares approach to the cost functions in Eqs. (12) and (13) yields the following weights.
For two available datasets scenario
wx=
εy2 ε2
x+εy2
(14)
wy=
εx2 ε2
x+εy2
. (15)
For three available datasets scenario
wx=
ε2yεz2 ε2
xεy2+ε2xεz2+ε2yε2z
(16)
wy=
ε2xεz2 ε2
xεy2+ε2xεz2+ε2yε2z
(17)
wz=
ε2xεy2 ε2
xεy2+ε2xεz2+ε2yε2z
. (18)
Equations (14)–(18) were used to produce a weighting map for each product in the domain of the TC analysis. Note
that these weights are stationary provided that the number of datasets with available measurements remains constant.
In areas below the correlation threshold set for the TCA, no TC error values were produced; however, that does not mean that no useable data are available for the weighting map. For the case in which a significant correlation was observed between two of the methods in an area that was screened out of the TCA, an equal weight was assigned to each of the correlated methods.
3 Results and discussion
3.1 Anomaly analysis
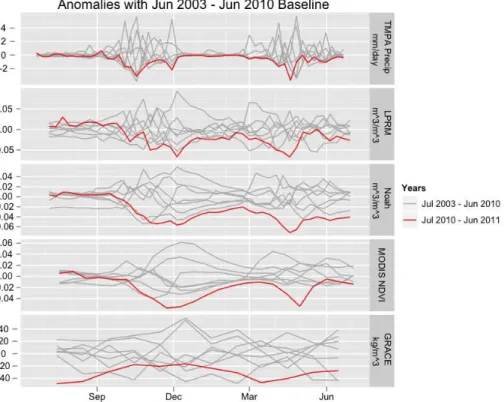
TMPA precipitation measurements from June 2003 to June 2011 were used to compare the magnitude and duration of the 2010–2011 seasonal rains with those of the previous seven years (Fig. 2). The precipitation data show a near com-plete failure of the October–December rains as well as weak April–June rains. In fact, FEWS NET determined that the to-tal anomaly in precipitation during the 2010–2011 rainy sea-sons was the most severe in the last 50 yr for parts of Kenya and Ethiopia (USAID FEWS NET, 2011). The lack of pre-cipitation is evident in modeled and remotely sensed esti-mates of soil moisture, NDVI, and terrestrial water storage (Fig. 3). For each of these variables, the 2010–2011 drought was the most severe or close to the most severe negative anomaly in magnitude and duration recorded during the pe-riod of analysis. The drought is unique in that it was a two-season drought of comparable magnitude to previous drying events of shorter duration.
Fig. 3.Anomaly analysis of TMPA precipitation, LPRM and Noah soil moisture estimates, MODIS NDVI and GRACE terrestrial water storage using a January 2003 to June 2010 baseline.
to provide memory in the climate and hydrological system. In the period between the 2010 short rains and the 2011 long rains, TMPA anomalies return to near zero – true almost by definition for the period between rainy seasons in this re-gion – and LPRM, which is dominated by surface soil mois-ture variability, notwithstanding thefc filter, nearly returns to a zero anomaly as well. Noah soil moisture and MODIS NDVI anomalies, both of which reflect dry conditions in the root zone, remain negative between rainy seasons, illustrat-ing how the agricultural drought carried over from the failed short rains to the beginning of the long rainy season. A snap-shot of NDVI or Noah root zone soil moisture anomalies taken in March 2011, then, would indicate that the land had a moisture deficit going into the planting season, where a snap-shot of surface soil moisture or precipitation would not.
GRACE offers an entirely different perspective on the drought. Interestingly, there was a negative anomaly in ter-restrial water storage even at the “onset” of the 2010–2011 drought. Indeed, GRACE retrievals indicate that total water storage in the area of interest has declined relatively steadily since 2007 (data not shown). The relevance of this multiyear decline in total water storage to drought impacts in 2010– 2011 has yet to be investigated.
3.2 Spatial anomalies
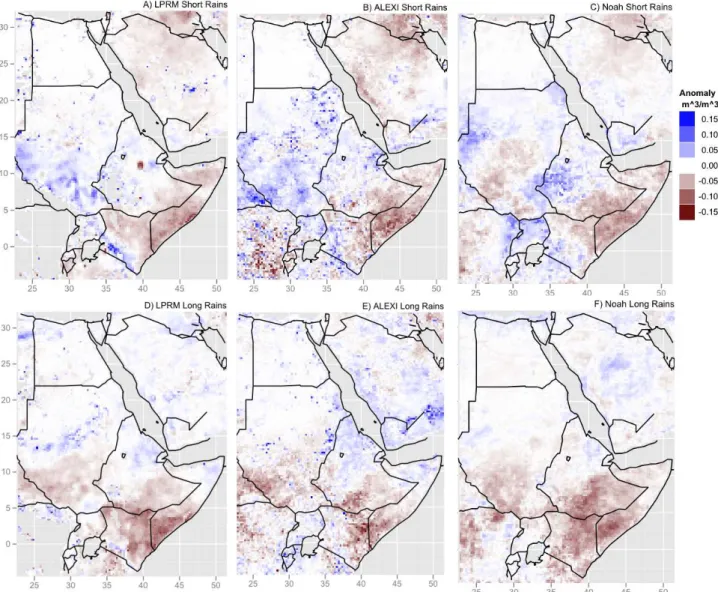
Figure 4 illustrates the spatial distribution of soil moisture anomalies in the short and the long rainy seasons. LPRM,
ALEXI and Noah soil moisture anomalies all reflect that the failure of the short rains (late September to December) was greatest in southern Somalia, Kenya and east Ethiopia while the long rain failures (April to July) extended further into Kenya, Ethiopia and Sudan. In general the soil moisture es-timates agree relatively well on the location and magnitude of the drought, but there is some discrepancy in the observed spatial extent, as Noah detects a more intense drying in cen-tral Sudan during the long rains than either of the satellite-based methods.
Fig. 4.Seasonal anomalies averaged over the 2010 short rains(A–C)and 2011 long rains(D–F)for LPRM(A, D), ALEXI(B, E)and Noah(C, F). The short rains are defined as the period from 12 September–1 December, while the long rains span 28 March –30 June.
still highly sensitive to near-surface soil moisture variabil-ity, which makes it most appropriate in sparsely vegetated regions where vertical support of soil moisture is relatively small. In addition, attenuation of the microwave signal in ar-eas of dense vegetation disrupts the retrieval of soil mois-ture measurements, potentially to the point of being unus-able (Njoku et al., 2004; Owe et al., 2008). To ensure that the observed patterns of cross-correlation are a result of the in-formation present in the LPRM soil moisture estimates, and not a result of the exponential filter applied to the original data, a series of sensitivity analyses were conducted. When the cross-correlations displayed in Fig. 5 were reproduced using the LPRM data without the addition of the exponential filter, the spatial patterns of correlation remained unchanged and the magnitude of correlation changed only marginally for a limited number of areas (results not shown). The similarity
of the cross-correlations with and without the exponential fil-ter applied to the LPRM data underscores the sensitivity of the microwave soil moisture estimates to near-surface soil moisture variability.
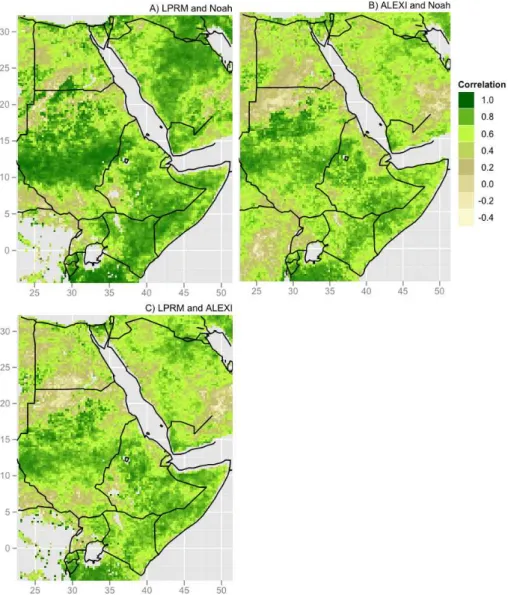
Fig. 5.Temporal cross-correlation of rescaled soil moisture anomalies for January 2007–June 2010 computed between(A)LPRM and Noah, (B)ALEXI and Noah, and(C)ALEXI and LPRM.
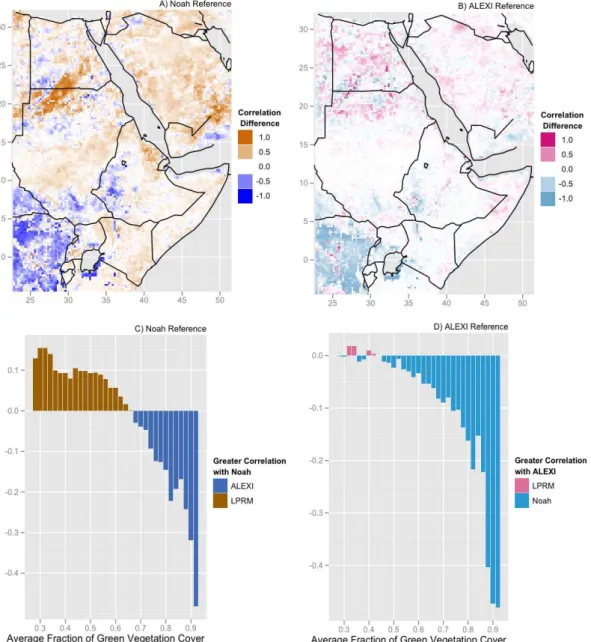
Figures 5 and 6 allow us to explore this pattern, first us-ing Noah, then ALEXI as a point of reference. Over the ma-jority of extremely arid regions (e.g., Egypt, northern Su-dan and portions of Saudi Arabia and the Horn), neither LPRM nor ALEXI clearly correlates more strongly with Noah. Similarly, Fig. 6b demonstrates that, when ALEXI is used as the reference dataset, neither LPRM nor Noah displays dominant correlation. Over semi-arid regions (e.g., central Sudan, portions of southern Ethiopia, Kenya and So-malia), LPRM correlates more strongly with Noah than does ALEXI, largely because LPRM errors are low for sparse veg-etation cover while ALEXI errors are moderate across all vegetation conditions. This relation is highlighted in Fig. 6b by the comparable correlations of LPRM and Noah with ALEXI in semi-arid regions. Some of the difference in per-ceived skill between ALEXI and LPRM/Noah in such re-gions may be related to the shorter repeat cycles of the
microwave sensors and LSM output as compared with the thermal infrared method. Over areas of dense vegetation (e.g., western Ethiopia and the Congo Basin), LPRM corre-lates poorly with both Noah and ALEXI. This is in part due to interference from vegetation and in part due to the fact that LPRM soil moisture estimates, even when adjusted with an
fcfilter, are dominated by near surface rather than root zone variability.
These spatial patterns can be summarized by plotting the difference between LPRM and ALEXI correlation with Noah as a function of fractional vegetation cover (Fig. 6c and d). In this application, the crossing point at which the sensors are approximately equally correlated with Noah is at an
Fig. 6.Anomaly correlation difference using Noah(A, C)and ALEXI(B, D)as reference datasets. Areas shaded in brown or pink represent a greater correlation between LPRM and the reference dataset.(A)and(B)show the spatial distribution of correlation differences, while (C)and(D)show correlation differences as a function of the average fraction of green vegetation during the rainy seasons.
(fc<0.35 and fc>0.8). Using ALEXI as the reference dataset reinforces these relations. At low to moderate vegeta-tion density LPRM and Noah are comparably correlated with ALEXI, while at moderate to high vegetation density Noah correlates more strongly with ALEXI than does LPRM.
3.3 Triple collocation analysis and data merging
TCA was employed to quantify relative agreement across the three soil moisture datasets and to provide an objective basis for data merging. The chosen datasets display high cross-correlations across the majority of the domain (indi-cating highly linear relationships between products) and are
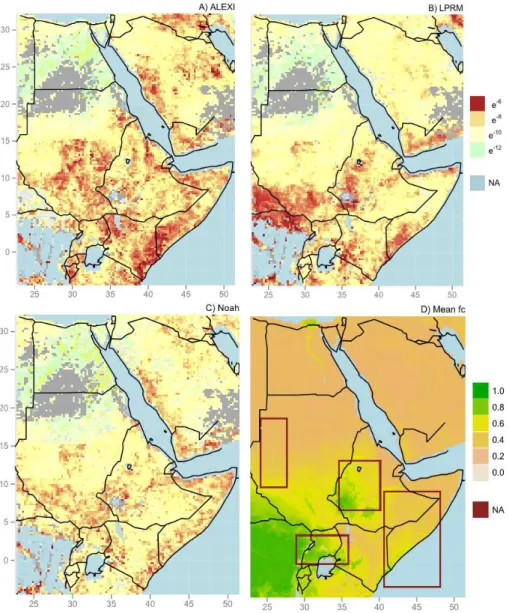
Fig. 7.The variance of the triple collocation analysis-based errors in (m3m−3)2for each product juxtaposed with the annual average fraction of green vegetation cover.(A)ALEXI TCA,(B)LPRM TCA,(C)Noah TCA,(D) mean fraction of green vegetation cover over the period 2007 to 2011. Gray areas in panels(A)–(C)indicate regions below the correlation threshold for the TC analysis (r <0.2). Red boundaries in panel(D)indicate bounding boxes for the analysis in Tables 1–4.
is the vertical support consistency of the three soil mois-ture datasets, an issue extensively discussed in Yilmaz et al. (2012). In their paper, Yilmaz et al. (2012) show that the applicability of TCA using products that have different ver-tical support information depends on the linear relationship between soil moisture at different soil depths (i.e., surface, vegetation-adjusted soil moisture, or root-zone). The depth variations will pose a problem if they manifest themselves in a nonlinear or a hysteric relationship; instead, if the rela-tionship is linear, then it fits into the TCA framework. There-fore, the impact of vertical inconsistencies will depend on the linear relation between the soil moisture values of differ-ent layers. Similar to what Yilmaz et al. (2012) have found over US, we found a very high linear relation between the
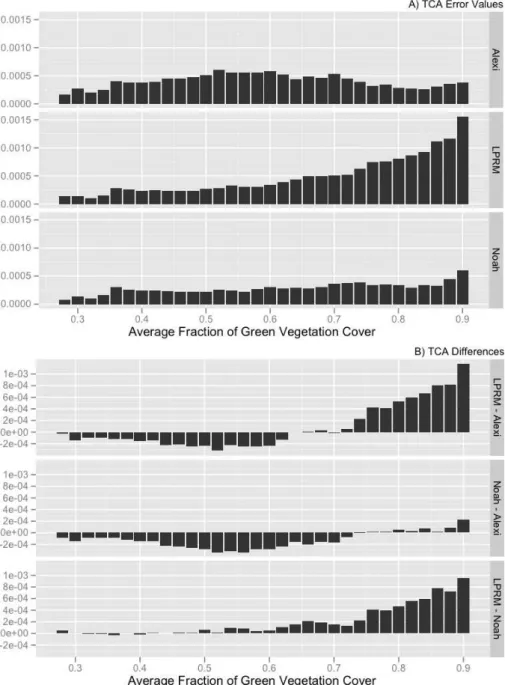
Fig. 8.The variance of the triple collocation analysis-based errors in (m3m−3)2binned as a function of average fraction of green vegetation cover during the rainy season, showing(A)TCA error values for each SM retrieval technique, and(B)differences in TCA between retrieval techniques.
expected to vary seasonally. For example, the TC error val-ues during the rainy season would be expected to be larger simply because the magnitude of soil moisture during rainy events is larger. For this study, however, the TC error values were assumed constant in time due to the short time series of available data.
As with the correlations between products, the spatial vari-ability of the TC error values for each product was evalu-ated as a function of the fraction of green vegetation (Figs. 7 and 8). LPRM has a clear dependence on the fraction of
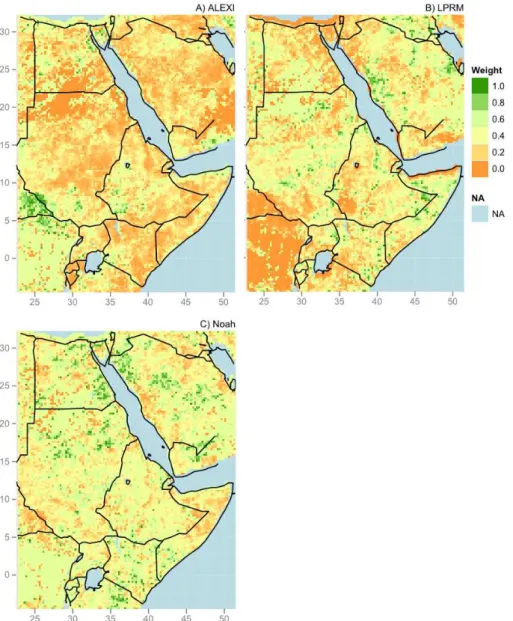
Fig. 9.TCA-based weight map for the case in which data are available from all products for(A)ALEXI,(B)LPRM and(C)Noah. The sum of weights per location adds to unity.
ALEXI and Noah have a less pronounced dependence on the fraction of green vegetation, but in general Noah main-tains the constant TC error values across all fc, while the TC error values of ALEXI decrease above moderate fc. These trends are further confirmed in Fig. 8b, showing the relative TC errors between retrieval techniques. LPRM has the highest TC over high mean fraction of vegetation cover (fc>0.70), while for areas with a low to moderate fraction of vegetation cover (fc<0.70) ALEXI displays higher TC error values than those of Noah or LPRM.
When considering the TC error values from a data merg-ing perspective, higher relative TC error values correspond to lower merging weights (see Eqs. 14–18). In an opera-tional setting, these weights would be expected to change with time as the TC error values vary. However, as previously
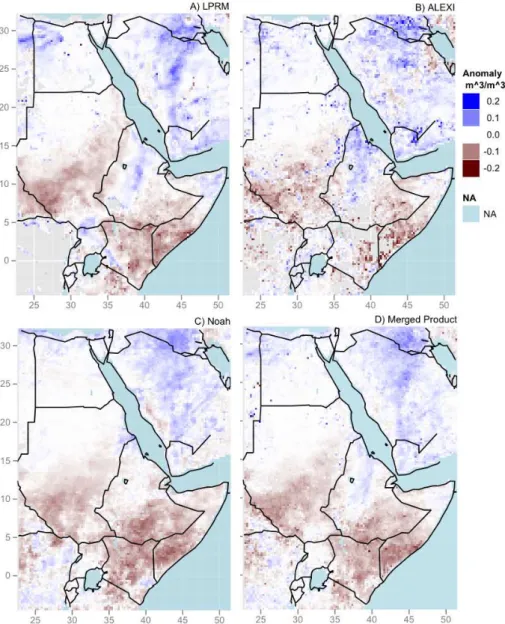
Fig. 10.Individual and merged product anomaly maps for an 8-day period during the 2011 long rainy season (28 April–6 May).(A)LPRM, (B)ALEXI,(C)Noah,(D)Merged product.
error values than ALEXI (Tables 1–4). However, over moder-ate to dense fractional vegetation, the performance of LPRM degraded (as TC error values increased), while ALEXI and Noah on average had lower TC error values and therefore received a higher merging weight.
Bearing in mind the predominantly arid conditions of the study region, these results are also consistent with the cor-relation analysis (Fig. 5 and Table 5), which indicates that Noah has the highest correlations and LPRM cross-correlations are better than the cross-cross-correlations of ALEXI. However, the majority of the cross-correlation differences are only marginal, especially the difference between the cross-correlations of Noah and ALEXI, implying the weight dif-ferences we find here are only due to small difdif-ferences that exist in the cross-correlations. Here the weights do not imply
any relation with the absolute magnitude of the errors, but rather only give information about the relative magnitudes of the errors regardless of the error differences.
Fig. 11.Monthly anomaly maps of the progression of the 2010–2011 drought using the merged product. July–December 2010(A–F)and January–June 2011(G–L).
Importantly, the merged product and all three indepen-dent products generally agree on the seasonality and gen-eral patterns of interannual variability in soil moisture in the drought-affected region (Fig. 12). This suggests that the independent products are capturing sufficiently similar pro-cesses at seasonal and interannual timescales, and it indicates that, within the drought-affected region, the merged prod-uct provides a spatially complete, consensus-derived drought
Table 1. Average merging weight and TC error values for the Ethiopian Highlands.
Ethiopian Highlands (34.59, 40.21, 6.86, 13.53)[W, E, S, N]
Retrieval Average TCA Average value merging [(m3m−3)2] weight
LPRM 4.312×10⁻⁴ 0.283 ALEXI 3.914×10⁻⁴ 0.331 Noah 2.822×10⁻⁴ 0.385
merged product for the drought region is informed by con-sensus between all three products and is not disregarding one product in favor of consensus between the other two. The rainy season rankings of these soil moisture products is also broadly consistent with rankings derived from vegeta-tion index anomalies and GRACE water storage anomalies (see Fig. 3). Relatively small discrepancies between prod-ucts – for example, the relatively slow dry-down in ALEXI observed in 2009 and 2011 (Fig. 12) – are interesting in their own right and are the subject of further study. But they do not strongly influence the seasonal rankings.
4 Conclusions
Remote sensing and physically based models are critically important methods for monitoring drought in areas with lim-ited in situ observation networks, particularly for countries with food security concerns. As shown in this study, re-motely sensed observations are valuable for their spatial and temporal continuity as well as for their diversity – satellite-derived observations of precipitation, soil moisture, vegeta-tion condivegeta-tion and terrestrial water storage offer a range of information on meteorological, agricultural, and hydrolog-ical drought over space and time. An anomaly analysis of satellite- and model-based drought indicators demonstrated that the 2010–2011 drought stands out as an extreme event according to all measures included in this study. But differ-ent data records provide differdiffer-ent perspectives on the onset and progression of the drought. TMPA and LPRM capture rapid-response anomalies associated with the failure of rains in each rainy season, while ALEXI and Noah track the evo-lution of the drought as it deepened from 2010 to 2011, and GRACE captures the fact that the drought occurred against a background of a multi-year deficit in the regional water bal-ance. This diversity of information is valuable for tracking the progression and severity of a drought and for anticipating the impacts that an emerging drought may have on ecological and human systems.
In addition to providing observations that capture di-verse drought-related processes across time and space, earth
Table 2.Average merging weight and TC error values for Darfur.
Darfur
(23.89, 27.78, 9.82, 19.09)[W, E, S, N]
Retrieval Average TCA Average value merging [(m3m−3)2] weight
LPRM 1.107×10⁻⁴ 0.351 ALEXI 1.561×10⁻⁴ 0.264 Noah 1.134×10⁻⁴ 0.384
Table 3.Average merging weight and TC error values for the Horn of Africa.
Horn of Africa
(40.62, 48.12,−3.12, 9.37)[W, E, S, N]
Retrieval Average TCA Average value merging [(m3m−3)2] weight
LPRM 3.023×10⁻⁴ 0.401 ALEXI 5.700×10⁻⁴ 0.212 Noah 2.793×10⁻⁴ 0.387
observing systems and models often provide complemen-tary estimates of a single variable. In this study, independent estimates of soil moisture derived from passive microwave (AMSR-E; LPRM), thermal infrared (ALEXI), and model-based (Noah) methods were cross-compared and merged into a single consensus drought monitor product using triple collocation analysis. It was found that ALEXI complements the poor performance of LPRM under conditions of dense vegetation, while LPRM and Noah provide more consistent anomaly estimates under more sparse vegetation conditions. This general pattern, which derives from the fact that vegeta-tion interferes with LPRM soil moisture retrievals but does not compromise thermally derived soil moisture estimates from ALEXI, is consistent with findings of Hain et al. (2011) for the contiguous US. The least squares-based objective data merging technique that is built over the TCA-based error es-timates utilizes the complementary strengths of each method to generate soil moisture anomaly estimates across agrocli-matic zones.
47
Fig. 12.Comparison of anomalies from individual and merged products using a January 2007–June 2010 baseline, averaged over the area of interest within the Horn of Africa (see Fig. 1).
Table 4.Average merging weight and TC error values for northern Lake Victoria.
Northern Lake Victoria (28.71, 35.95,−0.25, 3.65)[W, E, S, N]
Retrieval Average TCA Average value merging [(m3m−3)2] weight
LPRM 4.867×10⁻⁴ 0.273 ALEXI 5.187×10⁻⁴ 0.330 Noah 3.331×10⁻⁴ 0.396
Table 5.Average anomaly correlations.
Retrieval pair Darfur Ethiopian Horn of Northern Highlands Africa Lake
Victoria
Noah – LPRM 0.848 0.737 0.828 0.689 ALEXI – LPRM 0.798 0.720 0.773 0.636 Noah – ALEXI 0.796 0.781 0.777 0.711
the TMPA precipitation product used to force Noah simu-lations has demonstrated good performance in the drought-affected portion of the study region, which lends additional confidence to the Noah results. With the addition of a longer ALEXI time series, the sampling errors that arise from short satellite data records are expected to decrease relative to the current study.
While data merging offers several advantages over a single-source product – including improved spatial coverage relative to single sensor techniques, the potential to down-weight products with systematic biases in certain locations or
Table 6.Rank order of long and short rainy seasons based on sever-ity of soil moisture deficit. ALEXI data are missing for the period of the 2007 short rains.
ALEXI LPRM Noah Merged product
2007 Long rains 6 7 7 7 Short rains NA 9 8 8
2008 Long rains 3 4 4 4 Short rains 7 6 6 6
2009 Long rains 4 3 3 3 Short rains 5 5 5 5
2010 Long rains 8 8 9 9 Short Rains 1 2 2 2 2011 Long Rains 2 1 1 1
Numbers in bold indicate the 2010–2011 drought.
is, on the balance, better justified than a flat average across products and is preferable to relying on a single product with data gaps.
Pending further evaluation, the TCA-based data merg-ing technique could form the foundation for a soil moisture-based drought monitor in East Africa. Such a prod-uct would complement existing drought analysis tools that are based on precipitation anomaly, hydrological models, or vegetation indices. Implementation of an operational TCA-based system would, of course, entail a number of practical challenges. First, data latency would need to be addressed. The real-time TMPA 3B42-RT product is typically produced with a 9 h latency, while LPRM data are produced with a lag of 24 h. ALEXI data latency is currently a function of the accessibility of Meteosat data (e.g., land surface temper-ature, incoming solar radiation) and processing time for the regional numerical weather prediction (NWP) model used to generate necessary meteorological data fields. In an tional context, it should be possible to make use of opera-tional NWP models (e.g., Global Forecast System or Euro-pean Centre for Medium-Range Weather Forecasts) to pro-vide the necessary meteorological fields facilitating a rapid product turnaround on the order of 12–24 h. TCA analy-sis itself can be automated to require minimal processing time, and results can be disseminated through a web inter-face or email alerts. As such, system latency represents a surmountable challenge for operational monitoring. A sec-ond challenge is that the analysis system currently makes use of research-grade remote sensing products, including TMPA precipitation and AMSR-E soil moisture, that are subject to active algorithm development and – as was recently experi-enced with AMSR-E – failure of one-of-a-kind sensors. The challenge of evolving retrieval algorithms can be overcome with regular recalibration of the analysis system – TCA anal-ysis and data merging can readily be recalculated as data are updated, provided that the updates are applied consistently to the historical data archive. The problem of data continuity in research-grade products is more difficult to address, and points to the value of flexible analysis systems that can be adapted to new satellite products (e.g., using SMAP in place of AMSR-E for soil moisture) and, ultimately, the value of transitioning application-oriented research sensors to opera-tional status.
As demonstrated in this study, diverse satellite- and model-based monitoring methodologies provide complementary in-formation on the evolution and severity of drought. Ulti-mately, East Africa – and other drought prone regions – would benefit from an accessible and intuitive drought portal that allows drought analysts and decision makers real-time access to a range of drought monitoring products. As a com-ponent of a much broader movement for drought prepared-ness and response capacity in the region, such a monitor can provide valuable information to inform early warning and disaster response for future droughts.
Acknowledgements. This study was supported in part by NASA
Applied Sciences grant NNX09AT61G.
Edited by: B. van den Hurk
References
Albergel, C., R¨udiger, C., Pellarin, T., Calvet, J.-C., Fritz, N., Frois-sard, F., Suquia, D., Petitpa, A., Piguet, B., and Martin, E.: From near-surface to root-zone soil moisture using an exponential fil-ter: an assessment of the method based on in-situ observations and model simulations, Hydrol. Earth Syst. Sci., 12, 1323–1337, doi:10.5194/hess-12-1323-2008, 2008.
Anderson, M. C., Norman, J. M., Diak, G. R., Kustas, W. P., and Mecikalski, J. R.: A two-source time-integrated model for esti-mating surface fluxes using thermal infrared remote sensing, Re-mote Sens. Environ., 60, 195–216, 1997.
Anderson, M. C., Normal, J. M., Kustas, W. P., Li, F., Prueger, J. H., and Mecikalski, J. R.: A climatological study of evapo-transpiration and moisture stress across the continental United States: 1. Model formulation, J. Geophys. Res., 112, D11112, doi:10.1029/2006JD007506, 2007a.
Anderson, M. C., Norman, J. M., Mecikalski, J. R., Otkin, J. P., and Kustas, W. P.: A climatological study of evapotranspiration and moisture stress across the continental U.S. based on thermal re-mote sensing: II. Surface moisture climatology, J. Geophys. Res., 112, D11112, doi:10.1029/12006JD007507, 2007b.
Anderson, M. C., Hain, C., Pimstein, A., Mecikalski, J. R., and Kus-tas, W. P.: Evaluation of Drought Indices Based on Thermal Re-mote Sensing of Evapotranspiration over the Continental United States, J. Climate, 24, 2025–2044, doi:10.1175/2010JCLI3812.1, 2011a.
Anderson, M. C., Kustas, W. P., Norman, J. M., Hain, C. R., Mecikalski, J. R., Schultz, L., Gonz´alez-Dugo, M. P., Cammal-leri, C., d’Urso, G., Pimstein, A., and Gao, F.: Mapping daily evapotranspiration at field to continental scales using geostation-ary and polar orbiting satellite imagery, Hydrol. Earth Syst. Sci., 15, 223–239, doi:10.5194/hess-15-223-2011, 2011b.
Burnash, R. J. C.: The NWS River Forecast System – catchment modeling, in: Computer Models of Watershed Hydrology, edited by: Singh, V. P., Water Resources Publications, Highlands Ranch, CO, 311–366, 1995.
Brown, J. F.: Drought Monitoring with VegDRI, US Geological Sur-vey Fact Sheet 2010-3114, US Geological SurSur-vey, p. 2, 2010. Ceballos, A., Scipal, K., Wagner, W., and Martinez-Fernandez, J.:
Validation of ERS scatterometer derived soil moisture data in the central part of the Duero Basin, Spain, Hydrol. Process., 25, 1549–1566, 2005.
Chen, F., Mitchell, K., Schaake, J., Xue, Y., Pan, H., Koren, V., Duan, Y., Ek, M., and Betts, A.: Modeling of land-surface evapo-ration by four schemes and comparison with FIFE observations, J. Geophys. Res., 101, 7251–7268, doi:10.1029/95JD02165, 1996.
Crow, W. T. and Zhan, X.: Continental-scale evaluation of remotely-sensed soil moisture products, IEEE Geosci. Remote Sens. Lett., 4, 451–455, 2007.
Dai, Y., Zeng, X., Dickinson, R. E., Baker, I., Bonan, G. B., Bosilovich, M. G., Denning, A. S., Dirmeyer, P. A., Houser, P. R., Niu, G., Oleson, K. W., Schlosser, C. A., and Yang, Z. L.: The Common Land Model, B. Am. Meteorol. Soc., 84, 1013– 1023, 2003.
Derber, J. C., Parrish, D. F., and Lord, S. J.: The new global op-erational analysis system at the National Meteorological Center, Weather Forecast., 6, 538–547, 1991.
Draper, C. S., Walker, J. P., Steinle, P. J., De Jeu, R. A. M., and Holmes, T. R. H.: An evaluation of AMSR-E derived soil mois-ture over Australia, Remote Sens. Environ., 113, 703–710, 2009. Ek, M. B., Mitchell, K. E., Lin, Y., Rogers, E., Grunmann, P., Ko-ren, V., Gayno, G., and Tarpley, J. D.: Implementation of Noah land surface model advances in the National Centers for Environ-mental Prediction operational mesoscale Eta model, J. Geophys. Res., 108, 8851, doi:10.1029/2002JD003296, 2003.
Funk, C.: New Satellite Observations and Rainfall Forecasts Help Provide Earlier Warning of African Drought, Earth Observ., 21, 23–27, 2009.
Funk, C.: We thought trouble was coming, Nature, 476, 7, doi:10.1038/476007a, 2011.
Gutman, G. and Ignatov, A.: The derivation of the green vegetation fraction from NOAA/AVHRR data for use in numerical weather prediction models. Int. J. Remote Sens., 19, 1533–1543, 1998. Hain, C. R., Mecikalski, J. R., and Anderson, M. C.: Retrieval of an
available water-based soil moisture proxy from thermal infrared remote sensing, Part I: Methodology and Validation, J. Hydrom-eteorol., 10, 665–683, 2009.
Hain, C. R., Crow, W. T., Mecikalski, J. R., Anderson, M. C., and Holmes, T.: An Intercomparison of Available Soil Mois-ture Estimates from Thermal-Infrared and Passive Microwave Remote Sensing and Land-surface Modeling, J. Geophys. Res., 116, D15107, doi:10.1029/2011JD015633, 2011.
Huete, A., Didan, K., Miura, T., Rodriguez, E. P., Gao, X., and Fer-reira, L. G.: Overview of the radiometric and biophysical perfor-mance of the MODIS vegetation indices, Remote Sens. Environ., 83, 195–213, 2002.
Huffman, G., Adler, R. F., Bolvin, D. T., Gu, G., Nelkin, E. J., Bowman, K. P., Hong, Y., Stocker, E. F., and Wolff, D. B.: The TRMM Multisatellite Precipitation Analysis (TMPA): Quasi-Global, Multiyear, Combined-Sensor Precipitation Estimates at Fine Scales, J. Hydrometeorol., 8, 38–55, 2007.
Janowiak, J. E. and Xie, P.: CAMS OPI: a global satellite-raingauge merged product for real-time precipitation monitoring applica-tions, J. Climate, 12, 3335–3342, 1999.
Janssen, P., Abdalla, S., Hersbach, H., and Bidlot, J. R.: Error Es-timation of Buoy, Satellite, and Model Wave Height Data, J. At-mos Ocean. Tech., 24, 1665–1677, 2007.
Kerr, Y. H. and Njoku, E. G.: A semiempirical model for inter-preting microwave emission from semiarid land surfaces as seen from space, IEEE T. Geosci. Remote, 28, 384–393, 1990. Kogan, F. N.: Remote sensing of weather impacts on vegetation in
non-homogeneous areas, Int. J. Remote Sens., 11, 1405–1419, 1990.
Kogan, F. N.: Droughts of the late 1980s in the U.S. as derived from NOAA polar-orbiting satellite data, B. Am. Meteorol. Soc., 76, 655–668, 1995.
Kogan, F. N.: Global Drought Watch from Space, B. Am. Meteorol. Soc., 78, 621–636, 1997.
Koren, V., Schaake, J., Mitchell, K., Duan, Q. Y., Chen, F., and Baker, J. M.: A parameterization of snowpack and frozen ground intended for NCEP weather and climate models, J. Geophys. Res., 104, 19569–19585, doi:10.1029/1999JD900232, 1999. Koster, R. D. and Suarez, M. J.: Energy and water balance
calcula-tions in the Mosaic LSM, NASA Tech. Memo. 104606, 76, God-dard Space Flight Center, Greenbelt, MD, 1996.
Koster, R. D., Suarez, M. J., Ducharne, A., Stieglitz, M., and Ku-mar, P.: A catchment-based approach to modeling land surface processes in a GCM, Part 1, Model Structure, J. Geophys. Res., 105, 24809–24822, 2000.
Lawrence, D. M., Oleson, K. W., Flanner, M. G., Thornton, P. E., Swenson, S. C., Lawrence, P. J., Zeng, X., Yang, Z.-L., Levis, S., Sakaguchi, K., Bonan, G. B., and Slater, A. G.: Parameterization improvements and functional and structural advances in version 4 of the Community Land Model, J. Adv. Model. Earth Syst., 3, M03001, doi:10.1029/2011MS000045, 2011.
Ledwith, T.: Crisis in the Horn of Africa: Rethinking the Hu-manitarian Response, 5 October 2011, http://reliefweb.int/node/ 4512333, last access: 20 November 2011.
Liang, X., Lettenmaier, D. P., Wood, E. F., and Burges, S. J.: A sim-ple hydrologically based model of land surface water and energy fluxes for GCMs, J. Geophys. Res., 99, 14415–14428, 1994. Njoku, E. G., Chan, T., Crosson, W., and Limaye, A.: Evaluation of
the AMSR-E Data Calibration Over Land, Ital. J. Remote Sens., 30/31, 19–37, 2004.
Norman, J. M., Kustas, W. P., and Humes, K. S.: Source approach for estimating soil and vegetation energy fluxes in observations of directional radiometric surface-temperature, Agr. Forest Me-teorol., 77, 263–293, 1995.
Owe, M., De Jeu, R. A. M., and Holmes, T. R. H.: Multi-Sensor Historical Climatology of Satellite-Derived Global Land Surface Moisture, J. Geophys. Res., 113, F01002, doi:1029/2007JF000769, 2008.
Parinussa, R. M., Holmes, T. R. H., Yilmaz, M. T., and Crow, W. T.: The impact of land surface temperature on soil moisture anomaly detection from passive microwave observations, Hy-drol. Earth Syst. Sci., 15, 3135–3151, doi:10.5194/hess-15-3135-2011, 2011.
Rudiger, C., Jean-Christophe, C., Gruhier, C., Holmes, T. R. H., De Jeu, R. A. M., and Wagner, W.: An Intercomparison of ERS-Scat and AMSR-E Soil Moisture Observations with Model Simula-tions over France, J. Hydrometeorol., 10, 431–447, 2009. Scipal, K., Holmes, T., de Jeu, R., Naeimi, V., and Wagner, W.: A
possible solution for the problem of estimating the error struc-ture of global soil moisstruc-ture data sets, Geophys. Res. Lett., 35, L24403, doi:10.1029/2008GL035599, 2008.
Sheffield, J., Wood, E. F., Lettenmaier, D. P., and Lipponen, A.: Experimental Drought Monitoring for Africa, GEWEX News, 8, International GEWEX Project Office, Silver Spring, Maryland, 2008.
Stoffelen, A.: Toward the true near-surface wind speed: Error mod-eling and calibra- tion using triple collocation, J. Geophys. Res., 103, 7755–7766, 1998.
Swenson, S. C. and Wahr, J.: Post-processing removal of corre-lated errors in GRACE data, Geophys. Res. Lett., 33, L08402, doi:10.1029/2005GL025285, 2006.
USAID FEWS NET – United States Agency for International Development, Famine Early Warning System Network, East Africa: Past year one of the driest on record in the eastern Horn, http://www.fews.net/docs/Publications/FEWS%20NET% 20EA Historical%20drought%20context 061411.pdf, last ac-cess: 14 June 2011.
United Nations Office for the Coordination of Humanitarian Af-fairs: Horn of Africa Crisis Situation Report No. 18, 14 Octo-ber 2011.
United Nations – UN News Center: UN Declares Famine in Another Three Areas of Somalia, http://www.un.org/apps/news/story.asp? NewsID=39225, last access: 3 August 2011.
Wagner, W., Lemoine, G., and Rott, H.: A method for estimat-ing soil moisture from ERS scatterometer and soil data, Remote Sens. Environ., 70, 191–207, 1999.
Wagner, W., Naeimi, V., Scipal, K., De Jeu, R., and Martinez-Fernandez, J.: Soil moisture from operational meterologival satellites, Hydrogeol. J., 15, 121–131, 2007.
Wood, A. W.: The University of Washington Surface Water Mon-itor: An experimental platform for national hydrologic assess-ment and prediction. Proceedings of the AMS 22nd Conference on Hydrology, New Orleans, 13 pages, 20—24 January 2008.
Xia, Y., Mitchell, K., Ek, M., Sheffield, J., Cosgrove, B., Wood, E. F., Luo, L., Alonge, C., Wei, H., Meng, J., Livneh, B., Let-tenmaier, D., Koren, V., Duan, Q., Mo, K., Fan, Y., and Mocko, D.: Continental-Scale Water and Energy Flux Analysis and Val-idation for the North-American Land Data Assimilation System Project Phase 2 (NLDAS-2), Part 1: Intercomparison and Ap-plication of Model Products, J. Geophys. Res., 117, D03110, doi:10.1029/2011JD016051, 2012.
Yilmaz, M. T., Crow, W. T., Anderson, M. C., and Hain, C.: An Objective Methodology for Merging Satellite- and Model-Based Soil Moisture Products, Water Resour. Res., submitted, 2012. Zaitchik, B. F., Rodell, M., and Reichle, R. H.: Assimilation of
GRACE terrestrial water storage data into a land surface model: results for the Mississippi River Basin, J. Hydrometeorol., 9, 535–548, doi:10.1175/2007JHM951.1, 2008.
Zaitchik, B. F., Habib, S., Anderson, M., Ozdogan, M., and Alo, C.: A Land Data Assimilation System for hydrologic studies in countries of the Nile basin, 8th International Conference of the African Association of Remote Sensing for the Environment, Addis Ababa, Ethiopia, 2010.
![Fig. 1. Selected area of interest within the Horn of Africa (40.625, 48.125, −3.125, 9.375) [W, E, S, N]](https://thumb-eu.123doks.com/thumbv2/123dok_br/18204209.333875/6.892.465.818.92.584/fig-selected-area-horn-africa-w-e-s.webp)