www.ocean-sci.net/4/199/2008/
© Author(s) 2008. This work is distributed under the Creative Commons Attribution 3.0 License.
Ocean Science
Influence of Rossby waves on primary production from a coupled
physical-biogeochemical model in the North Atlantic Ocean
G. Charria1,2, I. Dadou1, P. Cipollini2, M. Dr´evillon3, and V. Garc¸on1
1Laboratoire d’Etudes en G´eophysique et Oc´eanographie Spatiales, UMR5566/CNRS, Toulouse, France 2National Oceanography Centre, Southampton, United Kingdom
3CERFACS, MERCATOR-Oc´ean, Toulouse, France
Received: 30 October 2007 – Published in Ocean Sci. Discuss.: 29 November 2007 Revised: 9 July 2008 – Accepted: 1 August 2008 – Published: 1 September 2008
Abstract.Rossby waves appear to have a clear signature on surface chlorophyll concentrations which can be explained by a combination of vertical and horizontal mechanisms. In this study, we investigate the role of the different physical processes in the north Atlantic to explain the surface chloro-phyll signatures and the consequences on primary produc-tion, using a 3-D coupled physical/biogeochemical model for the year 1998.
The analysis at 20 given latitudes, mainly located in the subtropical gyre, where Rossby waves are strongly correlated with a surface chlorophyll signature, shows the important contribution of horizontal advection and of vertical advec-tion and diffusion of inorganic dissolved nitrogen. The main control mechanism differs according to the biogeochemical background conditions of the area.
The surface chlorophyll anomalies, induced by these phys-ical mechanisms, have an impact on primary production. We estimate that Rossby waves induce, locally in space and time, increases (generally associated with the chlorophyll wave crest) and decreases (generally associated with the chloro-phyll wave trough) in primary production, ∼±20% of the estimated background primary production. This symmetri-cal situation suggests a net weak effect of Rossby waves on primary production.
1 Introduction
The detection of westward propagating signals in sur-face chlorophyll concentrations related to Rossby waves (e.g. Machu et al., 1999; Cipollini et al., 2001; Uz et al., 2001; Kawamiya and Oschlies, 2001) prompted the question of the underlying physical/biogeochemical
inter-Correspondence to:G. Charria ([email protected])
actions. Based on remotely sensed data and/or coupled physical/biogeochemical modelling, several studies inves-tigated the coupled physical/biogeochemical mechanisms which might be involved (e.g. Charria et al., 2003, 2006a; Killworth et al., 2004). Three main processes were sug-gested: (1) the upwelling mechanism associated with nutri-ent injection (Cipollini et al., 2001; Uz et al., 2001; Siegel, 2001), (2) the uplifting of a deep chlorophyll maximum to-wards the surface (Cipollini et al., 2001; Kawamiya and Os-chlies, 2001; Charria et al., 2003), and (3) the meridional advection of chlorophyll by geostrophic currents associated with baroclinic Rossby waves (Killworth et al., 2004). These three processes are described in Killworth et al. (2004) us-ing theoretical models and compared to the remotely sensed observations. These authors pointed out the importance of the third process at the global scale. More recently, Char-ria et al. (2006a) showed a significant contribution of the vertical process of nutrient injection in the North Atlantic, north of 28◦N, using remotely sensed data and theoretical models from Killworth et al. (2004). However, in the two latter studies, several first-cut approximations were made in the modelling of the biological signal (for example: a con-stant relaxation time for biology and a concon-stant ChlN ratio). We will investigate here the relative contribution of the dif-ferent mechanisms using a more realistic 3-D coupled phys-ical/biogeochemical modelling approach.
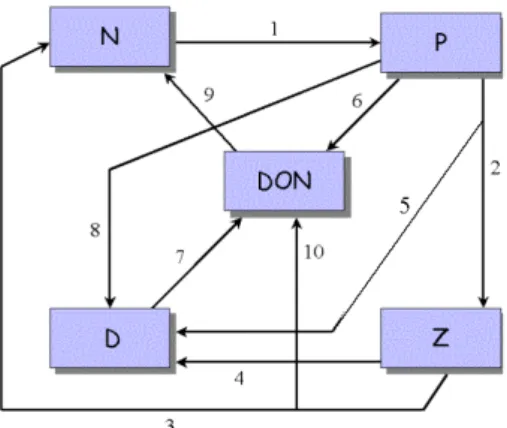
Fig. 1. Dissolved inorganic nitrogen (N), phytoplankton (P), zoo-plankton (Z), particulate organic matter (D), and dissolved organic nitrogen (DON) model (Huret et al., 2005). The different fluxes between the state variables are: (1) Nutrients assimilation by phyto-plankton during photosynthesis, (2) Zoophyto-plankton grazing, (3) Zoo-plankton excretion, (4) ZooZoo-plankton mortality, (5) Non-assimilated part of zooplankton grazing (fecal pellets production), (6) plankton exudation, (7) Particles hydrolysis by bacteria, (8) Phyto-plankton mortality, (9) Dissolved organic nitrogen remineralization and (10) Organic zooplankton excretion.
allowed Sakamoto et al. (2004) to estimate primary produc-tion enhancement up to 25% on average due to the Rossby wave’s passage. Indeed, Rossby waves can significantly con-tribute to supply nutrients to oligotrophic surface waters fu-elling primary production. According to several authors (e.g. Oschlies and Garc¸on, 1998; Oschlies, 2002a,b), eddies in-duce increase in nutrient input into the euphotic layer. Verti-cal velocities associated with Rossby waves can also induce a similar effect, named as the “Rossby rototiller” (Siegel, 2001), with two crucial differences: 1) the vertical veloc-ities induced by Rossby waves are generally smaller than those in an eddy that is forming or evolving; 2) however, while eddies upwell water only while forming or intensi-fying, Rossby waves would upwell nutrients all along their propagation path through an ocean basin. This effect is then potentially comparable to basscale processes such as in-duction process in the subpolar gyre (Williams et al., 2006) or Dissolved Organic Nitrogen and Phosphorus advection in the subtropical gyre (Roussenov et al., 2006).
The present work investigates Rossby wave influ-ence on primary production using a 3-D coupled phys-ical/biogeochemical realistic model in the North Atlantic Ocean. After a brief description of the coupled physi-cal/biogeochemical model in Sect. 2, as well as the remotely sensed data used in the validation of simulated wave features in the model (Sect. 3), we will show the surface chlorophyll and physical signatures of Rossby waves using model results. In Sect. 4, the features of these modelled propagating signals are identified and compared to those estimated with remotely
sensed data. In Sect. 5, the procedure to extract the studied regions is given, followed by the description of the results in Sect. 6. The influence of Rossby waves on modelled pri-mary production and the relative contribution of the under-lying physical/biogeochemical processes in the oligotrophic gyre are discussed in the last section.
2 A coupled physical/biogeochemical model
The numerical experiments described here are performed using a 3-D coupled physical/biogeochemical model. The ocean physics is solved by the OPA 8.1 model (Madec and Imbard, 1996) in a North Atlantic configuration (MNATL – 20◦S–70◦N and 98.5◦W–20◦E). This model, initially used in the frame of the CLIPPER project and used by the opera-tional oceanography MERCATOR project, has a 1/3◦spatial
resolution and 43 vertical levels with a vertical grid spacing increasing from 12 m at the surface to 200 m at the bottom. The model grid size has the right spatial resolution to ade-quately resolve Rossby wave with wavelengths longer than 300 km. For instance, with a 1/3◦ resolution, there are 10 grid points or more for a 300 km wavelength wave. Simula-tions are forced by daily European Centre for Medium-Range Weather Forecasts (ECMWF) atmospheric forcing.
This physical model is coupled with a simple nitrogen-based NPZDDON (dissolved inorganic Nitrogen, Phyto-plankton, ZooPhyto-plankton, Detritus and Dissolved Organic Ni-trogen) ecosystem model (Huret et al., 2005). The differ-ent fluxes between state variables, represdiffer-ented on Fig. 1 are the following: (1) Nutrients assimilation by phytoplank-ton during the photosynthesis, (2) Zooplankphytoplank-ton grazing, (3) Zooplankton excretion, (4) Zooplankton mortality, (5) Non-assimilated part of zooplankton grazing (fecal pellets produc-tion), (6) Phytoplankton exudation, (7) Particles hydrolysis by bacteria, (8) Phytoplankton mortality, (9) Dissolved or-ganic nitrogen remineralization and (10) Oror-ganic zooplank-ton excretion.
The tracer concentrations follow an advective-diffusive equation plus a source-minus-sink (SMS) term of exchange between different tracers. The SMS terms for each of the biological tracer in nitrogen units (mmolN m−3) are:
SMS(N)=ρDON+(1−f2)γZ−J (z, t,N)P (1)
SMS(P)=(1−ǫ)J (z, t,N)P−µPP−G(P)Z (2)
SMS(Z)=f1G(P)Z−γZ−µZZ2 (3)
SMS(D)=(1−f1)G(P)Z+µPP+µZZ2−µDD −wS
∂D
∂z (4)
Table 1.Parameters of the ecosystem model.
Symbol Parameter Definition
Phytoplankton coefficients
α 0.025 d−1/(W m−2) Initial slope P-I curve
PAR 0.43 Photosynthetically active radiation coefficient
kc 0.03 m−1(mmol m−3)−1 Light attenuation by phytoplankton
a 0.6 d−1 Maximum growth rate parameters
b 1.066
c 1 (◦C)−1
1/ kw 25 m 1/Light attenuation due to water
kN 0.5 mmol m−3 Half-saturation constant for N uptake
µP 0.03 d−1 Specific mortality rate
ǫ 0.01 Exudation fraction of primary production
Zooplankton coefficients
f1 0.75 Assimilation efficiency
g 2 d−1 Maximum grazing rate
p 1 (mmol m−3)−2d−1 Prey capture rate µz 0.2 (mmol m−3)−1d−1 Mortality rate
γ 0.03 d−1 Excretion rate
f2 0.25 Organic fraction of excretion
Detritus coefficients
µD 0.23 d−1 Hydrolysis rate
wS 5 m d−1 Sinking velocity
DON coefficients
ρ 0.025 d−1 Remineralization rate
N represents dissolved inorganic nitrogen, P phytoplank-ton, Z zooplankphytoplank-ton, D detritus and DON the semi-labile dis-solved organic nitrogen. Parameters are described in Table 1. Parameter values are deduced from Oschlies and Garc¸on (1999) and Huret et al. (2005), as well as from a preliminary sensitivity analysis (Charria, 2005).
TheJ (z, t,N) represents the phytoplankton growth func-tion of light and nutrient limitafunc-tions. Following the minimum Liebig’s Law (Liebig, 1845), the minimum between light and nutrient limitation is used:
J (z, t,N)=min(J (z, t ), J¯ maxLNO3) (6)
with J (z, t )¯ the daily integrated light-limited growth rate,
LNO3 the nutrient limitation term, Jmax=ab
cT the
light-saturated growth rate, T the temperature (◦C),zthe water
depth, andtthe daily time.
The nutrient limitation follows the Michaelis-Menten for-mulation:
LNO3 =
N
N+KN (7)
whereKNstands for the half-saturation constant for nutrient
uptake.
The light limited growth rate is based on the analytical method from Evans and Parslow (1985). One of the advan-tages of this method is that a diurnal cycle from daily so-lar fluxes is simulated analytically. In fact, the light limited growth rateJ (z, t )is averaged over 24 h and over a vertical layer as:
¯
J (z, t )= 1
τ24h
Z 24h
0
1
zk−zk−1
Z zk
zk−1
J (z, t′)dzdt′ (8)
where
J (z, t′)= JmaxαI (z, t
′)
(J2
max+α2I (z, t′)2)1/2
(9) where I (z, t′) is the local light intensity and α the initial slope of the photosynthesis-light (P-I) curve. Using these equations (8 and 9), the light is maximum at noon at surface (it decreases exponentially with depth). Evans and Parslow (1985) then compute analytically the limitation term inte-grated over the mixed layer depth and during the day, and found the following equation:
¯
J (z, t′)=2JmaxkM [F (βekM, τ )−F (β, τ )
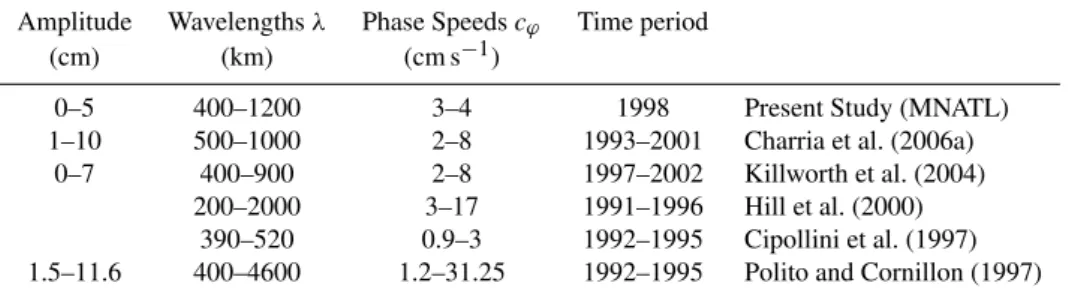
Table 2.Summary of Rossby wave features compared to previous studies. Extracted wavelengths and speeds are representative of the North Atlantic basin (mainly between 10◦N and 40◦N) except for the Cipollini et al. (1997) study based on the North-East Atlantic at 34◦N.
Amplitude Wavelengthsλ Phase Speedscϕ Time period
(cm) (km) (cm s−1)
0–5 400–1200 3–4 1998 Present Study (MNATL)
1–10 500–1000 2–8 1993–2001 Charria et al. (2006a)
0–7 400–900 2–8 1997–2002 Killworth et al. (2004)
200–2000 3–17 1991–1996 Hill et al. (2000)
390–520 0.9–3 1992–1995 Cipollini et al. (1997)
1.5–11.6 400–4600 1.2–31.25 1992–1995 Polito and Cornillon (1997)
whereMis the mixed layer depth,k=0.04 m−1the light at-tenuation coefficient,β=(Jmaxτ )/(αInoon)whereInoonis the
light level at the surface at noon,τ=d/2 the local time from sunrise to noon withdthe local duration of the day, and
F (y, t′)=(y2+t′2)1/2−t′∗lnt+(y
2+t′2)1/2
y (11)
G(P) represents the zooplankton grazing, it is written follow-ing a Hollfollow-ing type III function:
G(P)= gpP
2
g+pP2 (12)
with g, the maximum grazing rate for the high P values and p the prey capture rate. The advection scheme is MUSCL (Monotonic Upstream centred Scheme for Conser-vation Laws – L´evy et al., 2001). This scheme is monotonic, positive with an implicit diffusion and a weak dispersion.
The interannual simulation has been initiated from Rey-naud et al. (1998) climatology with a one year spin-up of the physical model in 1995. The coupled experiment started in 1996.
The initial dissolved inorganic nitrogen field is from the Conkright et al. (2002) climatology. The other biogeo-chemical variables need a shorter period to reach a bal-anced state (in order of one year). Consequently, the ini-tial Phytoplankton, Zooplankton, and Dissolved Organic Ni-trogen are respectively 0.14 mmolN m−3, 0.014 mmolN m−3 and 3 mmolN m−3 at surface and are decreasing exponen-tially with depth. Detritus are initialized to 10−4mmolN m−3 on the whole domain. An approximately stable seasonal cy-cle was reached after 2 years, end of 1997. The fields used in this study represent the third year of coupled integration (i.e. 1998). Statistical analyses and comparisons with motely sensed and in situ data showed that the model re-produces well the seasonal cycle of the ecosystem as well as the primary production in the North Atlantic biogeochem-ical provinces (Charria et al., 2006b, 2008). However a few biases were highlighted in the simulated fields. The Gulf Stream position is too far North as compared to observations. This is a well known bias in this kind of general circulation
model (Barnier et al., 2006). Concerning the biogeochemi-cal fields, the northern boundary of the oligotrophic gyre is located too far South. Indeed, the northern boundary is lo-cated around 28◦N in the observations and around 23◦N in the simulated fields. The elevated chlorophyll concentrations in the oligotrophic gyre are linked to high inorganic nitrogen contents due to a fast remineralization loop above the nitra-cline associated with regenerated production.
3 Data
3.1 Chlorophyll-aconcentrations
Chlorophyll-a concentrations (in mgChl m−3) were
ob-tained from the ocean colour sensor SeaWiFS (Sea-viewing Wide Field-of-view Sensor) products (level 3 binned data, monthly, version 4 – O’Reilly et al., 1998) generated by the NASA Goddard Space Flight Center (GSFC) Distributed Ac-tive Archive Center (DAAC) (McClain et al., 1998). The products are on a regular grid of 9 by 9 km for the year 1998 (similar to the simulated year). The predicted error on the single 1-km SeaWiFS estimates of chlorophyll-a concentra-tion is 35% (McClain et al., 1998); the accuracy of 9 km gridded data is comparable or better. As our study focuses on the anomalies of surface chlorophyll-aconcentrations, a monthly zonal average from raw data at each latitude and for each month is removed (coastal regions are excluded), so also removing part of the seasonal cycle. To apply the spec-tral analysis and filtering described below, gaps in the data, mainly due to the presence of clouds, are filled with a linear interpolation.
3.2 Sea Level Anomalies (SLA)
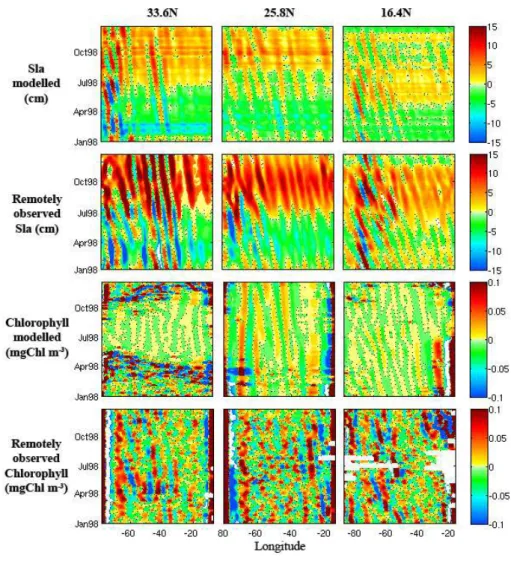
Fig. 2.Examples of longitude-time plots of simulated and remotely observed Sea Level Anomalies and surface chlorophyll concentrations for the 33.6◦N, 25.8◦N, and 16.4◦N latitudes after filtering with spatial 1-D wavelet analysis.
(noise correlated on large scales) with a 1–2 cm mean error (Le Traon et al., 1998; Ducet et al., 2000). SLA are rela-tive to a seven year average (1993–1999) and were mapped every 7 days for the year 1998 with a spatial resolution of 1/3◦. To have the same temporal resolution as for the surface chlorophyll-aconcentrations, SLA data were averaged with a monthly time step.
4 Rossby waves in the coupled model
Rossby wave features in the coupled experiment results (Sea Level Anomalies – SLA – and surface chlorophyll concen-trations) are first described and compared to those deduced from remotely sensed data (Charria et al., 2006a).
The SLA are analysed to detect the westward propagating signals. The physical model does not have a free surface, so the effective SLA are calculated from the temperature and salinity fields and from the barotropic stream function
com-puted with the pressure compensation relation (Mellor and Wang, 1996).
We will consider four main parameters (wavelength, am-plitude, phase speed and phase relationship between SLA and surface chlorophyll concentrations) previously used in analysis of Rossby wave features.
The predominant wavelengths in SLA are calculated us-ing a 1-D continuous wavelet analysis (Torrence and Compo, 1998) applied for each model latitude between 10◦N and
40◦N. Maxima in the local wavelet power spectra are
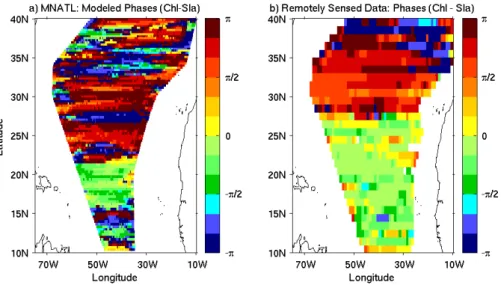
Fig. 3.Spatial phase relationships for the year 1998 between chlorophyll concentrations and SLA, averaged in time, obtained from a cross wavelet analysis for: the coupled model(a)and remotely sensed data(b).
XspecAmplitudeafterwaveletfiltering 42ºN
36ºN
30ºN
24ºN
18ºN
12ºN
90ºW 75ºW 60ºW 45ºW 30ºW 15ºW
6
5.5
5
4.5
4
Fig. 4. Cross-spectral amplitude (in cm log 10 (mgChl m−3)) integrated over Rossby wave period and wavelength (3–24 months/400–1200 km) for 11 July 1998.
transform (Polito and Cornillon, 1997) or wavelet method (Charria, 2005; Charria et al., 2006a) (Table 2).
The modelled SLA are filtered reconstructing the signal for the wavelengths located between 400 and 1200 km after a 1-D continuous spatial wavelet analysis. To estimate the Rossby wave amplitude, the westward propagating signals are extracted (Fig. 2). The simulated waves present ampli-tudes weaker (reaching 5 cm) than those observed (7–10 cm) in remotely sensed data (Killworth et al., 2004; Charria et al., 2006a) over the North Atlantic Ocean (Table 2). These lower amplitudes in the simulations are partly due to the model spa-tial resolution. With the 1/3-degree spaspa-tial resolution, our model results either do not include, or include with some smoothing, the effect of shorter-scale Rossby waves (less than∼300 km) as well as wave-eddy interactions. These pro-cesses are included in the satellite data and might explain the higher SLA amplitude in the satellite data. Another
expla-nation is due to the atmospheric forcing (model input in our study), which might not have the right frequency (here daily) to force the entire Rossby wave spectrum as in the satellite data.
Propagation velocities (or phase speeds) associated with Rossby waves are calculated from the filtered time/longitude diagrams with a 2-D Radon transform method (Challenor et al., 2001). The modelled velocity values are between 3 and 4 cm s−1(Table 2). They fall in the same range as those esti-mated in previous studies (Table 2). However, a narrower in-terval is observed for the present study partly due to the time period over which the phase speeds are estimated (Challenor et al., 2001).
Similar analyses, based on the longitude/time diagrams and using the same wavelet filter, are performed on the sim-ulated surface chlorophyll concentration fields. A variable chlorophyll-to-nitrogen ratio was used following Hurtt and Armstrong (1996) to convert modelled phytoplankton in ni-trogen units into chlorophyll concentrations. Wavelengths between 400 and 1500 km are observed in agreement with those deduced from the SeaWiFS data for the same year. Concerning the amplitudes associated with westward prop-agations, they are similar in the filtered modelled concentra-tions and in the filtered remotely sensed concentraconcentra-tions esti-mated by the SeaWiFS sensor. Note that chlorophyll anoma-lies are used, not absolute values; areas of high absolute chlorophyll concentrations may not necessarily show large anomalies.
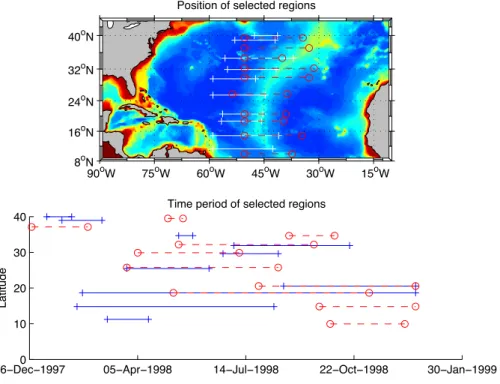
Fig. 5.Position (white lines and red lines) of selected regions compared to the model bathymetry (top) and time extension of these regions (bottom). Different colours are only used to distinguish regions around close latitudes and are similar in top and bottom figures.
by Charria et al. (2006a), the phase relationships between Rossby waves (signal in SLA) and their chlorophyll sig-nature can be highly variable. We compare the phase relationships using a cross-wavelet analysis between fil-tered SLA and filfil-tered surface chlorophyll concentrations. From 23◦N to 35◦N, the modelled phase relationships (phase(Chlorophyll) – phase(SLA)) are mainly betweenπ/2 andπ(Fig. 3a). By contrast, between 16◦N and 23◦N in the simulated fields (Fig. 3a) and between 10◦N and 28◦N in the remotely sensed data (Fig. 3b), values of phase relation-ship are between−π/2 and 0. According to the theoretical approach from Killworth et al. (2004), we can deduce that between 16◦N and 23◦N in the simulations (between 10◦N and 28◦N in the data), the meridional chlorophyll advection should be the dominant process as confirmed by Charria et al. (2006a). However, the phase relationships deduced from the modelled fields north of 23◦N do not allow to detect a clear
dominant process when the meridional chlorophyll gradients are positive due to the same phase relationship for vertical and horizontal processes (Killworth et al., 2004).
After the analysis of modelled Rossby waves and chloro-phyll signature features and the comparison with previous studies, we can conclude that Rossby waves are well repre-sented in the model despite a southwards shift of the bound-ary between two different phase regimes due to modelled biogeochemical conditions.
5 Region selection with significant Rossby wave signa-tures
To quantify the influence of Rossby waves on primary pro-duction, our analysis is focused on the three parts of the wave chlorophyll signature: the positive chlorophyll anomaly linked to the wave’s crest (hereafter CA+), the negative anomaly linked to the wave’s trough (CA−) and the lack of chlorophyll anomaly (CA0). The accurate identification of these wave patterns in particular regions needs the following pre-processing on the simulated fields.
Before extracting any wave, the previously spatially fil-tered fields (see Sect. 4) at each time step and each latitude are used to detect clear wave propagations in SLA and sur-face chlorophyll concentrations. A cross-spectrum analysis between SLA and the decimal logarithm of surface chloro-phyll concentrations (similar to the analysis applied on re-motely sensed data in Killworth et al., 2004) is then per-formed on longitude/time windows. Windows are 60 grid points wide (around 20◦in longitude). The cross-spectrum
Time
Longitude E W
D
epth
112m
Positive Chlorophyll
anomaly Negative
Chlorophyll anomaly
...(2)in tegr
atedintime...
(1)v
er
tic
allyin
tegr
at
ed...
...(3)andaveragedinlongitude. Lackof
Chlorophyllanomaly
Fig. 6.Description of the integration method along the chlorophyll anomalies (CA+, CA−and CA0).
selected between 30◦W and 60◦W where the cross-spectrum amplitudes are above 4.35 cm log 10 (mgChl m−3). These peaks in the cross-spectrum correspond to different phase re-lationships between the surface chlorophyll anomalies and SLA. An homogeneous zonal distribution is also preferred. Based on these latitudes, the extent of the time/space re-gion is refined over the time period where positive/negative chlorophyll anomalies can be clearly identified and followed in time. Indeed, the variations of the biogeochemical back-ground conditions along the wave trajectory, tracked using the SLA signature, are inducing fluctuations in the chloro-phyll signature intensity. Finally, 20 time/space regions are chosen over the basin (Fig. 5). These regions are equally dis-tributed to cover different latitudes where propagations are well correlated with their chlorophyll signature.
For each area, we explain in detail dissolved inorganic ni-trogen and phytoplankton modelled source and sink terms, as well as associated advective and diffusive terms, calcu-lated at each time step during the model integration. Each quantity is vertically integrated over 112 m depth. Values ob-tained are then averaged in longitude over the positive or the negative chlorophyll anomalies. The value for the lack of chlorophyll anomaly (case CA0) is estimated from an av-erage of values from the western boundary of the phyll trough, between the chlorophyll crest and the phyll trough and from the eastern boundary of the chloro-phyll crest. The three integrated and averaged values (for CA−, CA0 and CA+) are then integrated over the time period (Fig. 6). The integrated terms (biogeochemical, advection and diffusion in mmolN m−2) are then obtained for each re-gion over the chlorophyll signature of the wave crest (CA+), the wave trough (CA−) and for assumed background condi-tions (CA0).
Fig. 7. Primary production increases (in %) following the latitude over the positive (CA+, blue△) and the negative (CA−, red▽) chlorophyll anomalies. Quantities are integrated over the time pe-riod, 112 m depth and averaged in longitude. The percentage of in-crease is derived from the value for the lack of chlorophyll anomaly. Vertical dotted lines are limiting the regions described in the text.
6 Results
Two kinds of terms are then extracted: the biological fluxes between the ecosystem components and the physical advec-tion/diffusion terms. To understand the origin of higher chlorophyll concentrations due to the wave’s passage, the horizontal and vertical advection terms as well as the ver-tical diffusion are analysed (the MUSCL advection scheme does not resolve any horizontal diffusion).
6.1 Chlorophyll wave crest and primary production First, the terms for the chlorophyll signature of the wave crest (CA+) are analysed. The influence on primary production is obtained for each region (Fig. 7) and then the underlying physical processes investigated (Figs. 8–10). Indeed, the pri-mary production, which is nutrient-limited between 8◦N and 40◦N, is function of dissolved inorganic nitrogen and phyto-plankton concentrations (Eq. 2). Results are very sensitive to the latitude and the time period considered. Nevertheless, we can consider five main subgroups for different zonal bands.
In the northern part of the domain, north of 39◦N, two main regions are considered1:
– Region 1: 40◦N–41.3◦W – Region 2: 39.5◦N–34.3◦W
A +10.5% increase2 in primary production is obtained
1Regions are identified using the latitude and the easternmost position of the wave during the given period.
(a) (b)
Fig. 8. Meridional (yad), zonal (xad) and vertical (zad) advection of phytoplankton (phy) and dissolved inorganic nitrogen (no3), vertical diffusion of phytoplankton (zdf phy) and inorganic nitrogen (zdf no3) and primary production (IPP) at 40◦N–41.3◦W (Region 1) from 11 January to 3 February 1998(a)and 39.5◦N–34.3◦W (Region 2) from 3 May to 17 May 1998(b). The coordinates used to identify the regions are the latitude and the easternmost position of the wave during the given period. These quantities are integrated over the time period, 112 m depth and averaged in longitude over the positive (blue) and the negative (red) chlorophyll anomalies. The percentage of increase (top) is derived from the value for the lack of chlorophyll anomaly. The bottom figure represents the total values in mmolN m−2of the integrated fluxes over the positive (blue), the negative (red) anomalies, and the background condition (green). The Y-axis is divided in five intervals: [−100−20], [−20−0.1], [−0.1 0.1], [0.1 20], and [20 100].
for the northernmost latitude (Region 1). This value can be associated with the meridional advection processes (dissolved inorganic nitrogen and phytoplankton). In-deed, the phytoplankton meridional advection and the in-organic nitrogen meridional advection are reaching re-spectively more than+140% (3.6×10⁻²mmolN m−2) and +78% (2.71 mmolN m−2) of the CA0 condition, respectively (Fig. 8a). Figure 9 highlights the largest dissolved inorganic nitrogen concentration along the chlorophyll signature of the wave crest (CA+) compared to the mean background condi-tion. At the opposite, a strong decrease in primary produc-tion (−34.3%) can be noticed in the southernmost latitude (39.5◦N–34.3◦W) (Fig. 8b). This decreasing production is
mainly explained by a strong diminution of the vertical inor-ganic nitrogen advection (−7.9×10⁻²mmolN m−2) and
dif-fusion (−1.06 mmolN m−2). The CA+ is then mainly
ex-plained by an increase of meridional phytoplankton advec-tion and vertical phytoplankton diffusion (Fig. 8b). These first results illustrate the complex variability in the Rossby wave influence on primary production. Furthermore, these two close latitudes are corresponding to very different time periods (winter in Region 1 and spring in Region
value of CA0 and multiplied by 100: for instance (100[(CA+)– CA0]/|CA0|).
(a) (b)
Fig. 10. Same quantities as represented in Fig. 8 at 37.1◦N–32.7◦W (Region 4) from 28 December 1997 to 18 February 1998(a)and 29.9◦N–32.7◦W (Region 9) from 5 April to 8 July 1998(b).
2) associated with two different biogeochemical regimes (bloom in spring). In spring, the primary production as-sociated with the CA+ will then decrease due to the limit-ing effect of the vertical inorganic nitrogen advection. The combination of these different factors linked to biogeochem-ical background and Rossby wave features can easily explain such a difference between these two situations.
Further south, eight extracted regions between 29 and 39◦N are considered together1:
– Region 3: 38.9◦N–42◦W –+0.2% – Region 4: 37.1◦N–32.7◦W –+12.3% – Region 5: 34.7◦N–37◦W –+7.2% – Region 6: 34.7◦N–40◦W –−8.3% – Region 7: 32.2◦N–31.3◦W –+2.7% – Region 8: 31.9◦N–41.7◦W –+3.1% – Region 9: 29.9◦N–32.7◦W –−10.6% – Region 10: 29.6◦N–47.3◦W –+9.4%
In this band, primary production is slightly increasing be-tween CA0 and CA+ except for the Region 6 and Region 9 where the primary production is decreasing (−8.3% and −10.6% respectively). For these different cases, the pri-mary production increase is mainly driven by the horizontal advection and vertical diffusion of phytoplankton and dis-solved inorganic nitrogen. The vertical advection is also playing a role but the nitrogen concentrations upwelled are weak (less than 8×10⁻³mmolN m−2) compared to the diffu-sion (larger than 1.2 mmolN m−2). For example, in Fig. 10a (Region 4), the CA+ is associated with a strong enhance-ment of the meridional phytoplankton advection. By con-trast, in Fig. 10b, we observe that the primary production
diminution is due to decreases in horizontal phytoplankton and inorganic nitrogen advection (−0.13 mmolN m−2 and −0.57 mmolN m−2). Decreases in vertical advection are
weaker (−9.36×10⁻³mmolN m−2 for phytoplankton and −1×10⁻²mmolN m−2for DIN).
Between 25◦N and 26◦N, two wave signatures are
fol-lowed for two very close latitudes: – Region 11: 25.8◦N–38.7◦W – Region 12: 25.5◦N–44.7◦W
and with a common initial time but for a longer time pe-riod in the case of the easternmost longitude (from 26 March to 10 June in Region 12 and to 13 August in Region 11). Surprisingly, the effects of the wave passage on the pri-mary production are completely different. For the east-ernmost region (Fig. 5), we observe a strong decrease in primary production associated with CA+ (−19.9%) due to smaller dissolved inorganic concentrations (Fig. 11 – Region 11). At the other location, we found a+20.3% augmenta-tion related to an increase in dissolved inorganic nitrogen concentrations (Fig. 11 – Region 12). The source of the increase is associated with vertical and horizontal sources of dissolved inorganic nitrogen with a larger contribution from the vertical diffusion of dissolved inorganic nitrogen (+3.33 mmolN m−2).
Wave signatures are tracked for different time periods at 20.6◦N and 18.7◦N:
Fig. 11.Vertical dissolved inorganic nitrogen distribution along the chlorophyll signature of the wave crest (CA+) and CA0 for the re-gion 25.5◦N–44.7◦W (Region 12, top) and 25.8◦N–38.7◦W (Re-gion 11, bottom). White dashed lines represent the depths 50 m, 100 m, 150 m.
First, at 20.6◦N, primary production enhancements are ob-served. These are estimated at +3.4% over a period (26 July to 18 December) and +12.7% over a shorter time period (18 August to 18 December). The vertical diffu-sion of phytoplankton allows to explain this production in-crease. Indeed, vertical phytoplankton profiles show a sub-surface maximum around 80 m depth more intense along the CA+ (Fig. 12). The difference between these two val-ues is associated with the integration time period and high-lights a negative effect on primary production in the CA+ between mid-July and mid-August 1998 for this latitude. At 18.7◦N, a −13.9% decrease is obtained in the eastern part. This last decrease is associated with a diminution of the meridional advection and vertical diffusion of phy-toplankton (−0.17 mmolN m−2 and−0.4 mmolN m−2) and dissolved inorganic nitrogen (−2.3×10⁻²mmolN m−2 and −2.9×10⁻²mmolN m−2) during the wave passage.
Finally in the southern part of the domain (9◦N–15◦N),
four extracted regions are considered: – Region 17: 14.8◦N–34.7◦W –+15.8%
– Region 18: 14.8◦N–41◦W –+8.4%
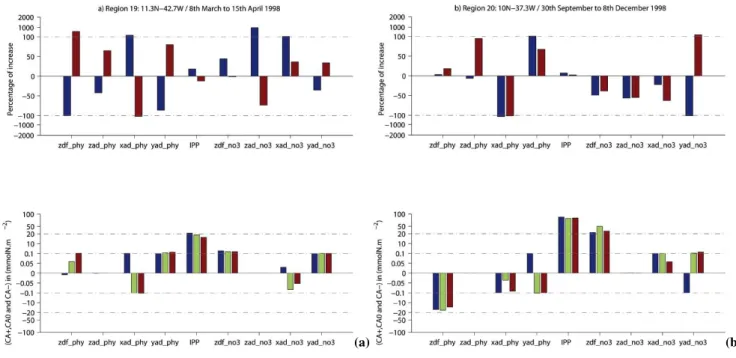
– Region 19: 11.3◦N–42.7◦W –+18.2% – Region 20: 10◦N–37.3◦W –+7.3%
The analysed wave signatures are initially tracked east of the mid-Atlantic Ridge Region 17 and Region 20) and over the Ridge (Region 18 and Region 19). The westernmost waves are observed earlier during the year than the easternmost propagations. In every case, an increase in primary
produc-Fig. 12. Vertical phytoplankton distribution along CA+ and CA0 for the two regions at 20.6◦N. White dashed lines mark the start of the shortest and westernmost region.
tion associated with CA+ is noticed. It appears that wave signatures from the eastern part of the basin observed during autumn have a weaker impact on primary production than those observed in spring and summer. This is in agreement with a more stratified ocean in summer. Indeed, when we de-tail the processes involved, the vertical input of dissolved in-organic nitrogen explains the production increase (Fig. 13a). By contrast, during the less productive season, the primary production increase associated with the wave signature is due to meridional phytoplankton advection and vertical phyto-plankton diffusion (Fig. 13b). There is no significant inor-ganic nitrogen advective input.
6.2 Chlorophyll wave trough and primary production After analyzing the processes explaining the surface chloro-phyll positive anomaly and the impact on the primary pro-duction, the opposite situation during the chlorophyll neg-ative anomaly (CA−) is explored. It generally appears in the southern part of the domain that the CA−is associated with reduced primary production (Fig. 7). This first result confirms that the vertical advection of dissolved organic ni-trogen or phytoplankton is never the only process involved during the wave’s passage. This effect needs then to be off-set by different mechanisms such as horizontal advection to explain the decrease in primary production measured as well as the negative surface chlorophyll anomaly.
(a) (b)
Fig. 13.Same quantities as represented in Fig. 8 at 11.3◦N–42.7◦W (Region 19) from 8 March to 15 April 1998(a)and 10◦N–37.3◦W (Region 20) from 30 September to 8 December 1998(b).
More surprisingly, we can remark that when the primary production is decreasing over the CA+, the situation in the CA− is opposite and we generally observe an increase in primary production associated with the CA−. This result suggests the important role of meridional advective mecha-nisms as suggested by Killworth et al. (2004) and Charria et al. (2006a). Indeed, in the case of an horizontal advection, the chlorophyll is similar to a passive tracer and only reacts to the physical forcing without significant changes in the bio-geochemical processes. These purely physical processes are theoretically symmetrical between the crest and the trough of a Rossby wave. This bipolar system reflects a symmet-ric effect of the Rossby waves on primary production which suggests that the net effect of Rossby waves on primary pro-duction would be very small.
7 Discussion
In the present work, the different biogeochemical-physical mechanisms explaining the surface chlorophyll signature of Rossby waves are investigated through the exploration of the effect of these waves on primary production. The use of a re-alistic coupled physical/biogeochemical model in the North Atlantic allows to detail separately the positive and negative surface chlorophyll anomalies associated with these waves.
The biogeochemical advective and diffusive fluxes anal-ysed for 20 areas highlight the fact that the increase of phy-toplankton biomass in the CA+ is due to a complex com-bination of vertical and meridional processes depending on
the considered latitude. This surface chlorophyll positive anomaly is associated with various patterns of primary pro-duction depending upon season and region (latitude and lon-gitude). Previous studies with remotely sensed data and the-oretical modelling from Killworth et al. (2004) and Charria et al. (2006a) showed that south of 28◦N the Rossby wave sig-nature in chlorophyll concentration can be mostly explained by the meridional chlorophyll advection. When we com-pare those results to the present work (Fig. 14), the role of the horizontal advection is also noticed but several regions highlight also a strong effect of the dissolved inorganic ni-trogen vertical inputs by advection and diffusion. Based on the 20 present regions analysed, the different relative contri-butions north and south of 28◦N (as described in Charria et al., 2006a) are not fully reproduced. This can be partly ex-plained by the limited time period and the specific location of the selected regions. Furthermore, several assumptions had been made to compare remotely sensed data and theo-retical modelling in Killworth et al. (2004) and Charria et al. (2006a). Indeed, a simple term had been used to represent the source and sinks biogeochemical terms in the theoretical model and several statistical assumptions had been made to fit the model outputs with observations. However, the present results of the realistic simulations confirm the weak contri-bution of the vertical advection and diffusion of chlorophyll, apparent in the whole domain (Fig. 14) except in one or two locations.
of primary production due to the wave passage, values be-tween−34.3% (latitude 39.5◦N–34.3◦W) and+20.3%
(lat-itude 25.5◦N–44.7◦W) in percentage of increase and
be-tween −7.07 mmolN m−2 (latitude 29.9◦N–32.7◦W) and +9.42 mmolN m−2(latitude 14.8◦N–34.7◦W) are obtained. These values represent the difference between CA+ and CA0 primary productions (divided by the CA0 primary production for the percentages). It appears that the relative increases are mainly sustained by vertical diffusion processes and hor-izontal advection. Furthermore, the vertical inputs of dis-solved inorganic nitrogen seem to be systematically involved in spring and summer when the increases of primary produc-tion are exceeding 5%. By contrast, decreases in primary production associated with the CA+ are generally due to a decrease of the vertical advection and diffusion of dissolved inorganic nitrogen. For the other situations, the primary pro-duction decreases associated with CA+ can be explained by a contribution of the meridional advection of phytoplankton. Kawamiya and Oschlies (2001), with the same kind of cou-pled physical/biogeochemical model applied in the Indian Ocean, showed that Rossby waves can induce a∼30% in-crease of primary production associated with the uplifting of the deep chlorophyll maximum during the wave passage. In the Pacific, Sakamoto et al. (2004), based on local measure-ments at the ALOHA site and on an estimated relationship between primary production and Sea Surface Height anoma-lies estimated near the HOT station ALOHA, showed similar increases in primary production reaching 25%. They were linked to nitrate injection in the euphotic layer during two well identified passages of Rossby waves. Using the same re-lationship, these authors conclude on a limited role of Rossby waves, which induce a mean primary production enhance-ment lower than 5–10% over the 1997–1999 period. These values are also comparable to our estimations over the se-lected transects in the North Atlantic Ocean.
Consequently, our results suggest a net weak effect of Rossby waves on primary production.
These estimations need however to be considered care-fully. These results using a realistic ocean general circulation model in the North Atlantic are obtained on a small set of zonal sections mainly located in low production provinces, and for a short time period. Furthermore, the method used to identify wave propagation in surface chlorophyll con-centrations is based on several assumptions necessary to perform this first detailed analysis of the coupled physi-cal/biogeochemical processes involved during the Rossby wave propagation. Another point that needs further inves-tigation is whether the signal is due to Rossby waves, ed-dies or both. A recent study from Chelton et al. (2007) sug-gests that most westward propagating features observed in remotely sensed sea surface height are the signature of non linear propagating eddies. In the North Atlantic, more than 25% of the variance is explained by eddies instead of Rossby waves west of 53◦W and north of 32◦N. In our studied do-main, 14 out of 20 regions are located south of 32◦N and
Fig. 14. Relative contribution (in %) of the three processes which can explain the chlorophyll signature of Rossby waves: horizontal advection, upwelling of dissolved inorganic nitrogen in the euphotic zone and uplifting of the subsurface chlorophyll maximum. The black dots represent the results from Charria et al. (2006a) north of 28◦N(a)and south of 28◦N(b)between 9.5◦N and 40.5◦N. The superimposed red crosses represent the 20 regions analysed in this study with the 3-D model outputs. The horizontal advection is the sum of the zonal and meridional chlorophyll and inorganic nitrogen advections. The upwelling of nitrates is the sum of verti-cal advection and diffusion for dissolved inorganic nitrogen. The uplifting of chlorophyll is the sum of vertical advection and diffu-sion for chlorophyll. The relative contributions are computed from the mechanisms associated with the chlorophyll wave crest in each region.
east of 53◦W which is a region where non linear eddies are
not predominant (Chelton et al., 2007). Furthermore, Isach-sen et al. (2007) showed that, in a large ocean basin, baro-clinic Rossby waves north of 30◦N are unstable. North of
in primary production which suggests a wave-like process acting instead of non linear eddies.
8 Conclusions
Rossby waves, a process previously observed with remotely sensed data, were modelled using a 3-D coupled phys-ical/biogeochemical model in the North Atlantic ocean. Waves are well reproduced as well as their signature in sur-face chlorophyll concentrations. The analysis based on 20 regions showed the important contribution of horizontal ad-vection and of vertical inorganic dissolved nitrogen advec-tion and diffusion. The main mechanism involved differs ac-cording to the biogeochemical conditions (due to latitude and time period). Furthermore, Rossby waves have a non negli-gible influence on primary production which can be quanti-fied using coupled 3-D modelling. Indeed, positive surface chlorophyll anomalies are generally associated with an in-crease in primary production. This approach also allowed to explore the influence of chlorophyll troughs on primary production and a negative effect was observed. The net im-pact of Rossby waves on primary production, based on the 20 regions analysed, seems to be weak due to the symmet-rical shape of the wave effects (between crest and trough). However, as suggested by Sakamoto et al. (2004), inputs of dissolved inorganic nitrogen can induce shifts in the phyto-plankton community structure and consequently increase the exported production. This approach using a limited number of specific time-longitude cases needs to be extended to the whole basin in order to quantify the net basin scale effect of Rossby waves on primary production. To perform this estimation, we need to investigate what happens when the Rossby wave effect is removed. This calls for a more sys-tematic study with coupled physical/biogeochemical models where Rossby waves can be switched on and off.
Acknowledgements. Financial support for this work was provided by the GMMC (Groupe Mission MERCATOR/CORIOLIS) to LEGOS (Toulouse, France). The physical model was provided by MERCATOR (http://www.mercator-ocean.fr). The calculations were conducted with the support of IDRIS/CNRS. The work was funded by CNES and IFREMER through a PhD fellowship, by the University Paul Sabatier through a postdoctoral fellowship and by the European Commission through a Marie-Curie post-doctoral fellowship (MEIF-CT-2006-039180). Wavelet software was provided by C. Torrence and G. Compo, and is available at http://paos.colorado.edu/research/wavelets/. We are grateful to B. Salihoglu, J. Sudre, M.-H. Radenac, and B. Mete Uz for their remarks and suggestions, J. Llido for his participation in the model validation as well as the three anonymous referees for their very fruitful and constructive comments on this manuscript.
Edited by: J. M. Huthnance
References
Barnier, B., Madec, G., Penduff, T., et al.: Impact of partial steps and momentum advection schemes in a global ocean circulation model at eddy-permitting resolution, Ocean Dynam., 56, 543– 567, 2006.
Challenor, P. G., Cipollini, P., and Cromwell, D.: Use of the 3D Radon Transform to Examine the Properties of Oceanic Rossby Waves, J. Atmos. Oceanic Tech., 18, 1558–1566, 2001, See also: Corrigendum: J. Atmos. Oceanic Tech., 19, 828, 2002.
Charria, G., M´elin, F., Dadou, I., Radenac, M. H., and Garc¸on, V.: Rossby wave and ocean colour: The cells uplifting hypothesis in the South Atlantic Subtropical Convergence Zone, Geophys. Res. Lett., 30, 1125, doi:10.1029/2002GL016390, 2003. Charria, G.: Influence of Rossby waves on the biogeochemical
sys-tem in the North Atlantic Ocean: Use of ocean colour remotely sensed data and of a coupled physical/biogeochemical model, PhD thesis, University Paul Sabatier, Toulouse, France, 339 pp., 2005.
Charria, G., Dadou, I., Cipollini, P., Dr´evillon, M., De Mey, P., and Garc¸on, V.: Understanding the influence of Rossby waves on surface chlorophyll concentrations in the North Atlantic Ocean, J. Mar. Res., 64, 43–71, 2006a.
Charria, G., Dadou, I., Dr´evillon, M., Llido, J., and Garc¸on, V.: Coupled physical/biogeochemical modelling at mesoscale in the North Atlantic Ocean: Rossby waves, a coupled process exam-ple, Mercator Ocean Quarterly Newsletter, 20, 20–27, 2006b. Charria, G., Dadou, I., Llido, J., Dr´evillon, M., and Garc¸on, V.:
Importance of Dissolved Organic Nitrogen in the North Atlantic Ocean to sustain primary production: a 3D modeling view, Bio-geosciences Discuss., 5, 1727–1764, 2008,
http://www.biogeosciences-discuss.net/5/1727/2008/.
Chelton, D. B., Schlax, M. G., Samelson, R. M., and de Szoeke, R. A.: Global observations of large oceanic eddies, Geophys. Res. Lett., 34, L15606, doi:10.1029/2007GL030812, 2007.
Cipollini, P., Cromwell, D., Jones, M. S., Quartly, G. D., and Chal-lenor, P. G.: Concurrent altimeter and infrared observations of Rossby wave propagation near 34◦N in the Northeast Atlantic, Geophys. Res. Lett., 248, 889–892, 1997.
Cipollini, P., Cromwell, D., Challenor, P. G., and Raffaglio, S.: Rossby waves detected in global ocean colour data, Geophys. Res. Lett., 28, 323–326, 2001.
Conkright, M. E., Garcia, H. E., O’Brien, T. D., Locarnini, R. A., Boyer, T. P., Stephens, C., and Antonov, J. I.: World Ocean Atlas 2001, Volume 4: Nutrients, edited by: Levitus, S., NOAA Atlas NESDIS 52, U.S. Government Printing Office, Wash., DC., 392 pp., CD-ROMS, 2002.
Ducet, N., Le Traon, P. Y., and Reverdin, G.: Global high-resolution mapping of ocean circulation from TOPEX/Poseidon and ERS-1 and -2, J. Geophys. Res., 105, 19 477–19 498, 2000.
Evans, G. T. and Parslow, J. S.: A Model of Annual Plankton Cy-cles, Biol. Oceanogr., 3, 327–347, 1985.
Hill, K. L., Robinson, I. S., and Cipollini, P.: Propagation charac-teristics of extratropical planetary waves observed in the ATSR global sea surface temperature record, J. Geophys. Res., 105, 21 927–21 945, 2000.
Huret, M., Dadou, I., Dumas, F., Lazure, P., and Garc¸on, V.: Cou-pling physical and biogeochemical processes in the R´ıo de la Plata plume, Cont. Shelf Res., 25, 629–653, 2005.
calibrated with BATS data, Deep-Sea Res. Pt II, 43, 653–683, 1996.
Isachsen, P. E., LaCasce, J. H., and Pedlosky, J.: Rossby wave insta-bility and apparent phase speeds in large ocean basins, J. Phys. Oceanogr., 37, 1177–1191, 2007.
Kawamiya, M. and Oschlies, A.: Formation of a basin-scale surface chlorophyll pattern by Rossby waves, Geophys. Res. Lett., 28, 4139–4142, 2001.
Killworth, P. D. and Blundell, J. R.: Long Extratropical Planetary Wave Propagation in the Presence of Slowly Varying Mean Flow and Bottom Topography. Part II: Ray Propagation and Compari-son with Observations, J. Phys. Oceanogr., 33, 802–821, 2003. Killworth, P. D., Cipollini, P., Uz, B. M., and Blundell, J. R.:
Phys-ical and biologPhys-ical mechanisms for planetary waves observed in sea-surface chlorophyll, J. Geophys. Res., 109, C07002, doi:10.1029/2003JC001768, 2004.
Le Traon, P.-Y., Nadal, F., and Ducet, N.: An improved mapping method of multi-satellite altimeter data, J. Atmos. Oceanic Tech., 15, 522–534, 1998.
L´evy, M., Estubier, A., and Madec, G.: Choice of an advection scheme for biogeochemical models, Geophys. Res. Lett., 28, 3725–3728, doi:10.1029/2001GL012947, 2001.
Liebig, J.: On the chemical processes in the nutrition of vegetables, Chemistry in it applications to agriculture and physiology, edited by: Playfair, L., Peterson, PA, USA, 1845.
McClain, C. R., Cleave, M. L., Fledman, G. C., Gregg, W. W., Hooker, S. B., and Kurig, N.: Science quality SeaWiFS data for global biosphere research, Sea Technol., 39, 10–16, 1998. Machu, E., Ferret, B., and Garc¸on, V.: Phytoplankton pigment
dis-tribution from SeaWiFS data in the subtropical convergence zone south of Africa: a wavelet analysis, Geophys. Res. Lett., 26, 1469–1472, 1999.
Madec, G. and Imbard, M.: A global ocean mesh to overcome the north pole singularity, Clim. Dynam., 12, 381–388, 1996. Mellor, G. L. and Wang, X. H.: Pressure compensation and the
bottom boundary layer, J. Phys. Oceanogr., 26, 2214–2222, doi:10.1175/1520-0485, 1996.
Mouri˜no-Carballido, B. and McGillicuddy Jr., D. J.: Mesoscale variability in the metabolic balance of the Sargasso Sea, Limnol. Oceanogr., 51, 2675–2689, 2006.
O’Reilly, J. E., Maritorena, S., Mitchell, B. G., Siegel, D. A., Carder, K. L., Garver, S. A., Kahru, M., and McClain, C.: Ocean color chlorophyll algorithms for SeaWiFS, J. Geophys. Res., 103, 24 937–24 953, 1998.
Oschlies, A.: Can eddies make ocean deserts bloom?, Global Bio-geochem. Cy., 16, 1106, doi:10.1029/2001GB001830, 2002a. Oschlies, A.: Nutrient supply to the surface waters of the
North Atlantic: A model study, J. Geophys. Res., 107, 3046, doi:10.1029/2000JC000275, 2002b.
Oschlies, A. and Garc¸on, V.: Eddy-induced enhancement of pri-mary production in a model of the North Atlantic Ocean, Nature, 394, 266–269, 1998.
Oschlies, A. and Garc¸on, V.: An eddy-permitting coupled physical-biological model of the North Atlantic. 1. Sensitivity to advection numerics and mixed layer physics, Global Biogeochem. Cy., 13, 135–160, 1999.
Polito, P. S. and Cornillon, P.: Long baroclinic Rossby waves de-tected by TOPEX/POSEIDON, J. Geophys. Res., 102, 3215– 3235, 1997.
Reynaud, T., Legrand, P., Mercier, H., and Barnier, B.: A new anal-ysis of hydrographic data in the Atlantic and its application to an inverse modelling study, International WOCE Newsletters, 32, 1998.
Roussenov, V., Williams, R. G., Mahaffey, C., and Wolff, G. A.: Does the transport of dissolved organic nutrients affect export production in the Atlantic Ocean?, Global Biogeochem. Cy., 20, GB3002, doi:10.1029/2005GB002510, 2006.
Sakamoto, C. M., Karl, D. M., Jannasch, H. W., Bidigare, R. R., Letelier, R. M., Waltz, P. M., Ryan, J. P., and Polito, P. S.: In-fluence of Rossby waves on nutrient dynamics and the plank-ton community structure in the North Pacific subtropical gyre, J. Geophys. Res., 109, C05032, doi:10.1029/2003JC001976, 2004. Siegel, D.: The Rossby Rototiller, Nature, 409, 576–577, 2001. Torrence, C. and Compo, G. P.: A practical guide to wavelet
analy-sis, B. Am. Meteorol. Soc., 79, 61–78, 1998.
Uz, B. M., Yoder, J. A., and Osychny, V.: Pumping of nutrients to ocean surface waters by the action of propagating planetary waves, Nature, 409, 597–600, 2001.