www.atmos-chem-phys.net/11/7583/2011/ doi:10.5194/acp-11-7583-2011
© Author(s) 2011. CC Attribution 3.0 License.
Chemistry
and Physics
Contributions of regional and intercontinental transport to surface
ozone in the Tokyo area
M. Yoshitomi1, O. Wild2, and H. Akimoto3
1Department of Earth and Planetary Sciences, Harvard University, Cambridge, MA, USA 2Lancaster Environment Centre, Lancaster University, Lancaster, UK
3Asia Center for Air Pollution Research, Niigata, Japan
Received: 16 December 2010 – Published in Atmos. Chem. Phys. Discuss.: 1 April 2011 Revised: 15 July 2011 – Accepted: 22 July 2011 – Published: 1 August 2011
Abstract. Japan lies downwind of the Asian continent and for much of the year air quality is directly influenced by emissions of ozone precursors over these heavily-populated and rapidly-industrializing regions. This study examines the extent to which oxidant transport from regional and dis-tant anthropogenic sources influences air quality in Japan in springtime, when these contributions are largest. We find that European and North American contributions to surface ozone over Japan in spring are persistent, averaging 3.5±1.1 ppb and 2.8±0.5 ppb respectively, and are greatest in cold con-tinental outflow conditions following the passage of cold fronts. Contributions from China are larger, 4.0±2.8 ppb, and more variable, as expected for a closer source region, and are generally highest near cold fronts preceding the influence of more distant sources. The stratosphere provides a varying but ever-present background of ozone of about 11.2±2.5 ppb during spring. Local sources over Japan and Korea have a relatively small impact on mean ozone, 2.4±7.6 ppb, but this
masks a strong diurnal signal, and local sources clearly dom-inate during episodes of high daytime ozone. By examining the meteorological mechanisms that favour transport from different source regions, we demonstrate that while maxi-mum foreign influence generally does not occur at the same time as the greatest buildup of oxidants from local sources, it retains a significant influence under these conditions. It is thus clear that while meteorological boundaries provide some protection from foreign influence during oxidant out-breaks in Tokyo, these distant sources still make a substantial contribution to exceedance of the Japanese ozone air quality standard in springtime.
Correspondence to:M. Yoshitomi
1 Introduction
Air pollution is now recognized as a global issue occur-ring over hemispheric scales through the intercontinental transport of air pollutants such as tropospheric ozone (O3),
aerosols, mercury, and persistent organic pollutants which have atmospheric lifetimes of greater than a week (Akimoto, 2003; Holloway et al., 2003; TF-HTAP, 2007). Rapid in-dustrialization in China, India and other Asian countries has involved increased energy consumption, affecting regional-scale air quality in Asia and beyond now and into the fu-ture (Prather et al., 2003; Dentener et al., 2006). Of partic-ular concern is surface ozone, the abundance of which has increased to 40–50 ppb in remote continental areas, a level at which it seriously affects air quality in many parts of the Northern Hemisphere (Pochanart et al., 2001, 2002; Lin et al., 2001; Fiore et al., 2002). Regional and intercontinental transport affect surface air quality in downwind areas (Jacob et al., 1999; Wilkening et al., 2000; Wild and Akimoto, 2001; Fiore et al., 2002; Jaffe et al., 2003), particularly at mid-latitudes (Berntsen et al., 1999), and also affect the oxidizing capacity of the atmosphere (Thompson, 1992) and regional climate (Berntsen et al., 1996; Mickley et al., 1999). It is now realized that intercontinental transport may affect local O3air
quality, adding to the effects of regional transboundary trans-port and local photochemical formation (TF-HTAP, 2007; Fiore et al., 2009). Previous atmospheric chemistry mod-eling studies have shown that increased precursor emissions in Asia may be sufficient to offset reductions in American emissions and may thereby counteract the beneficial effects of air quality controls in the US (Jacob et al., 1999; Yienger et al., 2000; Heald et al., 2003). In addition, regional in-creases in surface background O3and episodic exceedances
and human health in China and East Asia, leading to eco-nomic damage (e.g., Mauzerall and Wang, 2001; Wang and Mauzerall, 2004) as many developed countries have already experienced (Lippmann, 1991). Thus, a quantitative under-standing of the contributions of inter- and intra-continental transport may be as important for future air quality policy-making as an understanding of the effects of local emission controls (Wilkening, 2001; Fiore et al., 2003; Holloway et al., 2003).
Japan lies directly downwind of the Asian continent and is particularly susceptible to emissions from China and other Asian countries. Increases in surface O3have been reported
over Japan in the past decade (Lee et al., 1998; Ohara and Sakata, 2003; Naja and Akimoto, 2004; Tanimoto et al., 2009). This is of particular concern in the metropolitan area of Tokyo, where measurements of total photochemical oxidants (Ox, predominantly O3) have increased since the
1980s despite strong decreases in the main precursors, ni-trogen oxides (NOx=NO+NO2) and non-methane
hydrocar-bons (NMHCs) (Tokyo Metropolitan Government, 2005). It is not clear to what extent increased emissions of O3
precur-sors over China (Irie et al., 2005; Ohara et al., 2007) have influenced this trend, but it is likely that long-range transport of O3from the Asian continent has played a role. However, a
more complete attribution of these observed changes depends on a good understanding of the factors affecting O3over the
region, and on a reliable quantification of the roles of inter-and intra-continental transport, stratospheric influence, inter-and in situ formation in controlling O3, and an understanding of
how these factors are controlled by meteorological processes. The composition of air arriving over Japan is heavily in-fluenced by regional meteorology. Direct transport of pol-luted air from the Asian mainland is strongest in spring-time and is dominated by the passage of mid-latitude cy-clones (Kaneyasu et al., 2000; Bey et al., 2001; Wild et al., 2003; Tanimoto et al., 2005). High levels of pollutants are found in the boundary layer following these frontal systems (Carmichael et al., 1998; Liu et al., 2003; Liang et al., 2004; Sawa et al., 2007), and pollutants lifted by convection and warm conveyor belts in these systems may be rapidly trans-ported across the Pacific (Bey et al., 2001; Stohl, 2001; Heald et al., 2003; Miyazaki et al., 2003) and subsequently detected over North America (Jaffe et al., 2003; Jaegl´e et al., 2003). Influence from more distant sources such as Europe may af-fect Japan during periods of post-frontal outflow from Asia (e.g., Liu et al., 2003; Lin et al., 2010), but the magnitude and timing of these events remains uncertain. Photochemical production of O3is greatest in summertime, but over Japan
exceedance of urban air quality standards is more common in spring, as the prevailing westerly flow brings continen-tal air with much higher levels of O3than is present in the
tropical marine air from the Western Pacific that dominates in summer (e.g., Tanimoto et al., 2005; Yamaji et al., 2006). Continental sources may thus affect air quality attainment in Japanese cities, but the extent of their influence is not known.
This study aims to determine how local, regional and dis-tant sources contribute to surface O3 over Japan in
spring-time and the extent to which they influence episodes of high O3over the Tokyo metropolitan area. We use observations
of O3and CO from surface measurement sites in Japan and
over the Western Pacific in spring 2001 to evaluate a global chemistry-transport model in Sect. 2, and then use the model to determine the contribution of selected precursor emission sources to O3over Japan during this period. In Sect. 3 we
fo-cus on the mean contribution from these sources and on their influence during key periods when O3air quality standards
are exceeded. We then examine the meteorological mecha-nisms that bring this air to Japan in Sect. 4, focusing on the pathways and timing of transport from the different source regions from a climatological perspective and during trans-port episodes of particular interest. We conclude by summa-rizing the influence that regional and intercontinental trans-port have on springtime air quality in Japan.
2 Model and evaluation against observations
This study uses the Frontier Research System for Global Change (FRSGC) version of the University of California, Irvine (UCI) global chemistry-transport model (CTM) (Wild and Prather, 2000) with the configuration described in Wild et al. (2003). The CTM is driven with pieced-forecast me-teorological fields generated with the European Centre for Medium-Range Weather Forecasts Integrated Forecast Sys-tem (ECMWF-IFS) at a spectral resolution of T159L40 at 3-h intervals, and t3-hese data are used 3-here at T63 (1.9◦×1.9◦) and T21 (5.6◦×5.6◦) resolution. The model was initialized in January 2000 and run for 16 months at T21 resolution, allow-ing a 1-yr spin-up and then coverallow-ing winter and sprallow-ing 2001. The period from January to April 2001 was repeated at the higher T63 resolution. The spring 2001 period was chosen to coincide with the NASA Transport and Chemical Evolution over the Pacific (TRACE-P) measurement campaign over the Western Pacific (Jacob et al., 2003), and previous studies us-ing the model have been evaluated against observational data from this campaign (Wild et al., 2003). Global industrial and fossil fuel emissions of O3precursors used in this study are
taken from version 2 of the EDGAR database (Olivier et al., 1996), and emissions for East Asia are updated from Streets et al. (2003); these and other emissions are described in more detail in Wild et al. (2003).
The performance of the model during spring 2001 is eval-uated with hourly observational data for surface O3from 10
measurement sites in the Acid Deposition Monitoring Net-work in East Asia (EANET) (NetNet-work Center for EANET, 2005) and with O3 and CO from four World
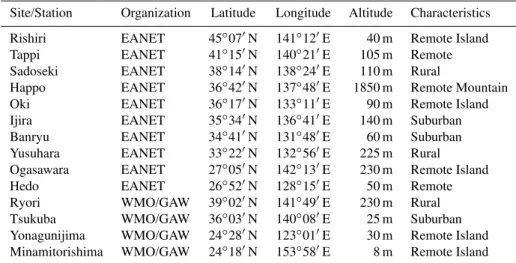
Table 1.List of EANET Measurement Sites and WMO/GAW Stations Used.
Site/Station Organization Latitude Longitude Altitude Characteristics
Rishiri EANET 45◦07′N 141◦12′E 40 m Remote Island
Tappi EANET 41◦15′N 140◦21′E 105 m Remote
Sadoseki EANET 38◦14′N 138◦24′E 110 m Rural
Happo EANET 36◦42′N 137◦48′E 1850 m Remote Mountain
Oki EANET 36◦17′N 133◦11′E 90 m Remote Island
Ijira EANET 35◦34′N 136◦41′E 140 m Suburban
Banryu EANET 34◦41′N 131◦48′E 60 m Suburban
Yusuhara EANET 33◦22′N 132◦56′E 225 m Rural
Ogasawara EANET 27◦05′N 142◦13′E 230 m Remote Island
Hedo EANET 26◦52′N 128◦15′E 50 m Remote
Ryori WMO/GAW 39◦02′N 141◦49′E 230 m Rural
Tsukuba WMO/GAW 36◦03′N 140◦08′E 25 m Suburban
Yonagunijima WMO/GAW 24◦28′N 123◦01′E 30 m Remote Island
Minamitorishima WMO/GAW 24◦18′N 153◦58′E 8 m Remote Island
110 120 130 140 150 160
20 30 40 50
1
2
3
4 5
6 7
8
9 10
11
12
13 14
1. Rishiri 2. Tappi 3. Sadoseki 4. Happo 5. Oki 6. Ijira 7. Banryu 8. Yusuhara 9. Ogasawara 10. Hedo 11. Ryori 12. Tsukuba 13. Yonagunijima 14. Minamitorishima
Fig. 1.Locations of EANET and WMO/GAW stations used in eval-uating model performance.
based on their chemical environment. Eight clean coastal or mountain sites are categorized as remote, three sites showing strong pollution signatures are designated as suburban, and the remaining three sites showing some influence from local sources are denoted as rural. These observations are com-pared with hourly model results sampled from the nearest grid box at each resolution.
We first examine the model performance at remote sites which provide an effective test of the ECMWF-IFS mete-orology and the ability of the CTM to correctly represent the chemical environment in clean, background conditions. Figure 2 shows the hourly timeseries of O3 and CO at
Mi-namitorishima, a remote island lying almost 2000 km south-east of Tokyo. The prevailing influence in early spring is from continental air masses that have crossed Asia, but this
flow is increasingly punctuated by the arrival of clean, ma-rine air masses from the Central Pacific. The variability in O3and CO in springtime is largely driven by the interplay
between these air masses, and the location and timing of the meteorological features controlling this variability are cap-tured very well by the ECMWF-IFS model. Surface O3 in
continental air averages about 50 ppb, and in marine air av-erages about 15 ppb, and these abundances are reproduced well by the CTM, suggesting that the background chemical environments over the Western Pacific in spring can be rep-resented well. The variability in CO is smaller, but frequent episodes of high CO reveal the passage of cold frontal sys-tems which sweep away the clean, marine air and bring CO directly from the Asian continent, as previous studies have shown (Liu et al., 2003; Sawa et al., 2007). The abundance of CO in these environments is captured well by the CTM. The results are not very sensitive to model resolution at this location, although the position of meteorological features is better resolved at T63 where there is less spatial averaging of the input meteorological data, and the model bias is conse-quently reduced.
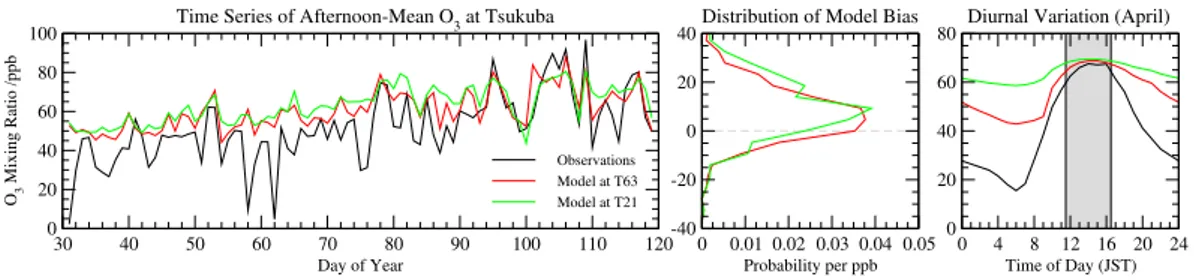
Polluted, continental conditions are more challenging to model but provide a more critical test of emissions, chem-istry and deposition processes in the CTM. Figure 3 shows the time series of afternoon-mean surface O3at Tsukuba, a
suburban site about 50 km northeast of Tokyo. There is a strong diurnal variation in the observations, with very low nighttime O3 driven by both surface deposition and direct
30 40 50 60 70 80 90 100 110 120 0
20 40 60 80
O3
Mixing Ratio /ppb
0 0.01 0.02 0.03 0.04 0.05
0 20 40 60 80
0 0.02 0.04 0.06 0.08 0.1 0.12 -40
-20 0 20 40
T63 T21
30 40 50 60 70 80 90 100 110 120
Day of Year
0 50 100 150 200 250 300
CO Mixing Ratio /ppb
Observations Model at T63 Model at T21
0 0.005 0.01 0.015 0.02
Probability per ppb
0 50 100 150 200 250 300
0 0.01 0.02 0.03 0.04
Probability per ppb
-150 -100 -50 0 50 100 150
Time Series at Minamitorishima Probability Distribution Distribution of Model Bias
O3 O3 O3
CO CO CO
Fig. 2. Timeseries of hourly-mean surface O3and CO observations at Minamitorishima WMO/GAW station in February–April 2001 and FRSGC/UCI CTM results at T21 and T63 resolution. Right-hand panels show the probability distribution over the period and the distribution of the hourly model bias at each resolution.
30 40 50 60 70 80 90 100 110 120
Day of Year
0 20 40 60 80 100
O3
Mixing Ratio /ppb
Observations Model at T63 Model at T21
0 0.01 0.02 0.03 0.04 0.05
Probability per ppb
-40 -20 0 20 40
0 4 8 12 16 20 24
Time of Day (JST)
0 20 40 60 80
Time Series of Afternoon-Mean O3 at Tsukuba Distribution of Model Bias Diurnal Variation (April)
Fig. 3. Comparison of afternoon-mean O3 observations (12:00–16:00 h JST) at Tsukuba WMO/GAW station (black) with CTM results at T21 (green) and T63 (red) resolution. Right-hand panels show the distribution of the hourly model bias and the monthly mean diurnal
variation in observed and modelled O3in April.
area. To minimize the influence of nighttime removal we compare afternoon concentrations (12:00–16:00 LT) which are dominated by photochemical production of O3. These
values are matched more closely by the CTM, and while there is still overestimation of all but the highest daytime lev-els in February and March, the main features and magnitude of urban O3are reproduced well in April.
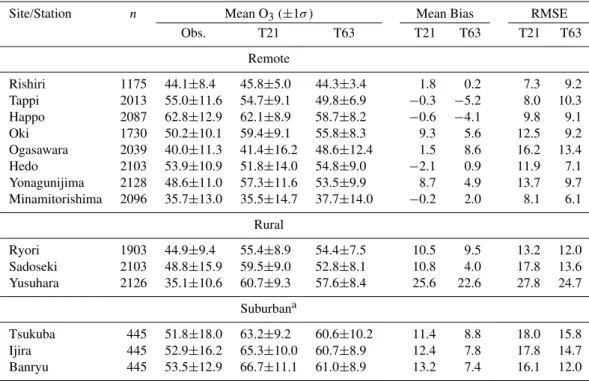
The performance of the model at other locations is shown in Fig. 4, and a statistical summary of the comparisons for the whole February–April 2001 period is given in Table 2. Where observational data are missing due to instrument fail-ure or calibration errors, model data are also removed so that the sampling is identical, and the number of observations used is given in Table 2. Mean values, mean bias and root-mean-square error (RMSE) are presented for both T21 and T63 simulations. The mean bias and RMSE are generally less than 10 ppb for the more remote measurement sites, but are substantially greater at rural and suburban sites where the efficiency of nighttime removal is not captured. The remote site at Yonagunijima lies close to Taiwan and is strongly in-fluenced by urban emissions from Taipei at the coarse model resolutions used here; similarly Oki and the coastal sites of
Yusuhara, Sadoseki and Ryori are dominated by marine air flows but are artificially influenced by Japanese industrial regions in the model. Tappi shows little variability in O3
in air from the continent in February, but experiences high levels of O3from Japanese sources in April as the
prevail-ing flow changes. Island sites south of Japan such as Oga-sawara, Hedo and Yonagunijima show the higher variability in O3characteristic of frontal influence, as seen at
Minami-torishima, although there is a tendency to overestimate O3
in continental air, particularly at T21 resolution. Compari-son with CO at the WMO/GAW stations, summarized in Ta-ble 3, presents a similar picture, with synoptic features cap-tured well, but there is a small negative mean bias, and CO is underestimated during pollution episodes and in fine-scale meteorological features such as the frontal banding seen in Fig. 2, contributing to the higher RMS error.
The model run at T63 (1.9◦) resolution generally shows smaller mean biases and RMS errors than the T21 (5.6◦) run as meteorological features are better resolved, see Table 2. Mean O3levels are lower at T63 reflecting an overestimation
of regional O3production and background continental O3
30 40 50 60 70 80 90 100 110 120 0
20 40 60 80 100 120
O3
Mixing Ratio /ppb
30 40 50 60 70 80 90 100 110 120
0 20 40 60 80 100 120
30 40 50 60 70 80 90 100 110 120
0 20 40 60 80 100
O3
Mixing Ratio /ppb
30 40 50 60 70 80 90 100 110 120
0 20 40 60 80 100
Observations Model (T21) Model (T63)
30 40 50 60 70 80 90 100 110 120
Day of Year
0 20 40 60 80 100
O3
Mixing Ratio /ppb
30 40 50 60 70 80 90 100 110 120
Day of Year
0 20 40 60 80 100
Tappi (41oN)
Hedo (27oN)
Yonagunijima (24oN)
Happo (37oN)
Oki (36oN)
Ogasawara (27oN)
Fig. 4.Time series of hourly-mean O3observations at selected remote EANET and WMO/GAW measurement sites in February–April 2001 (black) and FRSGC/UCI CTM results at T21 (green) and T63 (red) resolution.
Table 2.Statistical Summary of Observed and Modeled Hourly Surface O3(in ppb) in February–April 2001.
Site/Station n Mean O3(±1σ) Mean Bias RMSE
Obs. T21 T63 T21 T63 T21 T63
Remote
Rishiri 1175 44.1±8.4 45.8±5.0 44.3±3.4 1.8 0.2 7.3 9.2
Tappi 2013 55.0±11.6 54.7±9.1 49.8±6.9 −0.3 −5.2 8.0 10.3
Happo 2087 62.8±12.9 62.1±8.9 58.7±8.2 −0.6 −4.1 9.8 9.1
Oki 1730 50.2±10.1 59.4±9.1 55.8±8.3 9.3 5.6 12.5 9.2
Ogasawara 2039 40.0±11.3 41.4±16.2 48.6±12.4 1.5 8.6 16.2 13.4
Hedo 2103 53.9±10.9 51.8±14.0 54.8±9.0 −2.1 0.9 11.9 7.1
Yonagunijima 2128 48.6±11.0 57.3±11.6 53.5±9.9 8.7 4.9 13.7 9.7
Minamitorishima 2096 35.7±13.0 35.5±14.7 37.7±14.0 −0.2 2.0 8.1 6.1
Rural
Ryori 1903 44.9±9.4 55.4±8.9 54.4±7.5 10.5 9.5 13.2 12.0
Sadoseki 2103 48.8±15.9 59.5±9.0 52.8±8.1 10.8 4.0 17.8 13.6
Yusuhara 2126 35.1±10.6 60.7±9.3 57.6±8.4 25.6 22.6 27.8 24.7
Suburbana
Tsukuba 445 51.8±18.0 63.2±9.2 60.6±10.2 11.4 8.8 18.0 15.8
Ijira 445 52.9±16.2 65.3±10.0 60.7±8.9 12.4 7.8 17.8 14.7
Banryu 445 53.5±12.9 66.7±11.1 61.0±8.9 13.2 7.4 16.1 12.0
aOnly afternoon data (12:00–16:00 JST) used at suburban sites.
Prather, 2006), and the variability is captured better. The per-formance is poorer at only a few locations, notably at Tappi where the site is less representative of the model grid box at T63 than at T21, and at Ogasawara, where overestimated
O3in continental air is compensated at T21 by too great a
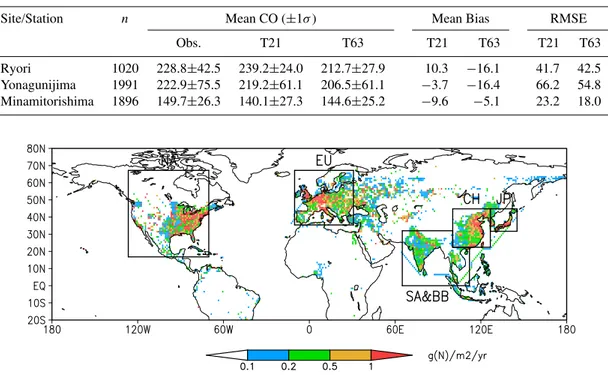
Table 3.Statistical Summary of Observed and Modeled Hourly Surface CO (in ppb) in February–April 2001.
Site/Station n Mean CO (±1σ) Mean Bias RMSE
Obs. T21 T63 T21 T63 T21 T63
Ryori 1020 228.8±42.5 239.2±24.0 212.7±27.9 10.3 −16.1 41.7 42.5
Yonagunijima 1991 222.9±75.5 219.2±61.1 206.5±61.1 −3.7 −16.4 66.2 54.8
Minamitorishima 1896 149.7±26.3 140.1±27.3 144.6±25.2 −9.6 −5.1 23.2 18.0
Fig. 5. Distribution of anthropogenic surface NOxemissions (g N m−2yr−1) used in this study (Olivier et al., 1996; Streets et al., 2003) showing the principal source regions considered here.
locations lie in different grid boxes at T63. The following sections of this study focus on model simulations at T63 res-olution only.
We conclude the model evaluation by examining the im-portance of the location of measurement sites. Two of the sites considered here, Oki and Happo, lie upwind of the major Japanese source regions, and may intercept out-flow from the Asian mainland before it arrives over Tokyo. Both sites are strongly influenced by pollution from China, and O3 from this source is transported efficiently in spring
(Berntsen et al., 1996; Wild and Akimoto, 2001). The sam-pling environment at these locations is very different, and O3is overestimated in the marine boundary layer sampled
at Oki but underestimated at the mountain site at Happo, see Table 2. However, the variations in O3 at these sites
and at Tsukuba are well matched (the correlation between O3 data at Oki and Tsukuba is r2=0.46 in observations
and 0.45 in the model; for Happo and Tsukuba,r2=0.53
and 0.52, respectively), demonstrating that background O3
makes a substantial contribution to the variation in O3over
Tokyo. The seasonal trend at Oki is also well matched, with an increase in monthly mean O3of 15.3 ppb between
February and April (14.6 ppb in model), but is overestimated at the higher elevation of Happo (14.3 ppb in observations, 22.3 ppb in model) and underestimated in the more polluted conditions at Tsukuba (25.4 ppb in observations, 15.4 ppb in model). During conditions of westerly flow there is a time
lag in major features in CO of about 12 h between Oki and Tsukuba, reflecting the timescales for transport of polluted continental air between the sites.
3 Source contributions over the Tokyo region
We evaluate the contribution of industrial and fossil fuel sources of O3 precursors to O3 over Japan from five
inde-pendent source regions: local emissions from Japan and Ko-rea (JP), regional emissions from China (CH) and southern Asia (SA), and remote emissions from the major source re-gions of Europe (EU) and North America (NA), see Fig. 5. In addition, biomass burning sources (BB) are considered for southern Asia where peak emissions occur in the February– April period examined here (Duncan et al., 2003; Streets et al., 2003). These originate from the same region as SA emissions, but the distribution of sources is different, as in-dustrial emissions dominate over India while biomass burn-ing sources are greatest over Thailand and Southeast Asia. Source contributions are evaluated by removing emissions of NOx, CO and VOC from each region in turn and comparing
30 40 50 60 70 80 90 100 110 120 -20
0 20 40 60 80 100
O3
Mixing ratio /ppb
Surface O3
Japanese sources All other sources
0 0.02 0.04 0.06 0.08 0.1
-20 0 20 40 60 80 100
30 40 50 60 70 80 90 100 110 120
Day of Year (JST) 0
5 10 15 20
O3
Contribution /ppb
Stratospheric O3
European O3
N. American O3
Chinese O3
0 0.2 0.4 0.6 0.8 1
Probability per ppb 0 5 10 15 20
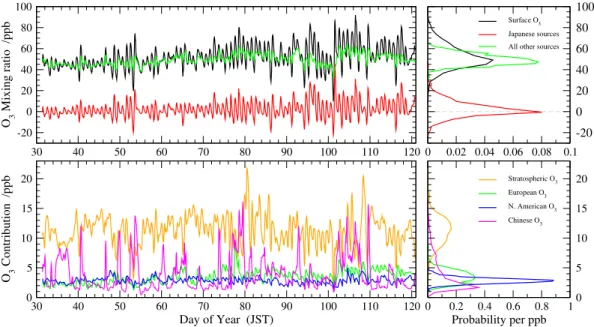
Fig. 6. Hourly mean surface O3 mixing ratios in Tokyo in February–April 2001 from the FRSGC/UCI CTM showing(a)total surface
O3 (black), O3from Japanese sources (red) and the difference between them (representing O3from all other sources; green), and(b)
contributions to O3from Chinese (magenta), European (green) and North American (blue) sources and from the stratosphere (orange).
Right-hand panels show the probability distribution over the three-month period.
30 40 50 60 70 80 90 100 110 120
0 100 200 300 400
CO Mixing ratio /ppb
Surface CO Japanese sources All other sources
0 0.01 0.02 0.03 0
100 200 300 400
30 40 50 60 70 80 90 100 110 120
Day of Year (JST) 0
20 40 60 80 100
CO Contribution /ppb
European CO N. American CO Chinese CO
0 0.1 0.2 0.3
Probability per ppb 0 20 40 60 80 100
Fig. 7. Hourly mean surface CO mixing ratios in Tokyo in February–April 2001 from the FRSGC/UCI CTM showing(a)total surface
CO (black), CO from Japanese sources (red) and background CO from other sources (green), and(b)contributions to CO from Chinese
(magenta), European (green), and North American (blue) sources. Right-hand panels show the probability distribution over the three-month period.
of source contributions, although non-linearities in O3
chem-istry prevent a full and accurate attribution of all sources us-ing this method (see, e.g., Wu et al., 2009). Stratosphere-troposphere exchange (STE) is also an important source of O3in the Northern Hemisphere in springtime, and O3from
this source is diagnosed by accounting for the chemical de-struction of O3 transported from the stratosphere following
the method of Roelofs and Lelieveld (1997).
0 10 20 30 40 50 60 70 80 90 100
CO from China /ppb
0 5 10 15
O3
from China /ppb
February March April
O3/CO=0.22
March
Feb
O3/CO=0.17
April: O3/CO=0.29
Slope=0.21 r2=0.82
Fig. 8. Relationship between Chinese contributions to surface O3 and CO over Tokyo revealing the increase in photochemical activity between February and April in 2001.
Figs. 6 and 7. These results are representative of a 180 km grid box covering a much wider region than the Tokyo metropolitan area, and while they do not capture the het-erogeneity of chemical environments close to such a major source region, or nighttime removal, the mean photochemi-cal environment is captured sufficiently well to reproduce the day-to-day variability in O3shown in Fig. 3. Ozone shows
an upward trend over the spring period as photochemistry becomes more active, while CO is at its annual maximum and shows no trend over the period; however these trends are masked by large variability from both local and regional sources. This variability is driven largely by local emissions; for O3it is dominated by the photochemical impacts of local
NO emissions over Japan, which lead to production during the daytime and destruction at night, while for CO it is driven by local meteorology and transport processes from sources over Japan. The contribution of Japanese sources to O3
creases from February to April as photochemical activity in-creases, and there is also an increase for CO, as weakening of the northwesterly winter monsoon flow allows increased influence from local sources. Chinese contributions to O3
and CO (averaging 4.0±2.8 and 23±13 ppb respectively)
are strongly episodic in nature, reflecting regional meteoro-logical patterns, and episodes occur about twice a week on average. The highest impacts reach 13–15 ppb for O3 and
60–80 ppb for CO, and CO from Chinese sources generally exceeds that from Japanese sources during these episodes. At other times the contribution of Chinese sources is smaller than that from more distant sources like Europe and North America. Chinese contributions to O3and CO are well
cor-related (r2=0.82), as shown in Fig. 8, highlighting the good
relationship between emissions of O3precursors and CO and
the relatively short timescales for transport to Japan. The correlation is much weaker for other source regions where
O3destruction and differing transport pathways mask the
re-lationship. The O3/CO ratio from Chinese sources increases
from 0.17 to 0.29 between February and April as photochem-ical activity increases, similar to that observed over the North Atlantic in outflow from North America (Parrish et al., 1993). European and North American contributions are less vari-able, reflecting the greater transport distances from the source regions. European O3 contributions average 3.5±
1.1 ppb and rise from 2.5 to 4.1 ppb between February and
April, but the contribution from North America is relatively constant at 2.8±0.5 ppb. Contributions of European and
North American sources to CO average 30 and 20 ppb re-spectively, and the variability is again less for North Ameri-can sources. The magnitude and trends of these O3and CO
contributions agree well with a previous study using different emission data (Wild et al., 2004) and North American CO is similar to but slightly larger than that reported by Liang et al. (2004) who found contributions of up to 15 ppb at Ryori, Yonagunijima and Minamitorishima in spring. The contribu-tion of industrial and biomass burning emissions from South and Southeast Asia is small at this latitude, averaging 0.5 and 0.3 ppb for O3, respectively, and about 4 ppb each for
CO. However, there is one episode bringing 15 ppb of CO from biomass burning sources on 1 February. In contrast to these surface sources, the contribution from stratospheric O3
is large, 11.2±2.5 ppb, and is highly variable from day to
day, exceeding 20 ppb on two occasions. The stratospheric contribution is larger in March than in April, indicating that the positive trend in surface O3seen over Japan in spring is
driven largely by photochemistry, as previous observational studies have suggested (Kajii et al., 1998; Pochanart et al., 1999).
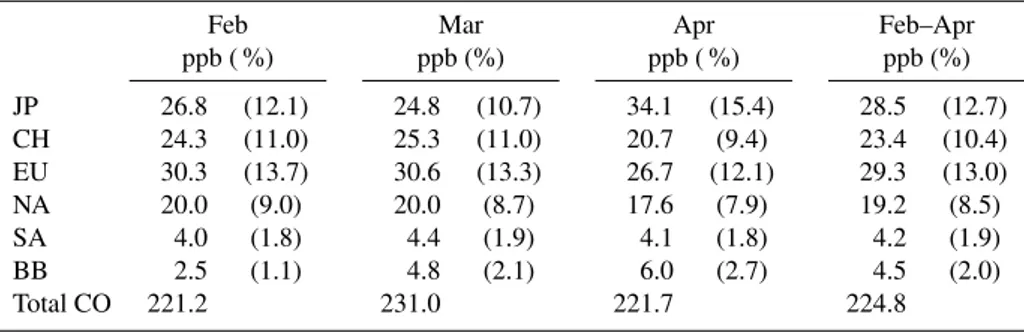
The monthly contributions of the selected source regions to CO and O3 over Tokyo in spring 2001 are summarized
in Tables 4 and 5. Local sources of CO and O3over Japan
play an increasingly important role during the spring, as pho-tochemistry picks up and long-range transport from distant source regions weakens. For O3we consider only the
after-noon hours (12:00–16:00 JST) when photochemistry is most active and the boundary layer is relatively deep to avoid the influence of nighttime removal. Local sources dominate, exceeding 20 % in April, but this is only marginally larger than the influence of the stratosphere (18 %) and the com-bined impacts of fossil fuel sources over China, Europe and North America (18 %). These contributions are similar to those derived for March to May for the whole of Japan by Nagashima et al. (2010), who found contributions from the stratosphere of 21 %, from Japanese sources 22 %, and from Chinese sources 12 %, slightly greater than found here. It is thus clear that long-range transport makes a large contribu-tion to daytime O3over Tokyo on a mean basis throughout
the spring.
Hourly source contributions are shown in Fig. 9 as a func-tion of the total surface O3at all times of day to demonstrate
0 20 40 60 80 100
Surface O3 in Tokyo /ppb
-20 -10 0 10 20 30 40 50
O3
Contribution /ppb
0 20 40 60 80 100
0 5 10 15 20 25
20 40 60 80 100
Surface O3 in Tokyo /ppb
20 40 60 80 1000
5 10 15 20 25
Japan China Europe Stratosphere
r2=0.83 r2=0.15 r2=0.35 r2=0.15
s=0.69 s=0.26 s=0.10 s=0.23
Fig. 9. Contributions of Japanese, Chinese and European industrial sources and transport from the stratosphere to hourly surface O3over
Tokyo as a function of total modelled surface O3. Graphs are labelled with the correlation coefficient (r) and slope (s).
Table 4.Source Contributions to Surface CO in Tokyo During Spring 2001.
Feb Mar Apr Feb–Apr
ppb ( %) ppb (%) ppb ( %) ppb (%)
JP 26.8 (12.1) 24.8 (10.7) 34.1 (15.4) 28.5 (12.7)
CH 24.3 (11.0) 25.3 (11.0) 20.7 (9.4) 23.4 (10.4)
EU 30.3 (13.7) 30.6 (13.3) 26.7 (12.1) 29.3 (13.0)
NA 20.0 (9.0) 20.0 (8.7) 17.6 (7.9) 19.2 (8.5)
SA 4.0 (1.8) 4.4 (1.9) 4.1 (1.8) 4.2 (1.9)
BB 2.5 (1.1) 4.8 (2.1) 6.0 (2.7) 4.5 (2.0)
Total CO 221.2 231.0 221.7 224.8
is a very high correlation between the Japanese contribution and total surface O3(r2=0.83) indicating that local sources
account for most of the variability in O3through their
con-trol over the diurnal cycle, and they also account for much of the day-to-day variability (r2=0.42) reflecting their control
over local photochemistry. Chinese sources show a weaker relationship (r2=0.15) but still contribute an average of
5.7 ppb during periods when O3 exceeds the Japanese 1-h
air quality standard of 60 ppb. European and North Ameri-can sources both show a weak correlation, and contribute an average of 4.5 ppb and 3.1 ppb to episodes with O3
exceed-ing 60 ppb, respectively. These contributions from distant sources are similar to those seen in the summertime bound-ary layer over the US (Fiore et al., 2002). The stratospheric contribution to surface O3lies tightly between 15 and 33 %
over the spring period, and although there is a notable de-cline when surface O3exceeds 50 ppb, the stratosphere still
contributes an average of 12.2 ppb during O3episodes, very
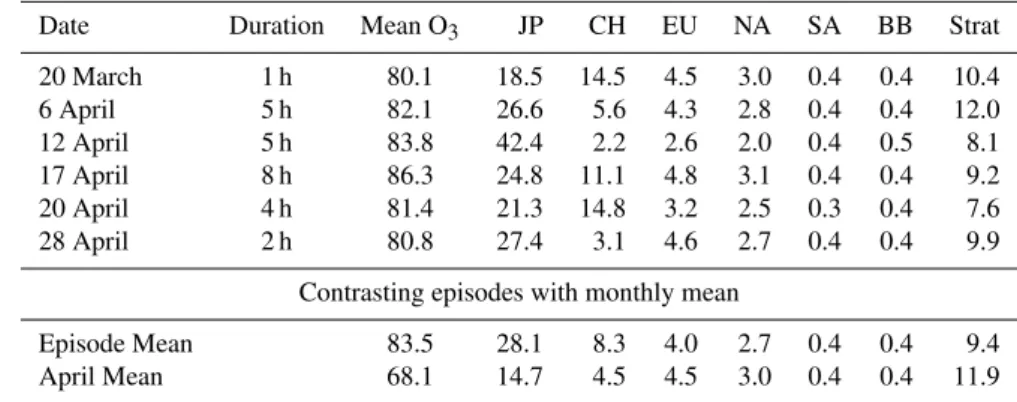
similar to the local Japanese contribution of 12.6 ppb. During the highest episodes O3 was observed to exceed
80 ppb at Tsukuba for a total of 48 h over the spring pe-riod, compared with 25 h in the model. The contribution of each source region during the modeled exceedance pe-riods is shown in Table 6. The six episodes shown differ substantially in nature. On 12 April (day 101), Japanese sources contributed more than 50 % of the O3peak, and
in-dustrial emissions from Chinese, European and North Amer-ican sources together accounted for less than 10 %.
How-ever, during the 20 March (day 79) and 20 April (day 109) episodes Japanese sources account for only about 25 % of the O3, and Chinese sources account for more than 18 %.
Euro-pean and North American contributions remain significant during these periods, accounting for almost 10 %. Regional trans-boundary transport contributed significantly to the ex-ceedance of air quality standards during these episodes. In contrast to 12 April, these two episodes were associated with large-scale anticyclonic influence over Northern Japan, and high O3was observed at Tappi and Happo at the same time
(see Fig. 4). The remaining three episodes lie between these extremes, with Japanese sources accounting for about one third of O3 and other industrial sources for 15–20 %. The
stratospheric source remains a consistent contributor during these episodes, accounting for 8–12 ppb (10–15 %). Com-paring contributions during episodes with mean afternoon contributions for April, it is clear that while local Japanese sources play a much bigger role than normal during episodes, contributions from distant sources are not greatly different during these periods, see Table 6. This suggests that trans-boundary and intercontinental transport contribute to O3
lev-els over Japan during conditions that favour O3build-up, and
Table 5.Source Contributions to Afternoon Surface O3in Tokyo During Spring 2001.
Feb Mar Apr Feb–Apr
ppb ( %) ppb (%) ppb ( %) ppb (%)
JP 5.6 (10.6) 8.2 (13.3) 14.7 (21.7) 9.4 (15.6)
CH 4.2 (8.0) 4.6 (7.4) 4.5 (6.6) 4.4 (7.3)
EU 2.9 (5.4) 4.2 (6.9) 4.5 (6.6) 3.9 (6.4)
NA 3.1 (5.9) 3.1 (5.1) 3.0 (4.4) 3.0 (5.0)
SA 0.6 (1.2) 0.6 (0.9) 0.4 (0.6) 0.5 (0.9)
BB 0.2 (0.3) 0.3 (0.5) 0.4 (0.6) 0.3 (0.5)
Strat 11.8 (22.4) 13.2 (21.5) 11.9 (17.5) 12.2 (20.2)
Total O3 52.6 61.2 68.1 60.5
Table 6.Source Contributions to Surface O3(ppb) in Tokyo During High O3Episodes (O3>80 ppb) in Spring 2001.
Date Duration Mean O3 JP CH EU NA SA BB Strat
20 March 1 h 80.1 18.5 14.5 4.5 3.0 0.4 0.4 10.4
6 April 5 h 82.1 26.6 5.6 4.3 2.8 0.4 0.4 12.0
12 April 5 h 83.8 42.4 2.2 2.6 2.0 0.4 0.5 8.1
17 April 8 h 86.3 24.8 11.1 4.8 3.1 0.4 0.4 9.2
20 April 4 h 81.4 21.3 14.8 3.2 2.5 0.3 0.4 7.6
28 April 2 h 80.8 27.4 3.1 4.6 2.7 0.4 0.4 9.9
Contrasting episodes with monthly mean
Episode Mean 83.5 28.1 8.3 4.0 2.7 0.4 0.4 9.4
April Mean 68.1 14.7 4.5 4.5 3.0 0.4 0.4 11.9
4 Transport pathways and meteorology
The large differences seen between high O3 episodes
sug-gest that the source contributions are very sensitive to me-teorological conditions. We therefore examine how regional meteorology controls the transport of oxidants from differ-ent source regions to characterize better the composition of regional “background” air on which Japanese sources build. Meteorological conditions over East Asia in springtime are characterized by a weakening of the Siberian High that drives the northwesterly East Asian winter monsoon flow. This cold, dry continental air from over Eurasia meets warmer, more humid air over the Western Pacific, and leads to fre-quent and active cyclogenesis over the region. The wave cy-clones that form travel northeastwards over Japan and typi-cally increase in strength over the early spring period con-sidered here. Continental pollutants may be rapidly swept out over the Western Pacific in the boundary layer following the associated cold fronts (e.g., Carmichael et al., 1998; Liu et al., 2003) or may be lifted into the free troposphere over the Western Pacific in the warm conveyor belt flow ahead of the front (e.g., Kaneyasu et al., 2000; Yienger et al., 2000; Miyazaki et al., 2003). Associated with these systems is a strong jet stream, and significant influx of stratospheric O3
may occur in dry air descending behind the cold front (e.g., Cooper et al., 2002). The passage of these systems leads to
frequent changes in air mass origin over much of the Western Pacific, and there is a gradual transition in this variability as the marine flow strengthens. The meteorology of the region in 2001 is reasonably typical, influenced by a weak La Ni˜na that decayed to neutral conditions in early spring (Fuelberg et al., 2003).
4.1 Meteorological controls on source region contributions
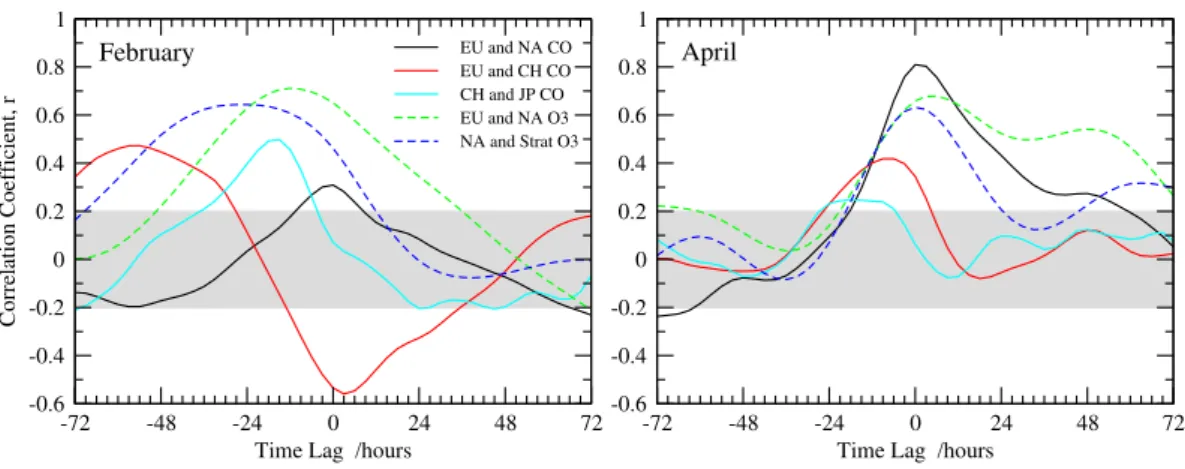
The juxtaposition or coalescence of air masses from differ-ent origins can be explored by examining the relationships between the contributions of different sources with time. Fig-ure 10 shows these relationships for CO and O3over Japan
in February and April 2001. European and North American contributions to CO are well correlated, indicating that they arrive together in relatively well-mixed air masses. This sig-nal is much stronger in March and April than in February, highlighting differences in synoptic conditions. The correla-tion for O3differs from that of CO, as O3has a shorter
life-time and surface contributions are therefore more strongly influenced by subsidence from the free troposphere than hor-izontal transport. North American O3 correlates relatively
well with stratospheric O3suggesting that they arrive by
-72 -48 -24 0 24 48 72 Time Lag /hours
-0.6 -0.4 -0.2 0 0.2 0.4 0.6 0.8 1
Correlation Coefficient, r
EU and NA CO EU and CH CO CH and JP CO EU and NA O3 NA and Strat O3
-72 -48 -24 0 24 48 72
Time Lag /hours -0.6
-0.4 -0.2 0 0.2 0.4 0.6 0.8 1
February April
Fig. 10.Correlation between the contributions of key source regions to O3and CO over Tokyo in February (left) and April (right).
Fig. 11.Correlation between mean sea-level pressure and the contributions of(a)Chinese O3,(b)European CO and(c)Japanese CO over Tokyo (marked with a circle) in spring 2001. Positive correlations are highlighted in red and negative correlations in blue. Lower panels show the correlation coefficient lagged by 24 h, and thus the relationship with mean sea-level pressure one day earlier.
stratospheric O3marginally less well, consistent with
trans-port at lower altitudes than North American air masses (Wild et al., 2004). Previous studies have suggested that European CO is mixed with CO from mainland Asian sources in post-frontal boundary layer outflow from China (Liu et al., 2003), but we find European and Chinese contributions are quite strongly anticorrelated in February, and only weakly corre-lated in April. This suggests that over Japan the timing of major episodes differs substantially; in February the relation-ship is strongest when European influence lags Chinese influ-ence by about 48–60 h, reflecting changes in air mass origin driven by changing synoptic systems, while in April the rela-tionship is strongest with a lag of about 6 h, likely reflecting Chinese influence in bands immediately behind frontal sys-tems giving way to European influence in the following cold continental outflow.
To determine the governing meteorological mechanisms and the dominant transport patterns that bring air from dif-ferent source regions to Japan in springtime we derive corre-lation maps of the hourly time series at Tokyo to mean sea-level pressure over the region and relate these to the prevail-ing meteorological conditions. Figure 11 shows this correla-tion map for the seasonal time series of Chinese, European and Japanese influences on Tokyo. We show examples for both O3 and CO; the correlation patterns for both species
are similar for Chinese sources, but the strong diurnal signal in O3from Japanese sources and the lower variability from
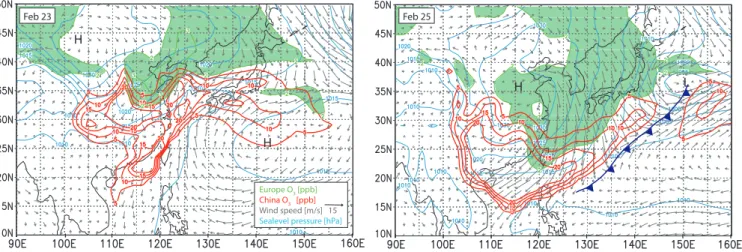
Europe O3 [ppb] China O3 [ppb] Wind speed [m/s] 15 Sealevel pressure [hPa]
H H
H L
Feb 23 Feb 25
Fig. 12.Chinese and European contributions to O3and CO over Japan at 00:00 UTC on 23 and 25 February 2001 showing the development and movement of air masses associated with a developing frontal system (approximate position on 25 February marked in blue).
which bring higher influence from the continent to Japan, and the classic cyclonic “comma” shape is clearly visible. Ap-plying a 24-h lag to the time series reveals the climatological position of the low pressure one day earlier, over Korea, and demonstrates that high levels of O3 from China are
associ-ated with the passage of low pressure systems as their atten-dant frontal systems advance towards Japan. These patterns highlight the start of the North Pacific storm track, and show that transport of Chinese pollutants to Japan is favoured by the movement of low pressure systems northeastwards from the East China Sea. The characteristic pattern produced by this analysis is similar to that shown by Liang et al. (2005).
The correlation map for European influence is notably dif-ferent and indicates that import of European air is favoured when there is higher sea-level pressure over the East China Sea along with low pressure systems northeast of Japan. This pattern is associated with northwesterly flow from Northern Eurasia to Japan, and follows on from northerly flow one day earlier. The climatological pattern represents cold outflow around the eastern side of the high pressure systems that fol-low the passage of wave cyclones. This is supported by an anticorrelation with humidity (r2=0.5, not shown) which
indicates that European influence is greatest in dry continen-tal air masses.
The correlation maps for Japanese influence are very dif-ferent, and the greatest impacts on CO and O3are associated
with a high pressure anomaly over the northern Pacific and a low over Eastern China. This pattern reflects anticyclonic conditions over Japan governed by slow marine southwest-erly flow, and these fair-weather conditions allow substantial build-up of local pollutants in the boundary layer. These con-ditions are relatively short-lived in spring and are typically swept away by the frontal systems associated with the next cyclone building over Eastern China.
4.2 Case study of inflow to Japan
While climatological patterns provide good evidence for the role of particular meteorological processes in governing transport on a seasonal basis, there is substantial variabil-ity between one synoptic system and the next. To demon-strate the key pathways for regional pollutant transport more clearly, we present a case study of the transport of continen-tal Asian pollutants to Japan during 23–26 February 2001. Of the transport episodes we have examined, this case is reason-ably typical of transport from China associated with frontal passage. Polluted air from China is transported eastwards over the Pacific, bringing high levels of O3(12–14 ppb) to
Japan, but is subsequently caught up in a region of cyclogen-esis over the East China Sea, see Fig. 12. The passage of this cyclone along the North Pacific storm track confines oxidants in the boundary layer to a thin band along the cold front, as observed in previous studies (Kaneyasu et al., 2000; Sawa et al., 2007), with a significant proportion caught up in the warm sector ahead of it (e.g., Cooper et al., 2002). Continen-tal boundary layer air with a greater abundance of European and North American oxidants is carried southeastwards in the cold outflow behind this front, but remains largely distinct from air of East Asian origin. The passage of this system over Japan is associated with a drop in midday temperature of 10◦C between 23 and 25 February and a pressure drop of 14 hPa followed by a rise of 30 hPa, see Fig. 13. The system first brings the footprint of Asian emissions to Tokyo in the warm sector, where Chinese CO reaches 80 ppb, and this is followed by 2–3 days of cold, dry continental outflow from higher latitudes with little influence from Chinese sources (Chinese CO below 10 ppb). European influence is higher in the post-frontal outflow, with European CO rising from 15 to 45 ppb over the period and a smaller rise for O3 of 2.2
ppbv
21 22 23 24 25 26 27 28
21 22 23 24 25 26 27 28
China CO
Europe CO
1000 1008 1016 1024 1032
Mean Sealevel
Pressure /hPa
Pressure
0 20 40 60 80
C
O
Mi
xing Ratio /ppb
China CO Europe CO
270 275 280 285
Surface Temperature /K
Temperature
21 22 23 24 25 26 27 28 0
4 8 12 16
O3
Mixin
g
Rat
io
/ppb
China O3 Europe O3 Stratospheric O3
Day of February
P
res
sur
e
/hP
a
P
res
sur
e
/hP
a
Fig. 13. Variations in surface pressure and temperature over Tokyo during the week of 21–28 February 2001, showing the passage of the
frontal system shown in Fig. 12 (highlighted in grey) and the associated changes in the contribution of distant sources to O3and CO (left
panels). Vertical profiles of the contributions of China and Europe to CO over Tokyo between the surface and 500 hPa (about 5 km) are shown in the righthand panels, highlighting the passage of the cold front on 24 February and elevated levels of CO from China aloft.
European and East Asian sources in the post-frontal bound-ary layer outflow, as suggested by Liu et al. (2003), this episode demonstrates that the regional footprints can remain distinct within the timescales for transport from the continent to Japan.
The lifting of pollutants in the warm conveyor belt ahead of the cold front is clearly visible in the right panel of Fig. 13, where it brings Chinese contributions of more than 18 ppb of O3and 100 ppb of CO at 2–3 km altitude as it crosses Japan.
At higher altitudes in the warm sector above 4 km the south-westerly flow brings air from southern and southeastern Asia, with O3reaching 12 ppb and CO reaching 180 ppb, and over
Japan such high contributions from south Asian industrial and biomass burning sources are only seen under these con-ditions. The dry intrusion behind the cold front pushes this away and brings streamers of air down from the upper tropo-sphere with 50–60 ppb of stratospheric O3which persist for
about a day. At the surface, stratospheric contributions aver-age 12 ppb in the air behind the front compared with about 6 ppb ahead of it on 23–24 February. The lowest levels of surface O3and CO over the week occur in the 24 h following
passage of the cold front, when transport and photochem-istry from local sources over Japan is suppressed and the
contribution of continental sources remains low. The high-est levels occur on 23 February in the 24 h before the system arrives, when surface O3 exceeds 60 ppb for an 8-h period
(for 5 h in the observations) and peaks at more than 70 ppb. Although early in the year, the fair-weather anticyclonic con-ditions contribute to substantial local O3production (20 ppb
from Japanese sources) and the southwesterly flow brings as much as 14 ppb O3 from Chinese sources. While this
5 Conclusions
We have shown how local, regional and distant sources con-tribute to surface O3and CO over Japan in springtime and
ex-plored the transport pathways that lead to this influence. On a seasonal basis the largest contribution to daytime surface O3
is from the stratosphere (20 %), at a regional scale exceeding Japanese precursor sources (16 %) which make a relatively small contribution in February but increase rapidly through the spring as photochemistry picks up. Local sources make relatively little net contribution to day-mean O3in this season
due to strong O3 removal at nighttime over polluted
emis-sion regions. Distant anthropogenic precursor emisemis-sions over China, Europe and North America make small but significant contributions to surface O3(7 %, 6 %, and 5 % respectively),
but together these sources make up 19 % of O3 over Japan,
exceeding the local contribution and almost matching that from the stratosphere. The pattern for surface CO is simi-lar, although Japanese sources make a smaller contribution (13 %) and distant anthropogenic sources make a larger one (32 %), with the largest effects from Europe (13 %) during the spring season.
We have shown that these source contributions are highly variable during springtime and that clear meteorological sig-natures can be seen in both observed and modeled O3 and
CO at locations over the Western Pacific such as Minamitor-ishima. Spatial correlations with mean sea-level pressure and humidity indicate that on a climatological basis transport of pollutants from China to Japan occurs at low altitudes follow-ing the Pacific storm track, and is associated with the passage of cold fronts. Ozone contributions from Chinese sources typically reach 10–15 ppb during these episodes, which oc-cur on average once or twice per week. In contrast, European influence is greatest in northwesterly flow representing conti-nental boundary layer air caught up in the cold outflow some distance behind cold fronts. While O3and CO from Chinese
and European sources are both transported to Japan at low levels behind these frontal systems, the influence from China is typically strongest in a band lying along the front, while that from Europe occurs later as cold continental air is en-trained into the post-frontal outflow. Stratospheric contribu-tions are largest above the capping inversions of anticyclones preceding (and following) these systems, but may reach as much as 20 ppb at the surface on occasions. However, ex-amination of a number of case studies indicates that there is considerable variation in transport pathways between one synoptic meteorological system and the next that is partly driven by the timing and location of cyclogenesis and partly by the location of the Pacific High. We recommend that fur-ther studies focus on a more detailed meteorological classifi-cation of these systems so that long-range impacts on atmo-spheric composition can be characterized more clearly.
While meteorological boundaries such as fronts provide a clear separation of air from different nearby sources, the ef-fects of more distant sources are more uniformly distributed,
and their contributions remain significant during episodes of high O3over Tokyo in springtime. While the contribution
from European and North American sources are typically close to their seasonal average during these episodes, con-tributions from China may often be substantially larger, al-though this is not always the case, depending on meteorolog-ical conditions. This study has focused on 2001, but we note that emissions of ozone precursors from Northern China are increasing due to rapid industrialization and increased vehi-cle ownership, and may already have increased by a factor of two since 2001 (e.g., Irie et al., 2005; Ohara et al., 2007). Our results suggest that this would account for an additional 2–4 ppb of daytime O3over Tokyo in spring, contributing to
the observed trend. The magnitude of this O3 contribution
suggests that agencies regulating air quality in Japan should take account of long-range transport from the Asian main-land when examining exceedance of air quality standards in future.
Acknowledgements. This work has been partially supported by the Global Environmental Research Fund (B051 and S-7) of the Ministry of the Environment of Japan.
Edited by: T. Butler
References
Akimoto, H.: Global air quality and pollution, Science, 302, 1716– 1719, 2003.
Akimoto, H., Mukai, H., Nishikawa, M., Murano, K., Hatakeyama, S., Liu, C.-M., Buhr, M., Hsu, K. J., Jaffe, D. A., Zhang, L., Hon-rath, R., Merrill, J. T., and Newell, R. E.: Long-range transport of ozone in the East Asian Pacific rim region, J. Geophys. Res., 101, 1999–2010, 1996.
Berntsen, T. K., Isaksen, I. S. A., Wang, W.-C., and Liang, X. Z.: Impacts of increased anthropogenic emissions in Asia on tropo-spheric ozone and climate – a global 3-D model study, Tellus, 48, 13–32, 1996.
Berntsen, T. K., Karlsdottir, S., and Jaffe, D. A.: Influence of Asian emissions on the composition of air reaching the Northwestern United States, Geophys. Res. Lett., 26, 2171–2174, 1999. Bey, I., Jacob, D. J., Logan, J. A., and Yantosca, R. M.: Asian
chemical outflow to the Pacific: origins, pathways and budgets, J. Geophys. Res., 106, 23097–23114, 2001.
Carmichael, G. R., Uno, I., Phadnes, M., Zhang, Y., and Sunwoo, Y.: Tropospheric ozone production and transport in the spring-time in east Asia, J. Geophys. Res., 103, 10649–10671, 1998. Carmichael, G. R., Tang, Y., Kurata, G., Uno, I., Streets, D. G.,
Thongboonchoo, N., Woo, J.-H., Guttikunda, S., White, A., Wang, T., Blake, D. R., Atlas, E., Fried, A., Potter, B., Avery, M. A., Sachse, G. W., Sandholm, S. T., Kondo, Y., Talbot, R. W., Bandy, A., Thorton, D., and Clarke, A. D.: Evaluating regional emission estimates using the TRACE-P observations, J. Geo-phys. Res., 108(D21), 8810, doi:10.1029/2002JD003116, 2003. Cooper, O. R., Moody, J. L., Parrish, D. D., Trainer, M., Ryerson,
western North Atlantic Ocean: A conceptual model, J. Geophys. Res., 107(D7), 4056, doi:10.1029/2001JD000901, 2002. Dentener, F., Stevenson, D., Ellingsen, K., van Noije, T., Schultz,
M., Amann, M., Atherton, C., Bell, N., Bergmann, D., Bey, I., Bouwman, L., Butler, T., Cofala, J., Collins, B., Drevet, J., Do-herty, R., Eickhout, B., Eskes, H., Fiore, A., Gauss, M., Hauglus-taine, D., Horowitz, L., Isaksen, I. S. A., Josse, B., Lawrence, M., Krol, M., Lamarque, J. F., Montanaro, V., M¨uller, J. F., Pauch, V. H., Pitari, G., Pyle, J., Rast, S., Rodriguez, J., Sanderson, M., Savage, N. H., Shindell, D., Strahan, S., Szopa, S., Sudo, K., Van Dingenen, R., Wild, O., and Zeng, G.: The global atmospheric environment for the next generation, Environ. Sci. Technol., 40, 3586–3594, 2006.
Duncan, B. N., Martin, R. V., Staudt, A. C., Yevich, R., and Logan, J. A.: Interannual and seasonal variability of biomass burning emissions constrained by satellite observations, J. Geophys. Res., 108(D9), 4040, doi:10.1029/2002JD002378, 2003.
Fiore, A. M., Jacob, D. J., Bey, I., Yantosca, R. M., Field, B. D., Fusco, A. C., and Wilkinson, J. G.: Background ozone over
the United States in summer: Origin, trend, and
contribu-tion to pollucontribu-tion episodes, J. Geophys. Res., 107(D15), 4275, doi:10.1029/2001JD000982, 2002.
Fiore, A. M., Jacob, D. J., Liu, H., Yantosca, R. M., Fairlie, T. D., and Li, Q. B.: Variability in surface ozone background over the United States: Implications for air quality policy, J. Geophys. Res., 108, 4787, doi:10.1029/2003JD003855, 2003.
Fiore, A. M., Dentener, F. J., Wild, O., Cuvelier, C., Schultz, M. G., Hess, P., Textor, C., Schulz, M., Doherty, R. M., Horowitz, L. W., MacKenzie, I. A., Sanderson, M. G., Shindell, D. T., Steven-son, D. S., Szopa, S., Van Dingenen, R., Zeng, G., Atherton, C., Bergmann, D., Bey, I., Carmichael, G., Collins, W. J., Duncan, B. N., Faluvegi, G., Folberth, G., Gauss, M., Gong, S., Hauglus-taine, D., Holloway, T., Isaksen, I. S. A., Jacob, D. J., Jonson, J. E., Kaminski, J. W., Keating, T. J., Lupu, A., Marmer, E., Montanaro, V., Park, R. J., Pitari, G., Pringle, K. J., Pyle, J. A., Schroeder, S., Vivanco, M. G., Wind, P., Wojcik, G., Wu, S., and Zuber, A.: Multi-model estimates of intercontinental source-receptor relationships for ozone pollution, J. Geophys. Res., 114, D04301, doi:10.1029/2008JD010816, 2009.
Fuelberg, H. E., Kiley, C. M., Hannan, J. R., Westberg, D. J., Avery, M. A., and Newell, R. E.: Meteorological conditions and trans-port pathways during the Transtrans-port and Chemical Evolution over the Pacific (TRACE-P) experiment, J. Geophys. Res., 108(D20), 8782, doi:10.1029/2002JD003092, 2003.
Heald, C. L., Jacob, D. J., Fiore, A. M., Emmons, L. K., Gille, J. C., Deeter, M. N., Warner, J., Edwards, D. P., Crawford, J. H., Hamlin, A. J., Sachse, G. W., Browell, E. V., Avery, M. A., Vay, S. A., Westberg, D. J., Blake, D. R., Singh, H. B., Sandholm, S. T., Talbot, R. W., and Fuelberg, H. E.: Asian outflow and transpacific transport of carbon monoxide and ozone pollution: An integrated satellite, aircraft and model perspective, J. Geo-phys. Res., 108(D24), 4804, doi:10.1029/2003JD003507, 2003. Holloway, T., Fiore, A., and Galanter Hastings, M.:
Intercontinen-tal Transport of Air Pollution: Will emerging science lead to a new hemispheric treaty?, Environ. Sci. Technol., 37, 4535–4542, 2003.
Holloway, T., Sakurai, T., Han, Z., Ehlers, S., Spak, S. N., Horowitz, L. W., Carmichael, G. R., Streets, D. G., Hozumi, Y., Ueda, H., Park, S. U., Fung, C., Kajino, M., Thongboonchoo, N., Engardt,
M., Bennet, C., Hayami, H., Sartelet, K., Wang, Z., Matsuda, K., and Amann, M.: MICS-Asia II: Impact of global emissions on regional air quality in Asia, Atmos. Environ., 42, 3543–3561, 2008.
Irie, H., Sudo, K., Akimoto, H., Richter, A., Burrows, J. P., Wagner, T., Wenig, M., Beirle, S., Kondo, Y., Sinyakov, V. P., and Goutail,
F.: Evaluation of long-term tropospheric NO2data obtained by
GOME over East Asia in 1996–2002, Geophys. Res. Lett., 32, L11810, doi:10.1029/2005GL022770, 2005.
Jacob, D. J., Logan, J. A., and Murti, P. P.: Effect of rising Asian emissions on surface ozone in the United States, Geophys. Res. Lett., 26, 2175–2178, 1999.
Jacob, D. J., Crawford, J. H., Kleb, M. M., Connors, V. S., Bendura, R. J., Raper, J. L., Sachse, G. W., Gille, J. C., Emmons, L., and Heald, C. L.: Transport and Chemical Evolution over the Pacific (TRACE-P) aircraft mission: Design, execution and first results, J. Geophys. Res., 108(D20), 9000, doi:10.1029/2002JD003276, 2003.
Jaegl´e, L., Jaffe, D. A., Price, H. U., Weiss-Penzias, P., Palmer, P. I., Evans, M. J., Jacob, D. J., and Bey, I.: Sources and budgets
for CO and O3in the northeastern Pacific during the spring of
2001: Results from the PHOBEA-II Experiment, J. Geophys. Res., 108(D20), 8802, doi:10.1029/2002JD003121, 2003. Jaffe, D. A., McKendry, I., Anderson, T., and Price, H.: Six “new”
episodes of trans-Pacific transport of air pollutants, Atmos. Env-iron., 37(3), 391–404, 2003.
Kajii, Y., Someno, K., Tanimoto, H., Hirokawa, J., Akimoto, H., Katsuno, T., and Kawara, J.: Evidence for the seasonal variation of photochemical activity of tropospheric ozone: Continuous ob-servation of ozone and CO at Happo, Japan, Geophys. Res. Lett., 25, 3505–3508, 1998.
Kaneyasu, N., Takeuchi, K., Fujita, S., Uno, I., and Sasaki, H.: Out-flow patterns of pollutants from east Asia to the North Pacific in the winter monsoon, J. Geophys. Res., 105, 17361–17377, 2000. Lee, S.-H., Akimoto, H., Nakane, H., Kurnosenko, S., and Kinjo, Y.: Lower tropospheric ozone trend observed in 1989–1997 at Okinawa, Japan, Geophys. Res. Lett., 25(10), 1637–1640, 1998. Liang, Q., Jaegle, L., Jaffe, D. A., Weiss-Penzias, P.,
Heck-man, A., and Snow, J. A.: Long-range Transport to the
Northeast Pacific: Seasonal variations and transport pathways of carbon monoxide, J. Geophys. Res., 109(D23), D23S07, doi:10.1029/2003JD004402, 2004.
Liang, Q., Jaegle, L., and Wallace, J. M.: Meteorological in-dices for Asian outflow and transpacific transport on daily to interannual timescales, J. Geophys. Res., 110, D18308, doi:10.1029/2005JD005788, 2005.
Lin, C.-Y. C., Jacob, D. J., and Fiore, A. M.: Trends in exceedances of the ozone air quality standard in the continental United States, 1980–1998, Atmos. Environ., 35, 3217–3228, 2001.
Lin, M., Holloway, T., Carmichael, G. R., and Fiore, A. M.: Quan-tifying pollution inflow and outflow over East Asia in spring with regional and global models, Atmos. Chem. Phys., 10, 4221– 4239, doi:10.5194/acp-10-4221-2010, 2010.
Lippmann, M.: Health effects of tropospheric ozone, Environ. Sci. Technol., 25, 1954–1962, 1991.
Mauzerall, D. L. and Wang, X.: Protecting Agricultural Crops from the Effects of Tropospheric Ozone Exposure: Reconciling Sci-ence and Standard Setting in the United States, Europe and Asia, Ann. Rev. Energ. Environ., 26, 237–268, 2001.
Mauzerall, D. L., Narita, D., Akimoto, H., Horowitz, L., Walters, S., Hauglustaine, D. A., and Brasseur, G.: Seasonal Characteristics of Tropospheric Ozone Production and Mixing Ratios Over East Asia: A Global Three-dimensional Chemical Transport Model Analysis, J. Geophys. Res., 105, 17895–17910, 2000.
Mickley, L. J., Murti, P. P., Jacob, D. J., Logan, J. A., Rind, D., and Koch, D.: Radiative forcing from tropospheric ozone calculated with a unified chemistry-climate model, J. Geophys. Res., 104, 30153–30172, 1999.
Miyazaki, Y., Kondo, Y., Koike, M., Fuelberg, H. E., Kiley, C. M., Kita, K., Takegawa, N., Sachse, G. W., Flocke, F., Weinheimer, A. J., Singh, H. B., Eisele, F. L., Zondlo, M., Talbot, R. W., Sandholme, S. T., Avery, M. A., and Blake, D. R.: Synoptic-scale transport of reactive nitrogen over the western Pacific in spring, J. Geophys. Res., 108(D20), 8788, doi:10.1029/2002JD003248, 2003.
Nagashima, T., Ohara, T., Sudo, K., and Akimoto, H.: The rela-tive importance of various source regions on East Asian surface ozone, Atmos. Chem. Phys., 10, 11305–11322, doi:10.5194/acp-10-11305-2010, 2010.
Naja, M. and Akimoto, H.: Contribution of regional and long-range transport to the Asia-Pacific region: Analysis of long-term ozonesonde data over Japan, J. Geophys. Res., 109, D21306, doi:10.1029/2004JD004687, 2004.
Network Center for EANET: EANET Data on Acid Deposition in the East Asia Region, Acid Deposition and Oxidant Re-search Center (ADORC), Niigata, Japan, available online at: http://www.eanet.cc/, 2005.
Ohara, T. and Sakata, T.: Long-term variation of photochemical oxidants over Japan, (in Japanese), J. Jpn. Soc. Atmos. Environ., 38, 47–54, 2003.
Ohara, T., Akimoto, H., Kurokawa, J., Horii, N., Yamaji, K., Yan, X., and Hayasaka, T.: An Asian emission inventory of anthropogenic emission sources for the period 1980–2020, At-mos. Chem. Phys., 7, 4419–4444, doi:10.5194/acp-7-4419-2007, 2007.
Olivier, J. G. J., Bouwman, A. F., van der Maas, C. W. M., Berdowski, J. J. M., Veldt, C., Bloos, J. P. J., Visschedijk, A. J. H., Zandveld, P. Y. J., and Haverlag, J. L.: Description of EDGAR Version 2.0, RIVM/TNO report 771060 002, RIVM, Bilthoven, The Netherlands, 1996.
Parrish, D. D., Holloway, J. S., Trainer, M., Murphy, P. C., Fehsen-feld, F. C., and Forbes, G. L.: Export of North American ozone pollution to the North Atlantic Ocean, Science, 259, 1436–1439, 1993.
Pochanart, P., Hirokawa, J., Kajii, Y., Akimoto, H., and Nakao, M.: Influence of regional-scale anthropogenic activity in northeast Asia on seasonal variations of surface ozone and carbon monox-ide observed at Oki, Japan, J. Geophys. Res., 104(D20), 3621– 3361, 1999.
Pochanart, P., Akimoto, H., Maksyutov, S., and Staehelin, J.: Sur-face ozone at the Swiss Alpine site Arosa: the hemispheric back-ground and the influence of large-scale anthropogenic emissions, Atmos. Environ. 35, 5553–5566, 2001.
Pochanart, P., Akimoto, H., Kinjo, Y., and Tanimoto, H.: Surface
ozone at four remote island sites and the preliminary assessment of exceedances of its critical level in Japan, Atmos. Environ., 36, 4235–4250, 2002.
Prather, M. and Ehhalt, D.: Atmospheric Chemistry and Green-house Gases, in Climate Change 2001: The Scientific Basis, edited by: Houghton, J. T., Ding, Y., and Griggs, D. J., 239–287, Cambridge Univ. Press, Cambridge, 2001.
Prather, M., Gauss, M., Berntsen, T., Isaksen, I., Sundet, J., Bey, I., Brasseur, G., Dentener, F., Derwent, R., Stevenson, D., Gren-fell, L., Hauglustaine, D., Horowitz, L., Jacob, D., Mickley, L., Lawrence, M., von Kuhlmann, R., Muller, J.-F., Pitari, G., Rogers, H., Johnson, M., Pyle, J., Law, K., van Weele, M., and Wild, O.: Fresh air in the 21st century?, Geophys. Res. Lett., 30(2), 1100, doi:10.1029/2002GL016285, 2003.
Roelofs, G. J. and Lelieveld, J.: Model study of the influence of cross-tropopause ozone transports on tropospheric ozone levels, Tellus, Ser. B, 49, 38–55, 1997.
Sawa, Y., Tanimoto, H., Yonemura, S., Matsueda, H., Wada, A., Taguchi, S., Hayasaka, T., Tsuruta, H., Tohjima, Y., Mukai, H., Kikuchi, N., Katagiri, S., and Tsuboi, K.: Widespread pollution events of carbon monoxide observed over the west-ern North Pacific during the East Asian Regional Experiment (EAREX) 2005 campaign, J. Geophys. Res., 112, D22S26, doi:10.1029/2006JD008055, 2007.
Stohl, A.: A 1-year Lagrangian “climatology” of airstreams in the Northern Hemisphere troposphere and lowermost stratosphere, J. Geophys. Res., 106, 7263–7279, 2001.
Streets, D. G., Yarber, K. F., Woo, J.-H., and Carmichael, G. R.: Biomass Burning in Asia: Annual and seasonal estimates and at-mospheric emissions, Global Biogeochem. Cycles, 17(4), 1099, doi:10.1029/2003GB002040, 2003.
Tanimoto, H., Sawa, Y., Matsueda, H., Uno, I., Ohara, T., Yamaji, K., Kurokawa, J., and Yonemura, S.: Significant latitudinal gra-dient in the surface ozone spring maximum over East Asia, Geo-phys. Res. Lett., 32, L21805, doi:10.1029/2005GL023514, 2005.
Tanimoto, H., Ohara, T., and Uno, I.: Asian
anthro-pogenic emissions and decadal trends in springtime ozone
over Japan: 1998–2007, Geophys. Res. Lett., 36, L23802
doi:10.1029/2009GL041382, 2009.
Task Force on Hemispheric Transport of Air Pollutants (TF-HTAP): Hemispheric Transport of Air Pollution 2007, Air Pollut. Stud. 16, edited by: Keating, T. J. and Zuber, A., UNECE, Geneva, Switzerland, available at: http://www.htap.org/, 2007.
Thompson, A. M.: The oxidising capacity of the earth’s atmo-sphere: Probable past and future changes, Science, 256, 1157– 1165, 1992.
Tokyo Metropolitan Government: Report of the Committee for Pho-tochemical Oxidant and its Control, Tokyo Metropolitan Govern-ment, Tokyo, Japan, 2005.
Tsutsumi, Y., Mori, K., Ikegami, M., Tashiro, T., and Tsuboi, K.: Long-term trends of greenhouse gases in regional and back-ground events observed during 1998–2004 at Yonagunijima lo-cated to the east of the Asian continent, Atmos. Environ., 40, 5868–5879, 2006.
Wang, X. and Mauzerall, D. L.: Characterizing Distributions of Sur-face Ozone and its Impact on Grain Production in China, Japan and South Korea: 1990 and 2020, Atmos. Environ., 38, 4383– 4402, 2004.
Wild, O. and Akimoto, H.: Intercontinental transport of ozone and its precursors in a 3-D global model, J. Geophys. Res., 106, 27729–27744, 2001.
Wild, O. and Prather, M. J.: Excitation of the primary tropospheric chemical mode in a global 3-D model, J. Geophys. Res., 105, 24647–24660, 2000.
Wild, O. and Prather, M. J.: Global tropospheric ozone modeling: Quantifying errors due to grid resolution, J. Geophys. Res., 111, D11305, doi:10.1029/2005JD006605, 2006.
Wild, O., Sundet, J. K., Prather, M. J., Isaksen, I. S. A., Akimoto, H., Browell, E. V., and Oltmans, S. J.: CTM Ozone Simulations for Spring 2001 over the Western Pacific: Comparisons with TRACE-P lidar, ozonesondes and TOMS columns, J. Geophys. Res., 108, 8826, doi:10.1029/2002JD003283, 2003.
Wild, O., Pochanart, P., and Akimoto, H.: Trans-Eurasian trans-port of ozone and its precursors, J. Geophys. Res., 109, D11302, doi:10.1029/2003JD004501, 2004.
Wilkening, K. E., Barrie, L., and Engle, M.: Trans-Pacific air pol-lution, Science, 290, 65–67, 2000.
Wilkening, K. E.: Trans-Pacific air pollution: scientific evidence and political implication, Water Air Soil Pollut., 130(1–4), 1825– 1830, 2001.
Wu, S., Duncan, B. N., Jacob, D. J., Fiore, A. M., and Wild, O.: Chemical nonlinearities in relating intercontinental ozone pollution to anthropogenic emissions, Geophys. Res. Lett., 36, L05806, doi:10.1029/2008GL036607, 2009.
Yamaji, K., Ohara, T., Uno, I., Tanimoto, H., Kurokawa, J.,
and Akimoto, H.: Analysis of the seasonal variation of
ozone in the boundary layer in east Asia using the
Commu-nity Multi-scale Air Quality model: What controls surface
ozone levels over Japan?, Atmos. Environ., 40(10), 1856–1868, doi:10.1016/j.atmosenv.2005.10.067, 2006.
Yienger, J. J., Klonecki, A. A., Levy II, H., Moxim, W. J., and Carmichael, G. R.: An evaluation of chemistry’s role in the winter-spring ozone maximum found in the northern midlatitude free troposphere, J. Geophys. Res., 104, 3655–3667, 1999. Yienger, J. J., Galanter, M., Holloway, T. A., Phadnis, M. J.,