ACPD
12, 13363–13403, 2012Fine and coarse particle profiling
A. Ansmann et al.
Title Page
Abstract Introduction
Conclusions References
Tables Figures
◭ ◮
◭ ◮
Back Close
Full Screen / Esc
Printer-friendly Version
Interactive Discussion
Discussion
P
a
per
|
Dis
cussion
P
a
per
|
Discussion
P
a
per
|
Discussio
n
P
a
per
|
Atmos. Chem. Phys. Discuss., 12, 13363–13403, 2012 www.atmos-chem-phys-discuss.net/12/13363/2012/ doi:10.5194/acpd-12-13363-2012
© Author(s) 2012. CC Attribution 3.0 License.
Atmospheric Chemistry and Physics Discussions
This discussion paper is/has been under review for the journal Atmospheric Chemistry and Physics (ACP). Please refer to the corresponding final paper in ACP if available.
Profiling of fine and coarse particle mass:
case studies of Saharan dust and
Eyjafjallaj ¨okull/Grimsv ¨otn volcanic
plumes
A. Ansmann1, P. Seifert1, M. Tesche2, and U. Wandinger1
1
Leibniz Institute for Tropospheric Research, Leipzig, Germany
2
Department of Applied Environmental Science, Stockholm University, Stockholm, Sweden
Received: 7 May 2012 – Accepted: 16 May 2012 – Published: 30 May 2012
Correspondence to: A. Ansmann (albert@tropos.de)
ACPD
12, 13363–13403, 2012Fine and coarse particle profiling
A. Ansmann et al.
Title Page
Abstract Introduction
Conclusions References
Tables Figures
◭ ◮
◭ ◮
Back Close
Full Screen / Esc
Printer-friendly Version
Interactive Discussion
Discussion
P
a
per
|
Dis
cussion
P
a
per
|
Discussion
P
a
per
|
Discussio
n
P
a
per
Abstract
The lidar-photometer method introduced to separate volcanic coarse-mode and fine-mode particle properties is extended to cover Saharan dust events as well. A review of recently published mass-specific extinction coefficients for Saharan dust and vol-canic dust is presented. These mass-specific extinction coefficients are required in the 5
retrieval of particle mass concentration profiles. Case studies of four different scenar-ios corroborate the applicability of the profiling technique: (a) Saharan dust outbreak to Central Europe, (b) Saharan dust plume mixed with biomass-burning smoke over Cape Verde, and volcanic aerosol layers originating from (c) the Eyjafjallaj ¨okull eruptions in 2010 and (d) the Grimsv ¨otn eruptions in 2011. Strong differences in the vertical aerosol 10
layering, aerosol mixing, and optical properties are observed for the different volcanic events.
1 Introduction
The eruptions of the Eyjafjallaj ¨okull volcano in April–May 2010 triggered the develop-ment of a variety of new lidar-based methods to identify ash and dust particles1 in 15
volcanic aerosol plumes containing fine and coarse particles. These new lidar profil-ing techniques further allow us to quantify the optical properties of the volcanic ash and dust particles (coarse-mode) and to estimate their mass concentration (Ansmann et al., 2011a; Gasteiger et al., 2011; Marenco and Hogan, 2011; Miffre et al., 2011; Chaikovsky et al., 2012; Wagner et al., 2012).
20
Two lidar methods are of fundamental importance in this context. The polariza-tion lidar technique permits the discriminapolariza-tion of non-spherical, light-depolarizing, coarse-mode particles such as volcanic dust and desert dust and spherical,
1
ACPD
12, 13363–13403, 2012Fine and coarse particle profiling
A. Ansmann et al.
Title Page
Abstract Introduction
Conclusions References
Tables Figures
◭ ◮
◭ ◮
Back Close
Full Screen / Esc
Printer-friendly Version
Interactive Discussion
Discussion
P
a
per
|
Dis
cussion
P
a
per
|
Discussion
P
a
per
|
Discussio
n
P
a
per
|
non-light-depolarizing fine-mode particles such as anthropogenic haze and sulfate par-ticles originating from the volcanic SO2 emissions (Murayama et al., 1999; Sugimoto et al., 2003; Shimizu et al., 2004; Sugimoto and Lee, 2006; Sassen, 2005; Sassen et al., 2007; Nishizawa et al., 2007; Liu et al., 2008; Freudenthaler et al., 2009; Groß et al., 2011a, 2012; Miffre et al., 2012). Furthermore, the profiles of the backscatter 5
coefficient of coarse-mode and fine-mode particles can be separated (Tesche et al., 2009b, 2011b).
The second important lidar method is the aerosol Raman lidar technique (Ansmann and M ¨uller, 2005) which allows us to independently measure particle backscatter and extinction coefficients and thus provides important (benchmark-like) data on the re-10
lationship between the backscatter and the extinction coefficient of pure desert dust, pure volcanic dust, and mixtures of coarse-mode and fine-mode particles (Mattis et al., 2002, 2010; Pappalardo et al., 2004; M ¨uller et al., 2007; Wang et al., 2008; Tesche et al., 2009a, 2011a; Wiegner et al., 2011a,b; Groß et al., 2011b, 2012; Mona et al., 2012; Papayannis et al., 2012; Sicard et al., 2012). The importance of Raman lidar 15
observations arise from the fact that profiles of the particle backscatter coefficient are widely measured with standard (Mie) backscatter lidar and advanced ceilometers, but the particle extinction coefficient is required to estimate the mass concentration (via mass-specific extinction coefficients) (Barnaba and Gobbi, 2004). Thus, extinction-to-backscatter ratios (lidar ratios) are needed to convert extinction-to-backscatter profiles into extinction 20
profiles and these into mass concentration profiles.
A few Raman lidars (at supersites) of a potential aerosol monitoring network consist-ing mostly of small standard backscatter lidars and ceilometers are sufficient to provide the necessary lidar-ratio information. The potential to measure polarized and Raman-backscattered light at several wavelengths simultaneously further increases the ability 25
ACPD
12, 13363–13403, 2012Fine and coarse particle profiling
A. Ansmann et al.
Title Page
Abstract Introduction
Conclusions References
Tables Figures
◭ ◮
◭ ◮
Back Close
Full Screen / Esc
Printer-friendly Version
Interactive Discussion
Discussion
P
a
per
|
Dis
cussion
P
a
per
|
Discussion
P
a
per
|
Discussio
n
P
a
per
A powerful aerosol remote sensing station is equipped with lidar and Sun photometer (M ¨uller et al., 2003). Photometers provide spectrally resolved column-integrated parti-cle extinction values (aerosol optical thickness, AOT) as well as AOT-related scattering-phase-function information at several wavelengths. They permit the retrieval of fine-mode- and coarse-fine-mode-related AOTs (O’Neill et al., 2003; Dubovik et al., 2006) and 5
of microphysical particle properties such as volume and surface-area concentrations for the coarse-mode and fine-mode fractions (Dubovik and King, 2000; Dubovik et al., 2006). Toledano et al. (2011, 2012) demonstrate the usefulness of Sun photometry in cases of complex aerosol scattering conditions. It has been shown that the combination of polarization lidar and Sun photometry is a robust and comparably simple technique 10
to separate coarse-mode and fine-mode particle fractions with vertical resolution and to retrieve profiles of coarse and fine particle mass concentrations (Ansmann et al., 2011b).
Here we present a more general approach to our lidar-photometer method which was successfully applied to European Aerosol Lidar Network (EARLINET) observations of 15
the Eyjafjallaj ¨okull volcanic aerosol plumes in Central and Southwestern Europe (Ans-mann et al., 2011b; Sicard et al., 2012). We now include applications to Saharan dust. In the course of the discussion, an extended review of recent observations of mass-specific extinction coefficients for Saharan and volcanic dust is presented. Such spe-cific extinction coefficients are required to convert measured particle optical properties 20
into microphysical information. After the introduction of the methodology in Sect. 2, ap-plications of the technique are discussed in Sect. 3. These case studies include unique observations of (a) a lofted, almost pure Saharan dust plume as typically observed over Central Europe after Saharan dust outbreaks (Ansmann et al., 2003; Papayannis et al., 2008; Wiegner et al., 2011b), (b) mixtures of desert dust with biomass-burning 25
ACPD
12, 13363–13403, 2012Fine and coarse particle profiling
A. Ansmann et al.
Title Page
Abstract Introduction
Conclusions References
Tables Figures
◭ ◮
◭ ◮
Back Close
Full Screen / Esc
Printer-friendly Version
Interactive Discussion
Discussion
P
a
per
|
Dis
cussion
P
a
per
|
Discussion
P
a
per
|
Discussio
n
P
a
per
|
after the eruptions of the Grimsv ¨otn volcano on Iceland in May 2011 (Kerminen et al., 2011; Tesche et al., 2012).
2 Method
The instruments, retrieval methods, and uncertainties are discussed in detail by Ansmann et al. (2011b). In this section, we briefly summarize the data processing 5
scheme and extend the methodology towards pure and mixed desert dust aerosols. An overview of the different steps of the retrieval procedure is given in Table 1.
The basic idea of the method is to use the depolarization ratio measured with lidar for the identification of layers with non-spherical particles and to quantify their contribution to the determined profile of the volume backscatter coefficient of particles. This part of 10
the data analysis is covered by steps 1–4 in Table 1.
The assumption that the fraction of light-depolarizing, non-spherical particles is iden-tical with the coarse-particle fraction is of fundamental importance in the retrieval. Ac-cording to this assumption, the coarse-mode AOT derived from the photometer ob-servations is caused by light extinction by non-spherical particles and the derived 15
coarse-mode particle volume concentration describes the volume concentration of spherical particles. Consequently, we assume that the lidar-derived fraction of non-depolarizing, spherical particles is identical with the fine-mode particle fraction and is thus responsible for the fine-mode AOT. This approach holds for continental aerosols, e.g., for mixtures of desert dust and biomass-burning smoke (Tesche et al., 2009b, 20
2011b) and mixtures of volcanic dust and urban haze (Ansmann et al., 2011b). The assumption is not valid for aerosols containing non-depolarizing, coarse particles, e.g., marine aerosol. It is worth mentioning that coarse marine particles (sea salt particles) in the humid marine boundary layer are always covered by a spherical water shell so that their depolarization ratio is zero. This is corroborated by field observations (Groß 25
ACPD
12, 13363–13403, 2012Fine and coarse particle profiling
A. Ansmann et al.
Title Page
Abstract Introduction
Conclusions References
Tables Figures
◭ ◮
◭ ◮
Back Close
Full Screen / Esc
Printer-friendly Version
Interactive Discussion
Discussion
P
a
per
|
Dis
cussion
P
a
per
|
Discussion
P
a
per
|
Discussio
n
P
a
per
In our data analysis, we assume an externally mixed aerosol which contains only one type of coarse-mode particles. In order to retrieve the mass concentration of desert dust we must be sure that the influence of marine and volcanic particles on the mea-sured optical properties is negligible. Vice versa, in the estimation of volcanic particle mass concentrations we have to assume that interference by desert dust and marine 5
particles can be ignored. This assumption was, for example, not fulfilled in the case of Eyjafjallaj ¨okull volcanic measurements over Southeastern Europe in April and May 2010 (Papayannis et al., 2012). Volcanic dust and desert dust occurred simultaneously and contributed to the observed coarse-mode fraction.
Steps 1–3 of our retrieval (see Table 1) are straightforward and well-established 10
lidar methods. In step 4, the backscatter contributions of the non or weakly light-depolarizing particles (e.g., urban haze and biomass-burning smoke) and the strongly light-depolarizing particles (e.g., volcanic or desert dust) are separated. Here, we have to assume characteristic particle depolarization ratios. For desert dust, we use a value of 0.31±0.03 (Freudenthaler et al., 2009; Groß et al., 2011b), for volcanic dust 15
0.34±0.03 (Ansmann et al., 2010; Wiegner et al., 2011a; Groß et al., 2012), and for fine-mode and marine particles 0.02±0.02 (Groß et al., 2011b).
In step 5 of the retrieval after Table 1, we estimate the profiles of the volume extinction coefficients σf and σc for fine and coarse mode by multiplying the fine and coarse particle backscatter coefficientsβfandβcwith respective fine and coarse particle lidar 20
ratios. Raman lidar observations indicate lidar ratios from 45 to 65 sr for desert dust and volcanic dust. The values accumulate between 50 and 60 sr (Tesche et al., 2009a; Ansmann et al., 2010; Groß et al., 2011b, 2012; Wiegner et al., 2011b). The range of values for the fine-mode particle lidar ratio is much larger. Urban haze particles show values from 30 to 80 sr (M ¨uller et al., 2007). Lidar ratios of absorbing biomass-burning 25
ACPD
12, 13363–13403, 2012Fine and coarse particle profiling
A. Ansmann et al.
Title Page
Abstract Introduction
Conclusions References
Tables Figures
◭ ◮
◭ ◮
Back Close
Full Screen / Esc
Printer-friendly Version
Interactive Discussion
Discussion
P
a
per
|
Dis
cussion
P
a
per
|
Discussion
P
a
per
|
Discussio
n
P
a
per
|
vertically integrated backscatter coefficient for non-depolarizing particles (from the lidar observations.) This point is further discussed in Sect. 3.
In step 7 of the retrieval (step 6 is explained afterwards), the mass concentrationsmf andmc of fine-mode and coarse-mode particles, respectively, are estimated by using the lidar-derived particle extinction coefficientsσf andσc:
5
mf= σf
kext,f, (1)
mc= σc
kext,c
. (2)
kext,f=σext,f/(ρfVf) andkext,c=σext,c/(ρcVc) are the mass-specific extinction coefficients for fine mode and coarse mode, respectively.σext,fandσext,cdenote the volume extinc-10
tion coefficients that are caused by the respective particle mass densitiesρfVfandρcVc. ρandV are particle density and particle volume concentration, respectively.
We useρcof 2.6 g cm−3for desert dust (Hess et al., 1998; Gasteiger et al., 2011) and
volcanic dust particles (Ansmann et al., 2011b). For fine-mode particles, we assume ρf of 1.5–1.6 g cm−3(Cozic et al., 2008; Bukowiecki et al., 2011) for Central European
15
haze and for the sulfate aerosol which formed from the volcanic SO2emissions. These values of ρf consider a variable liquid water content of the mostly sulfate-containing particles (ammonium sulfate) (Hess et al., 1998; Tang and Munkelwitz, 1994). The wa-ter content increases with ambient relative humidity. In the analysis of a mixed aerosol plume containing desert dust and biomass-burning smoke in Sect. 3, we use ρf of 20
1.35 g cm−3for the biomass-burning particles (Reid et al., 2005).
The ratiosσext,f/Vfandσext,c/Vccan vary significantly as a function of particle size dis-tribution (Barnaba and Gobbi, 2004). Thus, actual estimates of these ratios are required in the data analysis. As proxies forσext,c/Vcandσext,f/Vf we use the AERONET obser-vations of the ratio of AOTτcto the column-integrated volume concentrationvcfor the 25
ACPD
12, 13363–13403, 2012Fine and coarse particle profiling
A. Ansmann et al.
Title Page
Abstract Introduction
Conclusions References
Tables Figures
◭ ◮
◭ ◮
Back Close
Full Screen / Esc
Printer-friendly Version
Interactive Discussion
Discussion
P
a
per
|
Dis
cussion
P
a
per
|
Discussion
P
a
per
|
Discussio
n
P
a
per
and (2) can then be written as (Ansmann et al., 2011b)
mf=ρf(vf/τf)σf, (3)
mc=ρc(vc/τc)σc. (4)
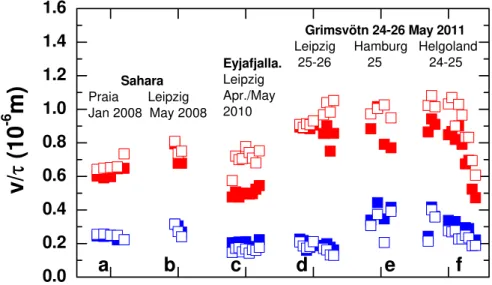
v/τ denotes the temporal mean value of individual values of v/τ observed within 5
a given time period. Time series of observed values of vf/τf and vc/τc for the desert
dust and volcanic dust events discussed in Sect. 3 are presented in Fig. 1.
The comparably weak variability in the Saharan dust v/τ ratios in Fig. 1 (cases a and b) found at sites close to the source as well as at remote locations and the likewise strong changes in the volcanic v/τ ratio motivated us to review the recent 10
literature concerning observed and modelled mass-specific extinction coefficients for desert dust and volcanic dust and to re-analyze own AERONET Sun photometer ob-servations performed during strong Saharan dust outbreaks at Leipzig in October 2001 (Ansmann et al., 2003; M ¨uller et al., 2003) and May 2008 (Wiegner et al., 2011b) and during the SAMUM-1 (close to the desert dust source region) and SAMUM-2 cam-15
paigns (long-range transport regime). Table 2 provides an overview of this effort. Only a few, carefully selected Saharan dust observations are considered to assure a negli-gible contamination with anthropogenic fine-mode particles. However, airborne in-situ observations may suffer from high uncertainties in the retrieval of the entire particle size spectrum and the subsequent retrieval of the coarse-mode particle volume con-20
centration. As a consequence, we used the accurate SAMUM-1 PM2.5 (particles with diameters<2.5 µm) observations of Weinzierl et al. (2009) in Table 2 instead of the results for the entire size distribution and multiplied the respective PM2.5 volume con-centration by a factor of 3.1 to estimate the total volume concon-centration (as considered in Table 2). This factor of 3.1 was derived from ground-based SAMUM-1 and SAMUM-2 25
observations (Kandler et al., 2009, 2011).
ACPD
12, 13363–13403, 2012Fine and coarse particle profiling
A. Ansmann et al.
Title Page
Abstract Introduction
Conclusions References
Tables Figures
◭ ◮
◭ ◮
Back Close
Full Screen / Esc
Printer-friendly Version
Interactive Discussion
Discussion
P
a
per
|
Dis
cussion
P
a
per
|
Discussion
P
a
per
|
Discussio
n
P
a
per
|
more equally distributed from 0.4 to 1.0 (Johnson et al., 2012; Gasteiger et al., 2011). All values, except the ones from the study of Hervo et al. (2012), are based on the assumption of a coarse-particle mass density of 2.6 g m−3. Hervo et al. (2012) pro-vide mass-specific extinction coefficients for volcanic dust derived from measurements without assumptions on particle mass density. However, they derived the specific ex-5
tinction coefficients for the wavelength of 355 nm. In Table 2, we assume that these values still hold for 500–550 nm (i.e., we assume no wavelength-dependence of the extinction coefficient and AOT for coarse particles).
Volcanic particle size distributions seem to vary strongly depending on the distance to the source and eruption type (explosive, less explosive, ice-capped explosion or not). 10
The significant difference between coarse-mode v/τ values after the Eyjafjallaj ¨okull and Grimsv ¨otn volcanic eruptions in Fig. 1 corroborate this hypothesis. The larger the particles the larger the ratiov/τ, and the lower the mass-specific extinction coefficient (provided the mass density of the volcanic dust particles is similar for both volcanic events).
15
Even for fine particles (urban haze, biomass-burning smoke, fresh and aged sulfate aerosol originating from volcanic SO2emissions) thev/τ values can vary within a fac-tor of two (see Table 2 and Fig. 1, Helgoland and Hamburg versus Leipzig values). The model simulations by Barnaba and Gobbi (2004) in Table 2 withkext,f values from 3.0–4.0 m2g−1 consider the full range of realistic size distributions of aged fine-mode 20
European haze.
The spread of the kext values in Table 2 for a given aerosol type may provide an impression about the range of uncertainty in the particle mass retrieval after Eqs. (4) and (3) when using literature values in the data analysis. Our strategy is therefore to always check the actual values ofvf/τf and vc/τc from Sun photometer observations 25
performed side by side with the lidar observations.
ACPD
12, 13363–13403, 2012Fine and coarse particle profiling
A. Ansmann et al.
Title Page
Abstract Introduction
Conclusions References
Tables Figures
◭ ◮
◭ ◮
Back Close
Full Screen / Esc
Printer-friendly Version
Interactive Discussion
Discussion
P
a
per
|
Dis
cussion
P
a
per
|
Discussion
P
a
per
|
Discussio
n
P
a
per
backscatter coefficients by using measured volume depolarization ratios and assuming depolarization ratios representative for fine and coarse mode, from uncertainties in the lidar-ratio estimates applied to obtain the extinction coefficients, from the estimation of particle mass densities, and from uncertainties in the photometer-derivedv/τ ratios. In the worst case with relative errors of 20 % in the retrieval of the backscatter coeffi -5
cients, 20 % in the successive conversion to extinction coefficients, 25 % in the mass density estimates, and 50 % in the usedv/τ ratio, the overall uncertainty is 60–70 %. In a realistic scenario with supporting Raman lidar observation of the particle lidar ratio (10 % uncertainty), actual AERONET observations of v/τ (10 % uncertainty), actual column lidar ratios from combined lidar-photometer measurements (10 % uncertainty), 10
and realistic uncertainties of 10 % in the particle density estimates, the relative errors of the coarse and fine particle mass concentrations is of the order of 20–25 %.
3 Measurement examples
We present four exemplary measurement cases. Two cases deal with Saharan dust. The third and fourth examples show volcanic aerosol measurements and, for the first 15
time, comparisons of lidar-photometer observations performed after the Eyjafjallaj ¨okull volcanic eruptions in April 2010 with observations at Leipzig after the Grimsv ¨otn vol-canic eruptions in May 2011. All heights are given above ground level.
3.1 Saharan dust above urban haze
The retrieved particle properties of a Saharan dust outbreak towards Central Europe 20
are shown in Fig. 2. This outbreak is also discussed in detail by Wiegner et al. (2011b) based on Munich Raman lidar observations about 400 km south of Leipzig. A clear separation of the boundary layer (reaching to 500 m height) and the lofted Saharan dust layer (extending from 500 to 6500 m height) was observed over Leipzig on 29 May 2008.
ACPD
12, 13363–13403, 2012Fine and coarse particle profiling
A. Ansmann et al.
Title Page
Abstract Introduction
Conclusions References
Tables Figures
◭ ◮
◭ ◮
Back Close
Full Screen / Esc
Printer-friendly Version
Interactive Discussion
Discussion
P
a
per
|
Dis
cussion
P
a
per
|
Discussion
P
a
per
|
Discussio
n
P
a
per
|
The Raman lidar method was applied to determine the height profile of the total par-ticle backscatter coefficient in Fig. 2a (retrieval step 2 after Table 1). The Raman lidar method could be used in all four example cases, even during daytime measurements of the volcanic aerosol discussed below. The technique provides most accurate solutions for the backscatter coefficient down to very low heights (if the lidar is well adjusted as 5
is the case here).
By assuming depolarization ratios of 31 % and 2 % for pure Saharan dust and an-thropogenic haze, respectively, we separated the particle backscatter coefficients for coarse mode and fine mode (retrieval step 4 after Table 1). It can be seen in Fig. 2c that traces of anthropogenic particles or other spherical fine-mode particles are present 10
in the lower part of the dust plume up to 3 km height, probably caused by upward mix-ing of polluted air durmix-ing the transport over Northern Africa, the Mediterranean, and Southern Europe.
In the conversion of the backscatter profiles into extinction profiles (retrieval step 5) we assumed a volcanic-dust lidar ratio of 55 sr and a fine-mode lidar ratio of 65 sr. The 15
profiles of the particle extinction coefficients for fine and coarse mode are shown in Fig. 2d.
The particle mass concentrations for desert dust and the fine-mode particle fraction are computed by using the information shown in Fig. 1 (case b, retrieval steps 6). With ρc=2.6 g cm−3,ρf=1.6 g cm−3, and mean values ofvc/τc=0.74×10−6m andvf/τf=
20
0.29×10⁻⁶m we obtain a mass-specific extinction coe
fficient ofkext,c=0.52 m2g−1and
kext,f=2.19 m2g−1for the coarse and fine mode, respectively. By using these numbers
in the conversion of the extinction coefficients into mass concentrations after Eqs. (4) and (3) we end up with the mass profiles in Fig. 2e (retrieval step 7).
As can be seen in Fig. 2e desert dust mass concentrations of up to 300–500 µg m−3 25
ACPD
12, 13363–13403, 2012Fine and coarse particle profiling
A. Ansmann et al.
Title Page
Abstract Introduction
Conclusions References
Tables Figures
◭ ◮
◭ ◮
Back Close
Full Screen / Esc
Printer-friendly Version
Interactive Discussion
Discussion
P
a
per
|
Dis
cussion
P
a
per
|
Discussion
P
a
per
|
Discussio
n
P
a
per
anthropogenic haze layer, in which the pollution accumulates over days and remains trapped, is then rather shallow with depths<1 km.
In order to prove the overall consistency of the lidar-photometer observations and to check the validity of the assumption that the non-light-depolarizing particle fraction is identical with the fine-mode fraction and that the light-depolarizing particle fraction 5
represents the coarse particle fraction, we compute the column-integrated backscatter coefficient (CB) at 532 nm from the fine-mode and coarse-mode backscatter profiles (obtained in retrieval step 4, Table 1) and form the AOT/CB ratios by using the corre-sponding 532 nm AOTs for fine-mode and coarse mode, obtained from the photometer observation. The 532 nm AOTs (total, fine, coarse in Table 3) are obtained from the 10
measured 500 nm AOTs by means of the retrieved ˚Angstr ¨om exponents (O’Neill et al., 2003). Table 3 shows the 532 nm values for CB, AOT, AOT/CB, and the ˚Angstr ¨om expo-nent. The coarse-mode ˚Angstr ¨om exponent is set to zero in the photometer data analy-sis (O’Neill et al., 2003). The column lidar ratio AOT/CB is by definition the backscatter-coefficient-weighted vertical mean extinction-to-backcatter ratio (Ansmann, 2006). This 15
means that layers with strong backscattering control the column lidar ratio.
As can be seen in Table 3, for the case of the strong Saharan dust outbreak, the fine-mode and coarse-mode-related AOTs were about 0.16 and 0.61 at 532 nm, re-spectively, during one of the last Sun photometer measurements on 29 May 2008, 17:30 UTC, about 4 h before the lidar observations in Fig. 2 were performed. The val-20
ues varied by about 10 % as a function of time and were only slightly lower in the next morning according to the AERONET observations. Together with the lidar-derived column backscatter values CB for the non-depolarizing (fine mode) and depolarizing (coarse mode) particle fractions we obtain column lidar ratios of about 64 sr (fine mode) and 52 sr (coarse mode). These values are typical for anthropogenic, aged, moderately 25
absorbing urban haze (M ¨uller et al., 2007), and for desert dust (Tesche et al., 2009a, 2011a; Groß et al., 2011b), respectively.
ACPD
12, 13363–13403, 2012Fine and coarse particle profiling
A. Ansmann et al.
Title Page
Abstract Introduction
Conclusions References
Tables Figures
◭ ◮
◭ ◮
Back Close
Full Screen / Esc
Printer-friendly Version
Interactive Discussion
Discussion
P
a
per
|
Dis
cussion
P
a
per
|
Discussion
P
a
per
|
Discussio
n
P
a
per
|
532 nm and dust depolarization ratios of 30–35 % at this wavelength. Our own Raman lidar observations on that evening yield an AOT for the dust layer of 0.65 (from 500– 6000 m) and lidar ratios around 55 sr at both 355 and 532 nm. Thus the consistency of the lidar-photometer observations suggest that the basic assumption of the retrieval scheme is justified.
5
The very low ˚Angstr ¨om exponent (for the total aerosol) in Table 3 indicates the strong influence of desert dust on the spectral AOT in this case. A typical fine-mode ˚Angstr ¨om exponent of 1.5 for urban haze was derived. As mentioned, in the retrieval of fine-mode and coarse-mode AOT, the coarse-mode ˚Angstr ¨om exponent is set to zero (O’Neill et al., 2003), which is in full agreement with our Raman lidar observation of the extinc-10
tion coefficients at 355 and 532 nm during this evening.
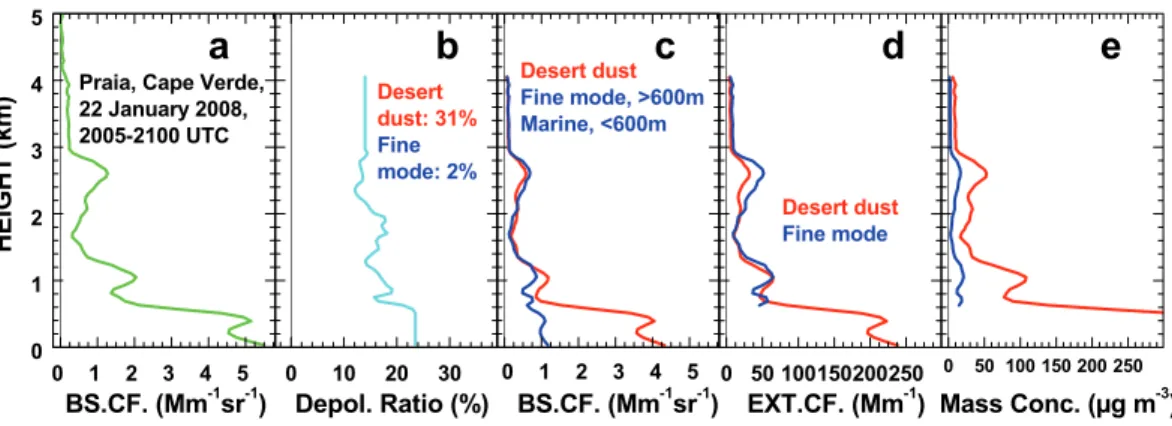
3.2 Saharan dust mixed with biomass-burning smoke
During the SAMUM-2 campaign in January and February 2008, lofted aerosol layers containing desert dust and biomass-burning smoke were frequently advected across the lidar site at Praia, Cape Verde (Groß et al., 2011b; Tesche et al., 2011a; Toledano 15
et al., 2011). The aerosol stratification in Fig. 3 is typical for the winter season over the eastern tropical North Atlantic (Ben-Ami et al., 2009). During the dry season in Central Africa, a belt with strong fire activity extending over several thousands of kilometers from Western to Eastern Africa produces large amounts of fire smoke which is carried towards the Americas by dust-laden air (Ansmann et al., 2009; Ben-Ami et al., 2010; 20
Baars et al., 2011).
The case, shown in Fig. 3, is discussed by Tesche et al. (2011a,b) and Groß et al. (2011a). Three ground-based SAMUM lidars contributed to Fig. 3. Two of them were optimized for near-range (marine boundary layer, MBL) observations and one for far-range measurements up to the tropopause (<17 km height). By using a scanning po-25
ACPD
12, 13363–13403, 2012Fine and coarse particle profiling
A. Ansmann et al.
Title Page
Abstract Introduction
Conclusions References
Tables Figures
◭ ◮
◭ ◮
Back Close
Full Screen / Esc
Printer-friendly Version
Interactive Discussion
Discussion
P
a
per
|
Dis
cussion
P
a
per
|
Discussion
P
a
per
|
Discussio
n
P
a
per
The profile of the total particle backscatter coefficient in Fig. 3a indicates strong backscattering within the MBL (top at about 600 m height) and moderate backscattering up to 4 km height. The particle depolarization ratio in Fig. 3b shows values around 24 % throughout the MBL caused by a strong contribution of desert dust to particle backscattering. Only 20 % of MBL backscattering was caused by marine particles on 5
this day. If we keep in mind that the lidar ratios of marine particles and mineral dust are 20 sr and 55 sr, respectively, the marine extinction coefficients were about 20 Mm−1and the ones for desert dust particles 200–250 Mm−1(Fig. 3d), and therefore more than an
order of magnitude higher than the marine values.
Accurate particle depolarization ratios were obtained up to 3 km height (Fig. 3b). 10
Above that height we assumed a similar depolarization ratio up to the top of the smoke layer. Particle depolarization ratios from 10–20 % indicate a strong influence of smoke on the optical properties. The backscatter coefficients for fine and coarse mode in Fig. 3c corroborate the hypothesis. Above 1000 m height smoke and dust contributed almost equally to particle backscattering. However, the smoke extinction coefficients 15
were slightly higher than the dust-related ones owing to the fact that the smoke lidar ratio was much larger than the dust lidar ratio (Fig. 3d). Lidar ratios of 55 sr (desert dust, coarse mode) and 75 sr (biomass-burning particles, fine mode) were used in the conversion of backscatter into extinction coefficients.
In the retrieval of the mass concentrations we usedρf=1.35 g cm−3, and mean
val-20
ues ofvc/τc=0.64×10−6m and vf/τf=0.24×10− 6
m (computed from the individual values in Fig. 1, case a). The respective fine-mode and coarse-mode-related mass-specific extinction coefficients arekext,c=0.60 m2g−1 and kext,f=3.09 m2g−1, respec-tively.
Because we cannot separate marine and smoke contributions to backscattering in 25
the MBL (both aerosol types do not depolarize laser light), we provide particle mass concentration for the fine mode (smoke) only for heights above the MBL in Fig. 3d. A mean of about 10 µg m−3 of smoke mass concentration was observed on that day
ACPD
12, 13363–13403, 2012Fine and coarse particle profiling
A. Ansmann et al.
Title Page
Abstract Introduction
Conclusions References
Tables Figures
◭ ◮
◭ ◮
Back Close
Full Screen / Esc
Printer-friendly Version
Interactive Discussion
Discussion
P
a
per
|
Dis
cussion
P
a
per
|
Discussion
P
a
per
|
Discussio
n
P
a
per
|
300–400 µg m−3 in the MBL and from 25–100 µg m−3 in the free troposphere. We
ob-served similar dust-smoke layers almost continuously during the SAMUM-2 campaign from 15 January to 15 February 2008 (Tesche et al., 2011a,b). Smoke-related particle extinction coefficients ranged from 25–100 Mm−1between 1000 and 5000 m height and
indicated smoke particle mass concentrations of 10–35 µg m−3. It is interesting to note 5
that Baars et al. (2011) found fine-mode-related extinction values of 10–70 Mm−1in the
Amazon rain forest north of Manaus, Brazil, during the wet season (February to May 2008) caused by long-range transport of African smoke. These extinction values indi-cate mass concentrations of African smoke particles of 5–20 µg m−3 over the Amazon
rain forest. 10
Water-uptake effects and associated uncertainties in the retrieval of the mass con-centrations of dry but hygroscopic smoke particles were estimated to be <25 %. In most cases, SAMUM radiosonde launches at the lidar site indicated relative humdities below 70–80 %. Saharan dust is almost hydrophobic so that water uptake does not play a role here.
15
The question may arise why the layer with strong dust backscatter over Cape Verde coincides with the marine boundary layer. This results from very different air mass flows with winds from northeast in the boundary layer and from southerly direction within the smoke-containing air above 600 m height.
The lidar-photometer consistency check revealed good agreement. As can be seen 20
in Table 3, the total AOT was about 0.3, with a dust fraction of 0.6 after eliminating a marine contribution of the order of 0.01 on that day (Groß et al., 2011a). The sep-aration of dust and marine particles by means of the depolarization ratio is described by Groß et al. (2011b). AERONET photometer results for 22 January 2008 are only available as level 1.0 products. However, they are in good agreement with the quality-25
checked level 2.0 results for 23 January 2008 (early morning) and with observations of a second SAMUM photometer on 22 January 2008 (Toledano et al., 2011).
ACPD
12, 13363–13403, 2012Fine and coarse particle profiling
A. Ansmann et al.
Title Page
Abstract Introduction
Conclusions References
Tables Figures
◭ ◮
◭ ◮
Back Close
Full Screen / Esc
Printer-friendly Version
Interactive Discussion
Discussion
P
a
per
|
Dis
cussion
P
a
per
|
Discussion
P
a
per
|
Discussio
n
P
a
per
dust of around 55 sr (Tesche et al., 2009a). Note the large lidar ratio for the fine mode which indicates strongly absorbing smoke particles (Tesche et al., 2011b). Our Raman lidar observations during that evening show smoke-related lidar ratios from 50–100 sr (on average values of 60–70 sr) at 532 nm for the smoke layer. The photometer-derived fine-mode AOT was 0.11 at about 18:30 UTC, while the Raman lidar observations after 5
20:00 UTC indicate a value of 0.08–0.09 for the fine-mode AOT at 532 nm so that the column lidar ratio for the smoke fraction was probably in the range of 70–80 sr, and thus 25 % lower than the value of 98 sr in Table 3 during the lidar measurement ses-sion. Again, the overall consistency of the entire observational data set is very good after this in-depth check so that the retrieval of mass concentrations is reliable.
10
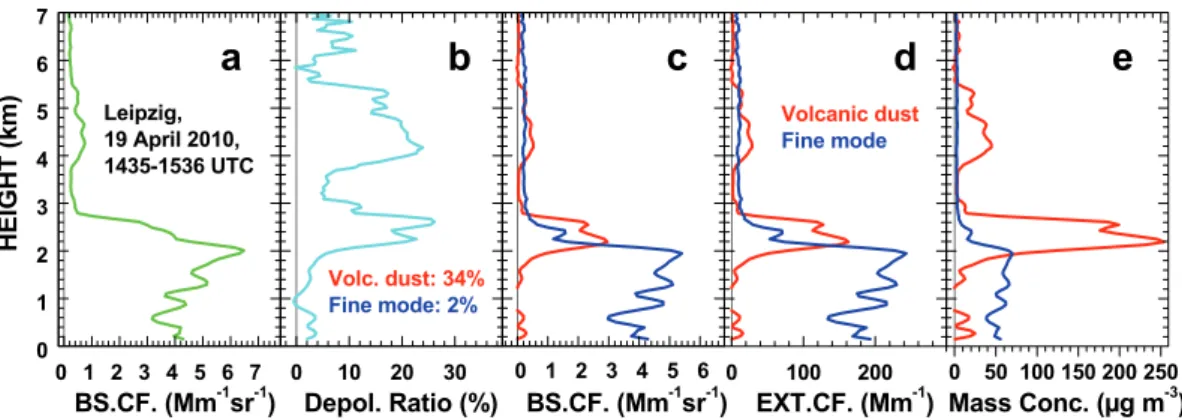
3.3 Eyjafjallaj ¨okull volcanic aerosol plume
The evolution of the aerosol layering over Leipzig on 19 April 2010, 4–5 days after the strong eruptions of the Icelandic Eyjafjallaj ¨okull volcano is discussed by Ansmann et al. (2011a). A characteristic scene from the afternoon of that day is shown in Fig. 4. During this time period, a research aircraft (Falcon aircraft of German Aerospace 15
Center) performed height-resolved in situ aerosol observations over Leipzig from 2– 6 km height between 14:51–15:28 UTC (Schumann et al., 2011). The boundary layer reached maximum heights of about 1400 m on 19 April 2010. However, the layer with strong backscattering was almost 3 km deep (Fig. 4a). Above the boundary layer the at-mosphere was dry with relative humidities of 50–60 % in the layer from 1.5–3 km height 20
and below 25 % higher up (Schumann et al., 2011). The depolarization ratio in Fig. 4b indicates three layers, one with non-light-depolarizing particles (sulfate, urban haze) up to about 1.6 km, and two layers with considerable depolarization from 1.8–2.8 km and from 3.8–5.5 km height. The latter were caused by a mixture of fine- and coarse-mode particles. The backscatter and extinction profiles for fine and coarse mode show this 25
more quantitatively (Fig. 4c, d). Volcanic dust mass concentrations of up to 250 µg m−3 (1.8–2.8 km height) and 40 µg m−3(3.8–5.5 km) were derived (Fig. 4e). The aircraft
ACPD
12, 13363–13403, 2012Fine and coarse particle profiling
A. Ansmann et al.
Title Page
Abstract Introduction
Conclusions References
Tables Figures
◭ ◮
◭ ◮
Back Close
Full Screen / Esc
Printer-friendly Version
Interactive Discussion
Discussion
P
a
per
|
Dis
cussion
P
a
per
|
Discussion
P
a
per
|
Discussio
n
P
a
per
|
(Schumann et al., 2011). Relatively well-mixed conditions with mass concentrations of 50–80 µg m−3were found for the fine-mode fraction in the lowermost 2 km of the
atmo-sphere. Aged sulfate aerosol originating from the volcanic SO2 plumes considerably contributed to the fine-mode particle mass (about 50 %) on that day (Ansmann et al., 2011a).
5
The fine- and coarse-mode-related mass-specific extinction coefficients arekext,c=
0.64 m2g−1 and kext,f=3.47 m2g−1 in this case, with mean values of vc/τc=0.60× 10−6m andv
f/τf=0.18×10−6m according to Fig. 1 (case c). Lidar ratios of 55 sr
(vol-canic dust) and 45 sr (sulfate particles, see discussion below) were used in the conver-sion of the backscatter into particle extinction coefficients shown in Fig. 4d.
10
The total and fine-mode AOT were unusually high with values of 0.65 and 0.51 at 532 nm, respectively (see Table 3). Together with the CB values we obtain column lidar ratios of about 45 sr (fine mode) and almost 55 sr for the volcanic dust. The fine-mode lidar ratio is typical for non-absorbing accumulation mode particles (M ¨uller et al., 2007). The coarse-mode lidar ratio of 55 sr is characteristic for volcanic dust (Ansmann et al., 15
2010; Groß et al., 2012).
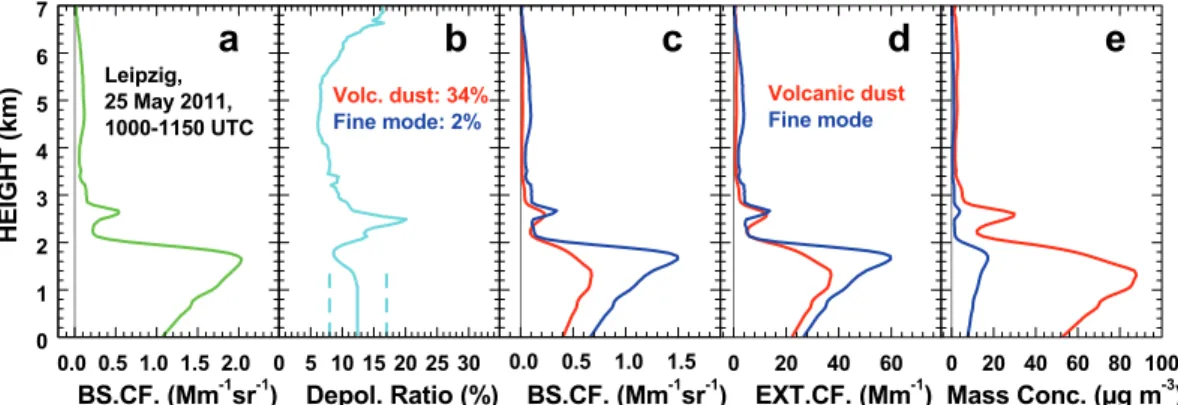
3.4 Grimsv ¨otn volcanic aerosol
According to reports of the Icelandic Meteorological Office (IMO) the erup-tions of the ice-capped Eyjafjallaj ¨okull volcano in April 2010 were more explo-sive than the eruptions of the Grimsv ¨otn volcano in May 2011 (http://en.vedur.is/ 20
earthquakes-and-volcanism/articles/nr/2220 and 2221). The latter also started as sub-glacial eruptions which, however, quickly broke the ice cover. Compared to the Ey-jafjallj ¨okull case, the Grimsv ¨otn volcanic eruptions resulted in the release of coarser particulate matter according to the IMO report.
First volcanic plumes reached Central Europe on 24 May 2011, about 2.5 days 25
ACPD
12, 13363–13403, 2012Fine and coarse particle profiling
A. Ansmann et al.
Title Page
Abstract Introduction
Conclusions References
Tables Figures
◭ ◮
◭ ◮
Back Close
Full Screen / Esc
Printer-friendly Version
Interactive Discussion
Discussion
P
a
per
|
Dis
cussion
P
a
per
|
Discussion
P
a
per
|
Discussio
n
P
a
per
25 May 2011. A consistent air flow from the North Atlantic (Iceland area), across the UK towards Germany prevailed in the lowermost 2 km of the atmosphere on 25 and 26 May 2011 (until noon). Figure 5 presents lidar observations during the passage of the densest volcanic dust plumes. Traces of the volcanic emissions crossed Leipzig up to a height of 4 km on 25 May 2011, 10:00–12:00 UTC. Above 4 km height fur-5
ther aerosol layers were detected. These layers were advected from southwesterly directions according to the transport simulations. They probably originated from North Africa and/or North America (mixture of desert dust and aged urban haze). Such lofted aerosols are a common feature during the summer half year (Mattis et al., 2008). The AOT of the non-volcanic aerosols above 4 km height was estimated to be less than 10
0.008 and is thus ignored in the following discussion of lidar-photometer observations. The increasing particle depolarization ratio for heights above 6 km in Fig. 5b may not be trustworthy. The uncertainty in the particle depolarization ratio steadily increases when the particle backscatter coefficient approaches zero.
In agreement with the IMO report, the microphysical and optical properties of the 15
Grimsv ¨otn volcanic aerosol were found to be very different from the Eyjafjallaj ¨okull volcanic particle characteristics. Figure 1 indicates larger volcanic dust particles in May 2011. The mean value of vc/τc of 0.90×10⁻⁶m for the Grimsv ¨otn volcanic dust is
50 % higher than the respective Eyjafjallj ¨okull value of 0.60×10⁻⁶m. The coarse-mode-related mass-specific extinction coefficients kext,c are 0.43 m2g−1 for the Grimsv ¨otn
20
aerosol and 0.64 m2g−1 for the Eyjafjallaj ¨okull particles. The extinction coefficients in
Fig. 5d are computed with lidar ratiosof 55 sr for volcanic dust and 40 sr for the fine-mode particles (according to the discussion below).
In contrast to the Eyjafjallaj ¨okull volcanic dust plumes (mostly advected in the free troposphere), the Grimsv ¨otn aerosol was found in the lowermost 2 km of the tropo-25
ACPD
12, 13363–13403, 2012Fine and coarse particle profiling
A. Ansmann et al.
Title Page
Abstract Introduction
Conclusions References
Tables Figures
◭ ◮
◭ ◮
Back Close
Full Screen / Esc
Printer-friendly Version
Interactive Discussion
Discussion
P
a
per
|
Dis
cussion
P
a
per
|
Discussion
P
a
per
|
Discussio
n
P
a
per
|
periods. At ground the relative humidity ranged from 35–45 % according to the meteo-rological station of the institute. The high relative humidity in the upper boundary layer must be kept in consideration when discussing the mass concentrations. The profiles in Fig. 5 are computed from signal profiles after cloud–screening. The total backscatter coefficient in Fig. 5a indicates the increasing influence of water uptake by fine-mode as 5
well as by the volcanic dust particles (Lathem et al., 2011). The drop in the depolariza-tion ratio in the upper boundary layer (1400–2000 m) is consistent with a change in the shape properties of the volcanic dust particles. A part of the coarse particles became obviously spherical.
Unfortunately the depolarization values in Fig. 5b are not very trustworthy at heights 10
below 1200 m because the respective measurement channels were not optimized on that day. The signal channel for cross-polarized light showed saturation effects in the near range (<1200 m height) during this event with unexpectedly strong depolarization return signals. As a consequence we put large uncertainty bars to the boundary layer profile of the particle depolarization ratio below 1200 m. Because there was no layer 15
with pure volcanic dust for the determination of a Grimsv ¨otn volcanic dust depolariza-tion ratio we assume that the volcanic dust depolarizadepolariza-tion ratio for the Eyjafjallaj ¨okull event also holds for the Grimsv ¨otn case. Clearly, more depolarization observations of volcanic dust are needed to allow for a more general and accurate quantification of volcanic dust mass concentrations with polarization lidars.
20
Because of a potential water-uptake effect, the results in Fig. 5c, d, e are not trust-worthy for heights between 1.4 and 2.0 km. Mass concentrations of volcanic dust are reliable for heights<1.2 km and from 2–3 km height. In the lower part of the boundary layer, the volcanic dust mass concentration ranged from 50–90 µg m−3.
Tesche et al. (2012) analyzed in situ surface aerosol observations throughout Scan-25
ACPD
12, 13363–13403, 2012Fine and coarse particle profiling
A. Ansmann et al.
Title Page
Abstract Introduction
Conclusions References
Tables Figures
◭ ◮
◭ ◮
Back Close
Full Screen / Esc
Printer-friendly Version
Interactive Discussion
Discussion
P
a
per
|
Dis
cussion
P
a
per
|
Discussion
P
a
per
|
Discussio
n
P
a
per
volcanic dust front crossed the observational site. The peak mass concentrations were close to 160 µg m−3(Gothenburg, Sweden), 130 µg m−3(Oslo, Norway, and Stockholm,
Sweden) and 100 µg m−3at Helsinki, Finland (Kerminen et al., 2011). By using the
re-trieval method presented here, volcanic dust mass concentrations were estimated from the Stockholm lidar observations. The values range from 150–300 µg m−3 in the layer 5
below 2 km height to 150–400 µg m−3in a lofted layer from 2–4 km height detected in
the early morning of 25 May 2011 (Tesche et al., 2012).
The water-uptake effect remains to be discussed in more detail. Lathem et al. (2011) show that volcanic dust particles are hygroscopic. The mean radius of volcanic dust particles was found to increase by 2–10 % when the relative humidity increases from 10
40 % to 90 %. This means that the effective radius (area-weighted mean radius of the particle size distribution) increases by roughly 5–20 % which in turn leads to an in-crease invc/τc by 5–20 % (Gasteiger et al., 2011). On the other hand, water uptake leads to a decrease in particle density from 2.6 to 2.5 g m−3 (2 % increase of radius)
and from 2.6 to 2.1 g m−3 (10 % increase of radius). Most important however is that
15
an increasing water content changes the shape characteristics of the originally non-spherical particles. A part of the volcanic dust particles obviously became completely spherical during the observation from 10:00–11:50 UTC in Fig. 5 and, as a conse-quence, the depolarization ratio decreased with height at the top of the well-mixed layer. Large spherical particles show a much higher reflectivity (i.e., backscatter co-20
efficient) than non-spherical particles. According to the extinction-to-backscatter ratio of 55 sr for non-spherical particles and about 20 sr for large spherical particles, the reflectivity is increased by a factor of almost 3.
The large spherical particles are interpreted as fine-mode particles (according to our basic assumption that non-depolarizing particles are fine-mode particles). As a conse-25
ACPD
12, 13363–13403, 2012Fine and coarse particle profiling
A. Ansmann et al.
Title Page
Abstract Introduction
Conclusions References
Tables Figures
◭ ◮
◭ ◮
Back Close
Full Screen / Esc
Printer-friendly Version
Interactive Discussion
Discussion
P
a
per
|
Dis
cussion
P
a
per
|
Discussion
P
a
per
|
Discussio
n
P
a
per
|
CB value for the coarse mode is too low and thus the column lidar ratio too high. A con-version of 10 % of the volcanic non-spherical coarse-mode particles to spherical ones can explain the observed effect and the change of the column lidar ratios from typical values for fine particles of around 40 sr to 22 sr (fine mode) and from typical lidar ratios for volcanic dust of around 50 sr to the observed one of close to 60 sr.
5
Another interesting feature in Table 3 is the very large fine-mode ˚Angstr ¨om exponent of 2.7. This is consistent with the hypothesis that a large number of freshly formed sulfate particles originating from the volcanic SO2 were present. The corresponding effective radius of 0.11 µm as given in the AERONET data base is very low.
4 Conclusions
10
We extended the lidar-photometer method introduced for the estimation of volcanic dust mass concentrations to Saharan dust cases. We presented four very different situations of complex aerosol layering with fine and coarse particles. A key parameter in the retrieval of particle mass concentrations is the mass-specific extinction coefficient. Therefore, a review of the recent literature regarding specific extinction coefficients for 15
desert dust and volcanic dust was performed.
We found that the retrieval scheme works well as long as the relative humidity is <60 % and the water content of the coarse-mode particles is low. In contrast to Sa-haran dust, volcanic dust particles are hygroscopic. For relative humidities exceeding 80 % the retrieved mass concentrations must be handled with care. Uncertainties are 20
large due to the water-uptake effect and the associated wrong particle classification (fine versus coarse mode), and wrong assumptions in particle density, conversion fac-tors and other input parameters.
The measurements (case studies) showed that Saharan dust loads can be very high over Europe during Saharan dust outbreaks. Mass concentrations of up to 400– 25
500 µg m−3occurred in the free troposphere (between 1–6 km height) over Central
ACPD
12, 13363–13403, 2012Fine and coarse particle profiling
A. Ansmann et al.
Title Page
Abstract Introduction
Conclusions References
Tables Figures
◭ ◮
◭ ◮
Back Close
Full Screen / Esc
Printer-friendly Version
Interactive Discussion
Discussion
P
a
per
|
Dis
cussion
P
a
per
|
Discussion
P
a
per
|
Discussio
n
P
a
per
of Saharan dust over the western tropical Atlantic (Cape Verde). Extended, lofted aerosol layers consisting of mineral dust and biomass-burning particles with smoke mass concentrations of the order of 10–35 µg m−3 were observed over Cape Verde during SAMUM-2 in the winter of 2008.
Volcanic aerosol plumes originating from the Eyjafjallaj ¨okull eruptions in April 2010 5
and the Grimsv ¨otn eruptions observed over Leipzig in May 2011 were contrasted. A striking feature was that the volcanic dust was typically observed above the bound-ary layer at heights above 2 km in April 2010, while the Grimsv ¨otn aerosol was mainly transported in the well-mixed, moist boundary layer at heights below 2 km.
Based on the four case studies, the retrieval method was shown to be robust and 10
applicable to very different scenarios. The method strongly relies on accurate lidar observations of the particle depolarization ratio. We definitely need more high-quality depolarization observations for volcanic aerosols, such as they are already available for Saharan dust (Freudenthaler et al., 2009; Groß et al., 2011b) or for the Eyjafjallaj ¨okull volcanic dust (Ansmann et al., 2011b; Groß et al., 2012). In the case of the Grimsv ¨otn 15
aerosol, depolarization measurements in pure volcanic dust were not possible. Volcanic dust was always mixed with sulfate aerosol.
Acknowledgements. We would like to express our gratitude to the AERONET team for instru-ment calibration and data analysis. We are grateful to the IfT lidar team for establishing a rich data set of lidar observations.
20
References
Ansmann, A.: Ground-truth aerosol lidar observations: can the Klett solutions obtained from ground and space be equal for the same aerosol case?, Appl. Optics, 45, 3367–3371, 2006. 13374
Ansmann, A. and M ¨uller, D.: Lidar and atmospheric aerosol particles, in: LIDAR – Range-25
ACPD
12, 13363–13403, 2012Fine and coarse particle profiling
A. Ansmann et al.
Title Page
Abstract Introduction
Conclusions References
Tables Figures
◭ ◮
◭ ◮
Back Close
Full Screen / Esc
Printer-friendly Version
Interactive Discussion
Discussion
P
a
per
|
Dis
cussion
P
a
per
|
Discussion
P
a
per
|
Discussio
n
P
a
per
|
Ansmann, A., Althausen, D., Wandinger, U., Franke, K., M ¨uller, D., Wagner, F., and Heintzen-berg, J.: Vertical profiling of the Indian aerosol plume with six-wavelength lidar during IN-DOEX: a first case study, Geophys. Res. Lett., 27, 7, doi:10.1029/1999GL010902, 2000. 13368
Ansmann, A., B ¨osenberg, J., Chaikovsky, A., Comer ´on, A., Eckhardt, S., Eixmann, R., Freuden-5
thaler, V., Ginoux, P., Komguem, L., Linn ´e, H., L ´opez M ´arquez, M. A., Matthias, V., Mattis, I., Mitev, V., M ¨uller, D., Music, S., Nickovic, S., Pelon, J., Sauvage, L., Sobolewsky, P., Srivas-tava, M. K., Stohl, A., Torres, O., Vaughan, G., Wandinger, U., and Wiegner, M.: Long-range transport of Saharan dust to Northern Europe: the 11–16 October 2001 outbreak observed with EARLINET, J. Geophys. Res., 108, 4783, doi:10.1029/2003JD003757, 2003. 13366, 10
13370
Ansmann, A., Baars, H., Tesche, M., M ¨uller, D., Althausen, D., Engelmann, R., Paulique-vis, T., and Artaxo, P.: Dust and smoke transport from Africa to South America: lidar profiling over Cape Verde and the Amazon rainforest, Geophys. Res. Lett., 36, L11802, doi:10.1029/2009GL037923, 2009. 13375
15
Ansmann, A., Tesche, M., Groß, S., Freudenthaler, V., Seifert, P., Hiebsch, A., Schmidt, J., Wandinger, U., Mattis, I., M ¨uller, D., and Wiegner, M.: The 16 April 2010 major volcanic ash plume over Central Europe: EARLINET lidar and AERONET photome-ter observations at Leipzig and Munich, Germany, Geophys. Res. Lett., 37, L13810, doi:10.1029/2010GL043809, 2010. 13368, 13379, 13396
20
Ansmann, A., Petzold, A., Kandler, K., Tegen, I., Wendisch, M., M ¨uller, D., Weinzierl, B., M ¨uller, T., and Heintzenberg, J.: Saharan mineral dust experiments 1 and SAMUM-2: what have we learned?, Tellus B, 63, 403–429, doi:10.1111/j.1600-0889.2011.00555.x, 2011a. 13364, 13366, 13378, 13379
Ansmann, A., Tesche, M., Seifert, P., Groß, S., Freudenthaler, V., Apituley, A., Wilson, K. M., 25
Serikov, I., Linn ´e, H., Heinold, B., Hiebsch, A., Schnell, F., Schmidt, J., Mattis, I., Wandinger, U., and Wiegner, M.: Ash and fine-mode particle mass profiles from EARLINET-AERONET observations over Central Europe after the eruptions of the Eyjafjallaj ¨okull vol-cano in 2010, J. Geophys. Res., 116, D00U02, doi:10.1029/2010JD015567, 2011b. 13366, 13367, 13369, 13370, 13371, 13384, 13395, 13396, 13397, 13402
30
ACPD
12, 13363–13403, 2012Fine and coarse particle profiling
A. Ansmann et al.
Title Page
Abstract Introduction
Conclusions References
Tables Figures
◭ ◮
◭ ◮
Back Close
Full Screen / Esc
Printer-friendly Version
Interactive Discussion
Discussion
P
a
per
|
Dis
cussion
P
a
per
|
Discussion
P
a
per
|
Discussio
n
P
a
per
Barnaba, F. and Gobbi, G. P.: Aerosol seasonal variability over the Mediterranean region and relative impact of maritime, continental and Saharan dust particles over the basin from MODIS data in the year 2001, Atmos. Chem. Phys., 4, 2367–2391, doi:10.5194/acp-4-2367-2004, 2004. 13365, 13369, 13371, 13396, 13397
Ben-Ami, Y., Koren, I., and Altaratz, O.: Patterns of North African dust transport over the At-5
lantic: winter vs. summer, based on CALIPSO first year data, Atmos. Chem. Phys., 9, 7867– 7875, doi:10.5194/acp-9-7867-2009, 2009. 13375
Ben-Ami, Y., Koren, I., Rudich, Y., Artaxo, P., Martin, S. T., and Andreae, M. O.: Transport of North African dust from the Bod ´el ´e depression to the Amazon Basin: a case study, Atmos. Chem. Phys., 10, 7533–7544, doi:10.5194/acp-10-7533-2010, 2010. 13375
10
Bukowiecki, N., Zieger, P., Weingartner, E., Jur ´anyi, Z., Gysel, M., Neininger, B., Schneider, B., Hueglin, C., Ulrich, A., Wichser, A., Henne, S., Brunner, D., Kaegi, R., Schwikowski, M., Tobler, L., Wienhold, F. G., Engel, I., Buchmann, B., Peter, T., and Baltensperger, U.: Ground-based and airborne in-situ measurements of the Eyjafjallaj ¨okull volcanic aerosol plume in Switzerland in spring 2010, Atmos. Chem. Phys., 11, 10011–10030, doi:10.5194/acp-11-15
10011-2011, 2011. 13369
Chaikovsky, A., Dubovik, O., Goloub, P., Tanr ´e, D., Pappalardo, G., Wandinger, U., Chaikovskaja, L., Denisov, S., Grudo, Y., Lopatsin, A., Karol, Y., Lapyonok, T., Korol, M., Osipenko, F., Savitsky, D., Slesar, A., Apituley, A., Alados–Arboledas, L., Binietoglou, I., Comer ´on, A., Granados–Mu ˜noz, M. J., Papayanis, A., Perrone, M. R., Pietruczuk, A., De 20
Tomasi, F., Wagner, J., and Wang, X.: Algorithm and software for the retrieval of vertical aerosol properties using combined lidar/radiometer data: dissemination in EARLINET net-work, Proceedings, 26th International Laser Radar Conference, Porto Heli, Greece, 2012. 13364, 13365
Cozic, J., Verheggen, B., Weingartner, E., Crosier, J., Bower, K. N., Flynn, M., Coe, H., Hen-25
ning, S., Steinbacher, M., Henne, S., Collaud Coen, M., Petzold, A., and Baltensperger, U.: Chemical composition of free tropospheric aerosol for PM1 and coarse mode at the high alpine site Jungfraujoch, Atmos. Chem. Phys., 8, 407–423, doi:10.5194/acp-8-407-2008, 2008. 13369
Devenish, B. J., Thomson, D. J., Marenco, F., Leadbetter, S. J., Ricketts, H., and Dacre, H. F.: 30
ACPD
12, 13363–13403, 2012Fine and coarse particle profiling
A. Ansmann et al.
Title Page
Abstract Introduction
Conclusions References
Tables Figures
◭ ◮
◭ ◮
Back Close
Full Screen / Esc
Printer-friendly Version
Interactive Discussion
Discussion
P
a
per
|
Dis
cussion
P
a
per
|
Discussion
P
a
per
|
Discussio
n
P
a
per
|
Dubovik, O. and King, M.: A flexible inversion algorithm for retrieval of aerosol optical properties from sun and sky radiance measurements, J. Geophys. Res., 105, 20673–20696, 2000. 13366
Dubovik, O., Sinyuk, A., Lapyonok, T., Holben, B., Mishchenko, M., Yang, P., Eck, T., Volten, H., Mu ˜noz, O., Veihelmann, B., van der Zande, W. J., Leon, J. F., Sorokin, M., and Slutsker, I.: Ap-5
plication of spheroid models to account for aerosol particle non–sphericity in remote sensing of desert dust, J. Geophys. Res., 111, D11208, doi:10.1029/2005JD006619, 2006. 13366 Eck, T. F., Holben, B. N., Reid, J. S., Dubovik, O., Smirnov, A., O’Neill, N. T., Slutsker, I., and
Kinne, S.: Wavelength dependence of the optical depth of biomass burning, urban, and desert dust aerosols, J. Geophys. Res., 104, D24, doi:10.1029/1999JD900923, 1999. 10
Franke, K., Ansmann, A., M ¨uller, D., Althausen, D., Venkataraman, C., Reddy, M. S., Wagner, F., and Scheele, R.: Optical properties of the Indo-Asian haze layer over the tropical Indian Ocean, J. Geophys. Res., 108, 4059, doi:10.1029/2002JD002473, 2003. 13368
Freudenthaler, V., Esselborn, M., Wiegner, M., Heese, B., Tesche, M., Ansmann, A., M ¨uller, D., Althausen, D., Wirth, M., Fix, A., Ehret, G., Knippertz, P., Toledano, C., Gasteiger, J., 15
Garhammer, M., and Seefeldner, M.: Depolarization ratio profiling at several wavelengths in pure Saharan dust during SAMUM 2006, Tellus B, 61, 165–179. doi:10.1111/j.1600-0889.2008.00396.x, 2009. 13365, 13368, 13384, 13395
Gasteiger, J., Groß, S., Freudenthaler, V., and Wiegner, M.: Volcanic ash from Iceland over Munich: mass concentration retrieved from ground-based remote sensing measurements, 20
Atmos. Chem. Phys., 11, 2209–2223, doi:10.5194/acp-11-2209-2011, 2011. 13364, 13365, 13369, 13371, 13382, 13396
Groß, S., Gasteiger, J., Freudenthaler, V., Wiegner, M., Geiß, A., Schladitz, A., Toledano, C., Kandler, K., Tesche, M., Ansmann, A., and Wiedensohler, A.: Characterization of the plane-tary boundary layer during SAMUM-2 by means of lidar measurements, Tellus B, 63, 695– 25
705, doi:10.1111/j.1600-0889.2011.00557.x, 2011a. 13365, 13366, 13375, 13377, 13401 Groß, S., Tesche, M., Freudenthaler, V., Toledano, C., Wiegner, M., Ansmann, A., Althausen, D.,
and Seefeldner, M.: Characterization of Saharan dust, marine aerosols and mixtures of biomass-burning aerosols and dust by means of multi-wavelength depolarization and Ra-man lidar measurements during SAMUM 2, Tellus B, 63, 706–724, doi:10.1111/j.1600-30
ACPD
12, 13363–13403, 2012Fine and coarse particle profiling
A. Ansmann et al.
Title Page
Abstract Introduction
Conclusions References
Tables Figures
◭ ◮
◭ ◮
Back Close
Full Screen / Esc
Printer-friendly Version
Interactive Discussion
Discussion
P
a
per
|
Dis
cussion
P
a
per
|
Discussion
P
a
per
|
Discussio
n
P
a
per
Groß, S., Freudenthaler, V., Wiegner, M., Gasteiger, J., Geiß, A., and Schnell, F.: Dual-wavelength linear depolarization ratio of volcanic aerosols: lidar measurements of the Eyjafjallaj ¨okull plume over Maisach, Germany, Atmos. Environ., 48, 85–96, 2012. 13365, 13368, 13379, 13384
Hervo, M., Quennehen, B., Kristiansen, N. I., Boulon, J., Stohl, A., Fr ´eville, P., Pichon, J.-M., 5
Picard, D., Labazuy, P., Gouhier, M., Roger, J.-C., Colomb, A., Schwarzenboeck, A., and Sellegri, K.: Physical and optical properties of 2010 Eyjafjallaj ¨okull volcanic eruption aerosol: ground-based, Lidar and airborne measurements in France, Atmos. Chem. Phys., 12, 1721– 1736, doi:10.5194/acp-12-1721-2012, 2012. 13371, 13396
Hess, M., Koepke, P., and Schult, I.: Optical properties of aerosols and clouds: the software 10
package OPAC, B. Am. Meteorol. Soc, 79, 831–844, 1998. 13369, 13396, 13397
Johnson, B. and Osborne, S. R.: Physical and optical properties of mineral dust aerosol mea-sured by aircraft during the GERBILS campaign, Q. J. Roy. Meteor. Soc., 137, 1117–1130, 2011. 13397
Johnson, B. T. T., Turnbull, K. F., Brown, P. R., Burgess, R., Dorsey, J. R., Baran, A. J., Web-15
ster, H. N., Haywood, J. M., Cotton, R., Ulanowski, J., Hesse, E., Woolley, A. M., and Rosen-berg, P.: In-situ observations of volcanic ash clouds from the FAAM aircraft during the erup-tion of Eyjafjallaj ¨okull in 2010, J. Geophys. Res., 117, D00U24, doi:10.1029/2011JD016760, 2012. 13371, 13396
Kandler, K., Sch ¨utz, L., Deutscher, C., Ebert, M., Hofmann, H., J ¨ackel, S., Jaenicke, R., Knip-20
pertz, P., Lieke, K., Massling, A., Petzold, A., Schladitz, A., Weinzierl, B., Wiedensohler, A., Zorn, S., and Weinbruch, S.: Size distribution, mass concentration, chemical and mineralog-ical composition and derived optmineralog-ical parameters of the boundary layer aerosol at Tinfou, Morocco, during SAMUM 2006, Tellus B, 61, 32–50, doi:10.1111/j.1600-0889.2008.00385.x, 2009. 13370
25
Kandler, K., Sch ¨utz, L., J ¨ackel, S., Lieke, K., Emmel, C., M ¨uller–Ebert, D., Ebert, M., Scheuvens, D., Schladitz, A., Segvic, B., Wiedensohler, A., and Weinbruch, S.: Ground-based off-line aerosol measurements at Praia, Cape Verde, during the Saharan Min-eral Dust Experiment: microphysical properties and minMin-eralogy, Tellus B, 63, 459–474. doi:10.1111/j.1600-0889.2011.00546.x, 2011. 13370
30