ACPD
15, 19325–19366, 2015Lidar measurements of aged Saharan dust
at Barbados
S. Groß et al.
Title Page
Abstract Introduction
Conclusions References
Tables Figures
◭ ◮
◭ ◮
Back Close
Full Screen / Esc
Printer-friendly Version Interactive Discussion
Discussion
P
a
per
|
Discussion
P
a
per
|
Discussion
P
a
per
|
Discussion
P
a
per
|
Atmos. Chem. Phys. Discuss., 15, 19325–19366, 2015 www.atmos-chem-phys-discuss.net/15/19325/2015/ doi:10.5194/acpd-15-19325-2015
© Author(s) 2015. CC Attribution 3.0 License.
This discussion paper is/has been under review for the journal Atmospheric Chemistry and Physics (ACP). Please refer to the corresponding final paper in ACP if available.
Characterization of long-range
transported Saharan dust at the
Caribbean by dual-wavelength
depolarization Raman lidar
measurements
S. Groß1, V. Freudenthaler2, K. Schepanski4, C. Toledano3, A. Schäfler1, A. Ansmann4, and B. Weinzierl1,2
1
Deutsches Zentrum für Luft- und Raumfahrt (DLR), Institut für Physik der Atmosphäre, Oberpfaffenhofen, Germany
2
Ludwig-Maximilians-Universität, Meteorologisches Institut, München, Germany
3
Universitat de Vailladolid, Grupo de Óptica Atmosférica, Vailladolid, Spain
4
Leibniz-Institut für Troposphärenforschung (TROPOS), Leipzig, Germany
Received: 17 June 2015 – Accepted: 23 June 2015 – Published: 15 July 2015 Correspondence to: S. Groß (silke.gross@dlr.de)
ACPD
15, 19325–19366, 2015Lidar measurements of aged Saharan dust
at Barbados
S. Groß et al.
Title Page
Abstract Introduction
Conclusions References
Tables Figures
◭ ◮
◭ ◮
Back Close
Full Screen / Esc
Printer-friendly Version Interactive Discussion
Discussion
P
a
per
|
Discussion
P
a
per
|
Discussion
P
a
per
|
Discussion
P
a
per
|
Abstract
Dual-wavelength Raman and depolarization lidar observations were performed during the SALTRACE campaign at Barbados in June and July 2013 to characterize the op-tical properties and verop-tical distribution of long-range transported Saharan dust at the end of its way across the Atlantic Ocean. Four major dust events were studied during
5
the measurements from 15 June to 13 July 2013 with aerosol optical depths of up to 0.6. The vertical aerosol distribution was characterized by a three-layer structure con-sisting of the boundary layer, the entrainment or mixing layer, and the pure Saharan dust layer. The upper boundary of the pure dust layer reached up to 4.5 km height. The contribution of the pure dust layer was about half of the total AOD. The total dust
con-10
tribution was about 50–70 % of the total AOD. The lidar ratio within the pure dust layer was found to be wavelength independent with mean values of 53±5 sr at 355 nm and
56±7 sr at 532 nm. For the particle linear depolarization ratio wavelength independent
mean values of 0.26±0.03 at 355 nm and 0.27±0.01 at 532 nm have been found.
1 Introduction 15
Aerosol particles play a key role in the Earth’s climate system and affect the Earth’s radiation budget in two different ways; directly by interacting with solar and terrestrial radiation (scattering and absorption) and indirectly by acting as cloud condensation nu-clei and therewith influencing the clouds microphysical and optical properties and the clouds lifetime. Up to now the impact of aerosols on the global climate system is not
20
fully understood (Forster et al., 2007; Penner et al., 2011; Boucher et al., 2013). One main reason is the strong variability of aerosols. The sign and the magnitude of the radiative forcing crucially depends on the vertical distribution of aerosols, their micro-physical properties and chemical composition, the reflectance of the underlying surface and the occurrence and amount of clouds (Forster et al., 2007). However, knowledge
25
ACPD
15, 19325–19366, 2015Lidar measurements of aged Saharan dust
at Barbados
S. Groß et al.
Title Page
Abstract Introduction
Conclusions References
Tables Figures
◭ ◮
◭ ◮
Back Close
Full Screen / Esc
Printer-friendly Version Interactive Discussion
Discussion
P
a
per
|
Discussion
P
a
per
|
Discussion
P
a
per
|
Discussion
P
a
per
|
et al., 2001; IPCC, 2013). Additionally, significant sources of uncertainty result from deficits of satellite-based measurements in the determination of global mean AOD (Su et al., 2013), and from the insufficient knowledge of the impact of mixing, aging pro-cesses and transport on the aerosol optical and microphysical properties.
Active remote sensing measurements with lidar systems, provide height resolved
in-5
formation about the distribution of aerosols, and is thus an appropriate tool to study aerosols. Advanced lidar systems like Raman lidar systems (Ansmann et al., 1990, 1992) or high spectral resolution lidar (HSRL) systems (Hair et al., 2008; Esselborn et al., 2008) with polarization sensitive channels (Freudenthaler et al., 2009) provide information about the optical properties of aerosol layers. Spaceborne lidar
measure-10
ments are an excellent tool to examine the global vertical distribution of aerosols. The current lidar systems applied in space are elastic backscatter lidar systems which have only limited capability to distinguish different types of aerosols. In contrast, on the fu-ture ESA satellite mission EarthCARE a polarization sensitive HSRL system will be deployed, having the potential to classify different aerosol types (Burton et al., 2012;
15
Groß et al., 2013, 2015). However, current classification schemes for EarthCARE lidar measurements are mainly based on measurements of pure and fresh aerosol types (Groß et al., 2011a, 2014; Illingworth et al., 2014). But as the optical properties are related to the microphysical properties like particle size, particle shape and chemical composition (Gasteiger et al., 2011b, a), aerosol aging, mixing and modification during
20
transport can have an impact on the lidar derived optical properties, as well as on their wavelength dependence. For example, for measurements of the lidar ratio over Greece Amiridis et al. (2009) found that both, the value and the wavelength dependence of the lidar ratio of biomass burning aerosols may change with aerosol lifetime. Thus, possible changes of the lidar derived optical properties have to be investigated and considered
25
for proper aerosol classification.
ACPD
15, 19325–19366, 2015Lidar measurements of aged Saharan dust
at Barbados
S. Groß et al.
Title Page
Abstract Introduction
Conclusions References
Tables Figures
◭ ◮
◭ ◮
Back Close
Full Screen / Esc
Printer-friendly Version Interactive Discussion
Discussion
P
a
per
|
Discussion
P
a
per
|
Discussion
P
a
per
|
Discussion
P
a
per
|
et al., 2011). Once lifted in the air, mineral dust can be transported over thousands of kilometers (Goudie and Middleton, 2001; Liu et al., 2008) exposed to the effects of aging and mixing. These effects change the optical, microphysical and cloud conden-sation properties. Coatings on mineral dust particles and mixing with other aerosols change the optical properties (Nousiainen, 2009; Redmond et al., 2010) and thus alter
5
their radiative impact (Bauer et al., 2007). For example, biomass burning aerosols and mineral dust may become internally mixed when aging together (Hand et al., 2010) and thus change their size distribution, optical properties, hygroscopicity and their ability to act as cloud condensation nuclei (Wex et al., 2010). From measurements close to the dust source regions in comparisons to measurements in dust plumes over Cape Verde
10
Weinzierl et al. (2011) found an indication of sedimentation of large particles in Saha-ran dust plumes during tSaha-ransport although sedimentation of large super-micron dust particles was less pronounced than expected from Stokes gravitational settling. Yang et al. (2013) assume a shape-induced particle sedimentation from measurements of transported dust with the space-based lidar system onboard the Cloud-aerosol Lidar
15
with Orthogonal Polarization (CaLIOP) satellite mission (Winker et al., 2009). Wieg-ner et al. (2011) found an increase of the mean particle linear depolarization ratio at 355 nm of an aged Saharan dust plume over Central Europe compared to values mea-sured in fresh Saharan dust plumes (Freudenthaler et al., 2009; Groß et al., 2011b). Up to now the mechanism and magnitude of dust aging is unknown, and whether and
20
how it influences the optical properties of dust.
In this work we present dual-wavelength Raman and depolarization lidar measure-ments of long-range transported Saharan dust over Barbados. Our study includes the general aerosol situation during our measurement period as well as the characteriza-tion of the Saharan dust layer and marine boundary layer by means of the lidar ratio
25
ACPD
15, 19325–19366, 2015Lidar measurements of aged Saharan dust
at Barbados
S. Groß et al.
Title Page
Abstract Introduction
Conclusions References
Tables Figures
◭ ◮
◭ ◮
Back Close
Full Screen / Esc
Printer-friendly Version Interactive Discussion
Discussion
P
a
per
|
Discussion
P
a
per
|
Discussion
P
a
per
|
Discussion
P
a
per
|
campaign, our lidar measurements and data analysis is given is Sect. 2. The results are presented in Sect. 3, and discussed in Sect. 4. Section 5 summarizes this work.
2 Measurements and instrumentation
2.1 SALTRACE
In June and July 2013 the Saharan Aerosol Long-range Transport and Aerosol-Cloud
5
interaction Experiment (SALTRACE, http://www.pa.op.dlr.de/saltrace/index.html) took place. SALTRACE was designed as a closure experiment combining ground-based lidar, in-situ and sun photometer instruments, with airborne aerosol and wind lidar measurements of the research aircraft Falcon of the Deutsches Zentrum für Luft- und Raumfahrt (DLR), satellite observations and model simulations. The main ground-site
10
during SALTRACE was on Barbados where lidar measurements were performed. Bar-bados is an optimal location to characterize long-range transported dust at the end of its way across the Atlantic Ocean. In addition, the 50 year Barbados dust record (Prospero et al., 1970) provides long-term information on year to year variability of trans-Atlantic dust transport to the Caribbean. The SALTRACE project continues the
15
work started with the SAMUM-1 and SAMUM-2 (Ansmann et al., 2011) which aimed for characterizing Saharan mineral dust in the source regions and at different stages of dust lifetime. During SALTRACE particular focus was drawn on aerosol aging and mixing, and on aerosol removal processes. Therefore the physical, chemical and op-tical properties of the long-range transported Saharan dust layers were characterized
20
in-depth to study the impact of long-range transported dust on the Earths radiation budget, clouds and precipitation. During SALTRACE, ground-based measurements at Barbados were performed at two main locations: ground-based in-situ measurements were made at the very eastern edge of the island at Ragged Point, whereas the lidar measurements were carried out at the Caribbean Institute of Meteorology and
Hydrol-25
photome-ACPD
15, 19325–19366, 2015Lidar measurements of aged Saharan dust
at Barbados
S. Groß et al.
Title Page
Abstract Introduction
Conclusions References
Tables Figures
◭ ◮
◭ ◮
Back Close
Full Screen / Esc
Printer-friendly Version Interactive Discussion
Discussion
P
a
per
|
Discussion
P
a
per
|
Discussion
P
a
per
|
Discussion
P
a
per
|
ter measurements were performed at both measurement sites. For this study we use the AERONET CIMEL (Holben et al., 1998) measurements “Barbados_SALTRACE” performed at CIMH. SALTRACE measurements were carried out between 10 June and 15 July with the main closure experiments taking place between 20 June to 12 July 2013.
5
2.2 POLIS lidar system
In this work we present measurements of the small portable Raman and depolariza-tion lidar system POLIS (Fig. 1) of the Meteorological Institute (MIM) of the Ludwig-Maximilians-Universität (LMU) München. POLIS is a 6-channel lidar system measuring the N2-Raman shifted wavelengths at 387 and 607 nm and the elastic backscattered
10
signals (cross- and parallel-polarized) at 355 and 532 nm with high accuracy (Freuden-thaler et al., 2015). Thus profiles of the particle extinction coefficientαpand backscatter
coefficientβp, of the lidar ratioSp, and of the volume and particle linear depolarization
ratioδv and δp at 355 and 532 nm can be retrieved. The full overlap of POLIS is at about 200 to 250 m depending on system settings. The range resolution of the raw
15
data is 3.75 m; the temporal resolution is 5–10 s depending on atmospheric conditions. The repetition rate of the frequency doubled and tripled Nd:YAG laser is 10 Hz with a pulse energy of 50 mJ at 355 nm and 27 mJ at 532 nm.
2.3 Data evaluation
The particle extinction coefficient αp is retrieved from the Raman signals at 387 and
20
607 nm (Ansmann et al., 1990), the particle backscatter coefficient βp is derived from combined Raman and elastically backscattered lidar returns at 355/387 and 532/607 nm (Ansmann et al., 1992). The height dependent lidar ratioSp=αp/βpcan
be derived from the ratio of both properties. Due to the low signal-to-noise ratio of the Raman channels, these measurements were restricted to night-time only. Furthermore,
25
ACPD
15, 19325–19366, 2015Lidar measurements of aged Saharan dust
at Barbados
S. Groß et al.
Title Page
Abstract Introduction
Conclusions References
Tables Figures
◭ ◮
◭ ◮
Back Close
Full Screen / Esc
Printer-friendly Version Interactive Discussion
Discussion
P
a
per
|
Discussion
P
a
per
|
Discussion
P
a
per
|
Discussion
P
a
per
|
a sufficient signal-to-noise ratio. The temporal stability of the atmosphere within this time period has been validated by comparing the consecutive profiles of the range cor-rected signal Pr2over the whole smoothing period. A typical vertical smoothing of 250 rangebins (≈940 m) is applied to further increase the signal-to-noise ratio. The errors
of the retrieved optical properties are calculated according to Groß et al. (2011c).
5
From the co- and cross-polarized elastically backscattered signals the volume lin-ear depolarization ratioδv and the particle linear depolarization ratio δp (Biele et al., 2000; Freudenthaler et al., 2009) are derived. The relative calibration factor of both po-larization channels was determined with the highly accurate ±45◦ calibration method
(Freudenthaler et al., 2009) by manually rotating the receiver optics behind the
tele-10
scope. Although the signal-to-noise ratio of the elastic channels is much better than for the Raman channels the same temporal average was used for the analysis of the night-time Raman and depolarization measurements to get comparable results. The vertical average of the elastic signals is typically 150 rangebins (≈550 m), otherwise the
ver-tical smoothing length is specified in the text. Details of the depolarization calibration
15
and system performance can be found by Freudenthaler et al. (2009, 2015). The error calculation ofδvandδpwas done analogue to Freudenthaler et al. (2009).
To determine the dust contribution within the boundary layer and the intermediate layer, we determined the profile of the dust backscatter coefficient applying a proce-dure described by Tesche et al. (2009a) and Groß et al. (2011a) assuming a two-type
20
mixture of dust and marine aerosols. The linear depolarization ratios used as input for the aerosol type separation are set toδd=0.30 at 532 nm for dust andδnd=0.02 for
marine aerosols according to the findings for pure Saharan dust and marine aerosols (Freudenthaler et al., 2009; Groß et al., 2011b). The dust extinction coefficient is de-rived following the equationαd=βd·Sd. The lidar ratio of dust (Sd=55 sr) is taken from
25
Tesche et al. (2009b) and is in good agreement with the meanSp values we find for
ACPD
15, 19325–19366, 2015Lidar measurements of aged Saharan dust
at Barbados
S. Groß et al.
Title Page
Abstract Introduction
Conclusions References
Tables Figures
◭ ◮
◭ ◮
Back Close
Full Screen / Esc
Printer-friendly Version Interactive Discussion
Discussion
P
a
per
|
Discussion
P
a
per
|
Discussion
P
a
per
|
Discussion
P
a
per
|
3 Results
3.1 General overview
During SALTRACE we observed a sequence of dust events with Saharan air masses being transported with easterly winds over the Atlantic to Barbados. The dust episodes often lasted for several days and provided, apart from shallow cumulus clouds, optimal
5
measurement conditions in the dry and aerosol rich air. The dust events were inter-rupted by wet periods with strong convective activity and precipitation. Here we focus on the analysis of four major dust events.
The aerosol optical depth (AOD) during these major dust events reached values of up to 0.55. The corresponding Angström Exponent (AE) showed very low values of
10
0.2 and lower. The overall aerosol situation was characterized by a three layer struc-ture (Fig. 2). The boundary layer up to 0.5 to 1.0 km was mostly dominated by marine aerosols, except during the first and last measurement days. At heights from about 1.0 to 2.0 km the aerosol layer was composed of a mixture of predominantly dust and marine aerosols. This layer showed high variability with respect to aerosol load and
15
mixture. During SALTRACE almost all cloud processes in the lower troposphere took place within this layer. Above this intermediate layer a Saharan dust layer was present almost permanently during our measurement period, except on 8 and 9 July when Trop-ical Storm “Chantal” dominated the weather situation. During the main Saharan dust events this uppermost dust layer showed AOD values of about 0.2, in some cases the
20
AOD even reached values of more than 0.3. The contribution of this pure Saharan dust layer to the total AOD usually ranged between 30 and 60 %, in some cases up to 80 % of the total AOD. The total contribution of Saharan dust to the total AOD was 50–80 %, except during Tropical Storm Chantal, when the Saharan dust contribution to the total AOD was only 20 %. Dust was mainly found in the pure dust layer and the intermediate
25
ACPD
15, 19325–19366, 2015Lidar measurements of aged Saharan dust
at Barbados
S. Groß et al.
Title Page
Abstract Introduction
Conclusions References
Tables Figures
◭ ◮
◭ ◮
Back Close
Full Screen / Esc
Printer-friendly Version Interactive Discussion
Discussion
P
a
per
|
Discussion
P
a
per
|
Discussion
P
a
per
|
Discussion
P
a
per
|
3.2 Case studies
We present four case studies, which are representative for the four dust events that occurred during the core period of SALTRACE. The date and time of the chosen case studies are 20 June (23:00–24:00 UTC), 27 June (00:00–02:00 UTC), 1 July (07:00– 09:00 UTC), and 11 July 2013 (23:00–24:00 UTC). One main topic of our analysis is to
5
investigate whether the different dust events show a variability in the retrieved optical properties. Figure 3 shows a back-trajectory analysis for the four selected case studies. The trajectories were calculated with the Hybrid Single Particle Lagrangian Integrated Trajectory (HYSPLIT) model (Draxler and Rolph, 2012) and the NCEP Global Data Assimilation System (GDAS) meteorological data. Start time and height of the
trajec-10
tories were chosen according to the analyzed lidar measurement time periods and the height ranges of the presumed dust layer. The duration of all backward trajectories is 312 h. All trajectories show an advection from easterly directions and source regions located inside the Sahara region. However, the specific flow patterns of the air masses of the different events are quite different as well as possible source regions within the
15
Saharan desert.
Different dust source activity over North Africa and thus different source region con-tributing to the dust plume observed at Barbados are identified from infra-red (IR) dust index images calculated from Meteosat Second Generation (MSG) Spinning Enhanced Visible and Infra-Red Imager (SEVIRI) observations (Fig. 4). As described in detail in
20
Schepanski et al. (2007), active dust sources are identified and recorded on a 1◦×1◦
map covering Africa north of 10◦N. For the four case studies (20 and 27 June, 1 and 11 July 2013), different dust source regions are found to be active. A brief overview on the dust contributing source regions and the meteorological regime resulting into dust uplift will be given in the following. HYSPLIT back-trajectories are analyzed to identify
25
ACPD
15, 19325–19366, 2015Lidar measurements of aged Saharan dust
at Barbados
S. Groß et al.
Title Page
Abstract Introduction
Conclusions References
Tables Figures
◭ ◮
◭ ◮
Back Close
Full Screen / Esc
Printer-friendly Version Interactive Discussion
Discussion
P
a
per
|
Discussion
P
a
per
|
Discussion
P
a
per
|
Discussion
P
a
per
|
dusty trade wind over West Africa). The latter two July-cases (1 and 11 July) show an increase in deep convective activity and Haboobs (heavy dust storm) become a more frequent dust uplift mechanism compared to the June-cases.
3.2.1 20 June 2013; 23:30–24:00 UTC
Already during the first measurement period of the SALTRACE campaign we were able
5
to observe a strong Saharan dust event with total AOD of up to 0.55. Dust sources con-tributing to the dusty air mass reaching Barbados on 20 June 2013 were active during 11 to 13 June 2013. On 11 June 2013, strong Harmattan winds and embedded noctur-nal low-level jet (LLJ) forced dust uplift over the Adra and southeastern Hoggar region (NE Mali and SW Algeria). Entrained into the northeasterly Harmattan flow, dusty air
10
is transported towards the tropical North Atlantic. On 12 June 2013, dust emitted by strong Harmattan winds from the Niger flood plains south of Timbuktu (Mali) were up-taken by an air mass crossing the Atlantic and reaching Barbados on 20 June 2013.
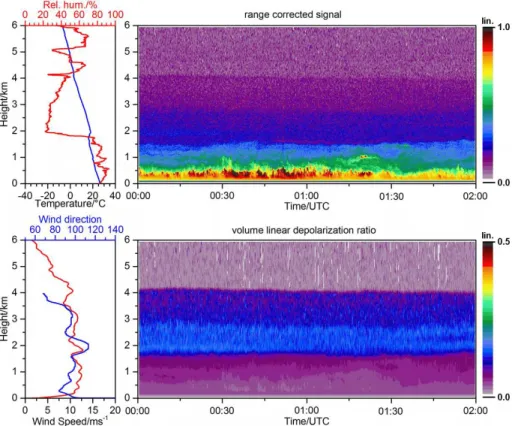
Figure 5 gives an overview of the measurement situation in the night from 20 to 21 June 2013 when the Saharan dust layer slowly faded away. The Saharan dust layer can
15
be clearly identified by enhancedδvof about 0.15 in heights from 1.5 to 3 km. A clear
signature to distinguish the dust layer from the mixing layer at about 0.8–1.5 km with rather similar values of the range corrected signal but lowerδvvalues. In the lowermost
0.8 km the range corrected signal shows high values with lowδv, which is an indication
for a marine dominated boundary layer. In the height level of the Saharan Air Layer
20
(SAL), the relative humidity is low (notice that lidar measurements and radiosonde measurements have an offset of about 2 h in this case study) and the air masses were transported from mainly north-easterly directions. In the lowermost height level the relative humidity shows values between 60–80 %. For the analysis of the vertical distri-bution of the extinction coefficient, the lidar ratio and the particle linear depolarization
25
ACPD
15, 19325–19366, 2015Lidar measurements of aged Saharan dust
at Barbados
S. Groß et al.
Title Page
Abstract Introduction
Conclusions References
Tables Figures
◭ ◮
◭ ◮
Back Close
Full Screen / Esc
Printer-friendly Version Interactive Discussion
Discussion
P
a
per
|
Discussion
P
a
per
|
Discussion
P
a
per
|
Discussion
P
a
per
|
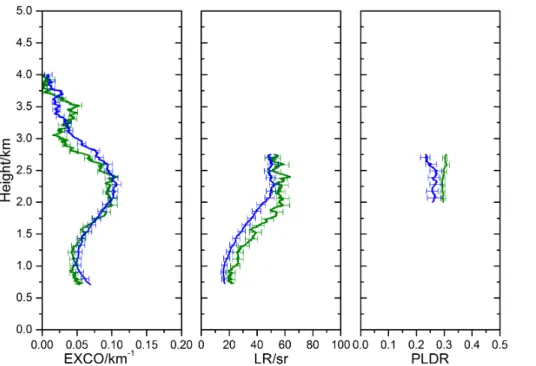
between 1.5 and 3.0 km with max.αp of about 0.12 km− 1
. MeanSp values in the dust
layer are 56±5 sr at 532 nm and 50±4 sr at 355 nm. In the marine boundary layer mean Spvalues of 21±3 sr at 532 nm, and 17±2 sr at 355 nm are found with corresponding
wavelength independent meanδpvalues of≈0.02. In the dust layerδpshows a slight
wavelength dependence with mean values of 0.3 at 532 nm and 0.26 at 355 nm.
5
3.2.2 27 June 2013; 00:00–02:00 UTC
Air masses being over the North African continent at boundary layer heights (up to 3–5 km) and thus able to uptake dust during 20 to 22 June 2013 are likely to contribute to the dust layer observed over Barbados on 27 June 2013. On 20 June, dust source embedded in desert valleys scattered over the three mountain regions Hoggar, Aïr and
10
Adrar were activated during the morning hours by nocturnal LLJs embedded in the Harmattan flow. The dusty air mass slowly propagated westward. On 21 June 2013, further dust emitted from dust sources over the Adrar Mountains (East Mali) and South-east Mauritania was contributing.
Figure 7 gives an overview of the night-time measurements situation on 27
15
June 2013 over Barbados. The total AOD was as high as 0.4. The range corrected signal shows aerosol signature up to about 4 km, whereas the highest signals are ob-served in the lowermost aerosol layer up to about 0.6 km.δvshows high values of 0.15
in the height range between 1.5 and 4 km clearly identifying the SAL. As observed during the case study of 20 June (23:30–24:00 UTC) the relative humidity in the SAL
20
is low with values <40 % and the temperature profile shows a weak inversion at the lower edge of the SAL. The dusty air masses arrived from mainly easterly directions. Within the SAL αp was about 0.08 km−
1
and decreased at heights above ≈3.5 km. Spin the SAL shows mean values of 56±5 sr at 532 nm and 55±7 sr at 355 nm, the
correspondingδpshows wavelength independent values of 0.26±0.01 at 532 nm and
25
ACPD
15, 19325–19366, 2015Lidar measurements of aged Saharan dust
at Barbados
S. Groß et al.
Title Page
Abstract Introduction
Conclusions References
Tables Figures
◭ ◮
◭ ◮
Back Close
Full Screen / Esc
Printer-friendly Version Interactive Discussion
Discussion
P
a
per
|
Discussion
P
a
per
|
Discussion
P
a
per
|
Discussion
P
a
per
|
at 532 nm and 17±2 sr at 355 nm are observed. The meanδpvalues in the boundary
layer are 0.06±0.01 at 532 nm and 0.04±0.01 at 355 nm.
3.2.3 1 July 2013; 07:00–08:45 UTC
On 1 July a total AOD of about 0.55 was observed over Barbados. Back-trajectories show that Saharan air masses arriving Barbados on 1 July 2013 remained over West
5
Africa for quite some time during the 19 and 25 June before entering the tropical North Atlantic. During these days, frequently active dust source regions were located embed-ded in the desert valley of the Adra Mountains, but also in central Mali where sand sheets and ancient drainage systems characterize the landscape. Dust sources were activated by both, nocturnal LLJ embedded in the Harmattan flow resulting to morning
10
on-set of dust emission and dust fronts (Haboobs) related to downdrafts generated by MCSs (Meso-scale Convective System) during the late afternoon and night.
The measurement situation on 1 July (07:00–09:45 UTC) was similar to those during the prior events (Fig. 9). Within the SAL, characterized byδvvalues of about 0.15, the
relative humidity is<40 %, whereas the boundary layer shows large RH values of up to
15
80 %. The wind direction within the aerosol layers was mainly easterly. Inside the SAL
αpvalues of about 0.75 km− 1
are observed (Fig. 10). In the boundary layerαpincreases
to values of about 0.13 km−1
.Spin the dust layer is wavelength independent with mean
values of 54±7 sr at 532 nm and 53±6 sr at 355 nm.δp shows mean values of 0.27
at both wavelengths. In the boundary layer meanSpvalues of 30±4 sr at 532 nm and
20
25±2 sr at 355 nm are found. Meanδpvalues are 0.06±0.01 at 532 nm and 0.04±0.01
at 355 nm.
3.2.4 11 July 2013; 23:00–24:00 UTC
The last dust event we observed during SALTRACE started after the passage of Tropi-cal Storm “Chantal” on 09 July 2013 and lasted until the end of our measurements on
25
ACPD
15, 19325–19366, 2015Lidar measurements of aged Saharan dust
at Barbados
S. Groß et al.
Title Page
Abstract Introduction
Conclusions References
Tables Figures
◭ ◮
◭ ◮
Back Close
Full Screen / Esc
Printer-friendly Version Interactive Discussion
Discussion
P
a
per
|
Discussion
P
a
per
|
Discussion
P
a
per
|
Discussion
P
a
per
|
previous cases, the atmospheric humidity over North Africa has increased and deep convective clouds form in particular over orographic regions over the Sahara. The con-vective clouds grow to MCS, which generate Haboobs in particular over West Africa. Contributing dust originating from source over the southwest flanks of the Hoggar Mas-sif were emitted by in the Harmattan flow embedded LLJs.
5
The top of the SAL observed over Barbados was at about 4.8 km height. Figure 11 gives an overview of the night measurements from 10 to 11 July (00:00–01:00 UTC). High intensity of the range corrected signal was found in the boundary layer below about 0.5 km. The lowest signal intensity was found above about 3.0 km. Howeverδv
values of 0.15–0.18 clearly identify the dust layer from 1.5 up to about 4.8 km. The air
10
masses arrived from north-easterly directions, and the SAL is characterized by very low wind speed (except for the uppermost 0.5 km). Within the SAL the relative humidity shows again low values of<40 % while it jumps to values of about 80 % in the boundary layer. αp is about 0.1 wavelength independent in the SAL and shows even slightly
higher values in the lowermost 1.5 km (Fig. 12). MeanSpvalues of 56±4 sr at 532 nm
15
an 50±4 sr at 355 nm are found in the SAL with wavelength independentδpof 0.27±
0.01 and 0.26±0.02 at 532 and 355 nm. In the boundary layer we find wavelength
independent mean Sp values of 35 sr with corresponding δp of 0.1±0.01 at 532 nm
and 0.14±0.01 at 355 nm, indicating a certain amount of dust mixed into the boundary
layer.
20
The main findings of the four case studies are summarized in Table 1.
3.3 General findings
The mean values ofSpandδpwithin the SAL and within the boundary layer are shown
in Fig. 13 and summarized in Table 2. The meanSpvalues in the SAL range between 49
and 60 sr at 532 nm and between 47 and 63 sr at 355 nm. The overall meanSpvalues
25
for long-range transported Saharan dust, considering all analyzed data, are 56±7 sr
and 53±5 sr at 532 and 355 nm. δp values in the SAL range between 0.26 and 0.3
ACPD
15, 19325–19366, 2015Lidar measurements of aged Saharan dust
at Barbados
S. Groß et al.
Title Page
Abstract Introduction
Conclusions References
Tables Figures
◭ ◮
◭ ◮
Back Close
Full Screen / Esc
Printer-friendly Version Interactive Discussion
Discussion
P
a
per
|
Discussion
P
a
per
|
Discussion
P
a
per
|
Discussion
P
a
per
|
0.27±0.01 at 532 nm and 0.26±0.03 at 355 nm. However, during the first Saharan dust
eventδpshows a slight but significant wavelength dependence with layer mean values
ofδp=0.3±0.01 at 532 nm and δp=0.26±0.02 at 355 nm. Analysis of the
remain-ing SALTRACE measurements show comparatively lower mean values at 532 nm with almost constant mean values at 355 nm.
5
The boundary layer during SALTRACE was dominated by marine aerosols, with a contribution of various amounts of dust, especially during the last observed Saharan dust event. The meanSpvalues range between 21 and 36 sr at 532 nm and between
16 and 35 sr at 355 nm. The overall meanSp shows a wavelength independent value
of 26 sr. Highest Sp values are found during the last observed dust event, indicating
10
an increased amount of dust mixed into the boundary layer. This is in good agreement with the meanδp values of>0.1 in the boundary layer during the last observed dust
event, clearly identifying dust mixed in the boundary layer (Tesche et al., 2009b; Groß et al., 2011a). During days when marine aerosols were the dominant type in the bound-ary layerδpis low with mean values between 0.01 and 0.04 at both wavelengths. The
15
overall meanδpvalues areδp=0.05±0.01 at 532 nm andδp=0.04±0.01 at 355 nm.
4 Discussion
4.1 Comparison to former dust measurements
The lidar measurements performed at Barbados during SALTRACE and presented in this work give us the opportunity to compare the intensive lidar properties (e.g. the
20
lidar ratio and the particle linear depolarization ratio) of Saharan dust derived close to the source region in Quarzazate, Morocco, during SAMUM-1 (Freudenthaler et al., 2009) with measurements of mid-range transported Saharan dust at Cape Verde dur-ing SAMUM-2 (Groß et al., 2011b) and of long-range transported Saharan dust over the Atlantic Ocean. From these studies possible changes due to transport and aging can
25
ACPD
15, 19325–19366, 2015Lidar measurements of aged Saharan dust
at Barbados
S. Groß et al.
Title Page
Abstract Introduction
Conclusions References
Tables Figures
◭ ◮
◭ ◮
Back Close
Full Screen / Esc
Printer-friendly Version Interactive Discussion
Discussion
P
a
per
|
Discussion
P
a
per
|
Discussion
P
a
per
|
Discussion
P
a
per
|
over Central Europe (Wiegner et al., 2011) furthermore enable to investigate whether not only the transport time but also the transport path has an effect of particle aging.
An overview of δp measurements at 355 and 532 nm is given in Fig. 14. For each
measurement campaign a number of days (4, 8, 3, 13) is included in this study. The main findings are: δp and its wavelength dependence does not change for
measure-5
ments of fresh Saharan dust at Morocco, close to the source regions, and for dust mid-range transported at Cape Verde. The wavelength dependent overall mean values are 0.31±0.01 (532 nm) and 0.25±0.07 (355 nm) for fresh Saharan dust (Freudenthaler
et al., 2009) and 0.3±0.01 (532 nm) and 0.25±0.03 (355 nm) for mid-range transported
Saharan dust (Groß et al., 2011b). For long-range transported Saharan dust towards
10
Central Europe we found slightly higher values of 0.34±0.02 and 0.30±0.05 at 532
and 355 nm, respectively (Wiegner et al., 2011). At Barbados we find a slightly lower meanδpvalue of 0.27±0.01 at 532 nm and a rather constant mean value of 0.26±0.03
at 355 nm. The observed differences betweenδpfor long-range transported dust
com-pared to the values for pure and mid-range transproted dust are small. However, we see
15
different alterations of the optical properties of long-range transported Saharan dust towards Central Europe and of long-range transported Saharan dust over the Atlantic Ocean towards the Caribbean. We do not longer see a wavelength dependence for
δpat 355 and 532 nm for long-range transported Saharan dust towards the Caribbean
within the uncertainty range. Furthermore, the differences of δp for long-range
trans-20
ported Saharan dust over Central Europe and over Barbados lead to the assumption that not only the time of long-range transport, but also the transport path, and the con-ditions during transport may be of importance when investigating the effects of aging and transport. This assumptions will be subject of further studies.
A similar analysis was performed for Sp measurements during SAMUM-1 (mean
25
value), SAMUM-2 (5 cases), the Munich event in 2008 (3 cases) and during the SALTRACE campaign (10 cases) (see Fig. 15). For the fresh Saharan dust in Ouaza-zate wavelength-independent mean values ofSp=55±7 sr at 355 nm andSp=56±5 sr
li-ACPD
15, 19325–19366, 2015Lidar measurements of aged Saharan dust
at Barbados
S. Groß et al.
Title Page
Abstract Introduction
Conclusions References
Tables Figures
◭ ◮
◭ ◮
Back Close
Full Screen / Esc
Printer-friendly Version Interactive Discussion
Discussion
P
a
per
|
Discussion
P
a
per
|
Discussion
P
a
per
|
Discussion
P
a
per
|
dar ratios were found during the Munich dust event and the SAMUM-2 campaign for mid-range transported dust with wavelength-independent mean values of about 60 sr (Wiegner et al., 2011; Groß et al., 2011b). These slightly higher values are in good agreement with the study of Schuster et al. (2012) investigating lidar ratios of mineral dust for different regions over Northern Africa and finding the highest mean values for
5
Saharan dust at Cape Verde. During SALTRACE the lidar ratios range between 47 and 63 sr with mean values ofSp=56±7 sr at 532 nm andSp=53±5 sr at 355 nm.
Alto-gether no significant changes in the lidar ratio can be found within the error bars for the fresh and the transported Saharan dust cases.
The mean values and mean uncertainties of Sp and δp for the different dust
mea-10
surements are summarized in Table 2.
4.2 Impact on aerosol classification
It has been shown that the lidar ratio and the particle linear depolarization ratio are quite different for different types of aerosol (e.g., Sakai et al., 2010). Therefore aerosol classification schemes both at 355 and 532 nm have been developed based on these
15
intensive lidar optical properties (Groß et al., 2011b, 2013; Burton et al., 2012; Illing-worth et al., 2014). Up to now those classification schemes do not sufficiently account for the effect of aerosol aging on the thresholds for the discrimination of the different aerosol types. With our measurements during the SALTRACE campaign, in combina-tion with the findings of former measurements of fresh and mid-range transported dust
20
during the SAMUM project and long-range transported dust measurements over Cen-tral Europe, we are now able to investigate the effect of transport and aging on the lidar optical properties of Saharan dust.
Figure 16 shows the particle linear depolarization ratio vs. the lidar ratio at 355 and 532 nm of the different aerosol types which are, up to now, included in the aerosol
25
ACPD
15, 19325–19366, 2015Lidar measurements of aged Saharan dust
at Barbados
S. Groß et al.
Title Page
Abstract Introduction
Conclusions References
Tables Figures
◭ ◮
◭ ◮
Back Close
Full Screen / Esc
Printer-friendly Version Interactive Discussion
Discussion
P
a
per
|
Discussion
P
a
per
|
Discussion
P
a
per
|
Discussion
P
a
per
|
well with former results found for marine aerosols or marine aerosol mixtures, indicat-ing that the boundary layer was dominated by marine aerosols with various amount of dust mixed into the boundary layer on specific days. Regarding the Saharan dust layer one can see that theδp–Sp space at 355 nm shows a good agreement to former dust
measurements during SAMUM. The specified threshold to identify pure Saharan dust
5
from combinedδp–Spmeasurements (Groß et al., 2015) is still valuable for long-range
transported dust. At 532 nm the SALTRACE results for long-range transported Saharan dust show slightly lowerδpvalues compared to the threshold used for the identification
for Saharan dust. Thus this threshold has to be adapted to a slightly lowerδpvalue of
0.26 to consider long-range transported Saharan dust.
10
5 Conclusions
We presented optical properties of Saharan dust long-range transported across the At-lantic Ocean to Barbados. For this purpose we analyzed measurements with the lidar system POLIS at 355 and 532 nm, in particular we calculated the extinction coefficient
αp, the lidar ratioSp, and the particle linear depolarization ratioδp. While the first
prop-15
erty gives us information about the aerosol load, the latter two properties are intensive lidar properties and thus only dependent on the aerosol type and not on its amount. Therefore, these properties are used for aerosol classification schemes based on lidar measurements (Burton et al., 2012; Groß et al., 2011b, 2013, 2015; Illingworth et al., 2014). The results of this work are closely related to former measurements performed
20
during the SAMUM-1 (Freudenthaler et al., 2009; Tesche et al., 2009b) and SAMUM-2 (Groß et al., 2011b; Tesche et al., 2011) campaigns and during a strong Saharan dust event over Central Europe observed in the framework of EARLINET (Wiegner et al., 2011). Thus, were are able to study possible changes of the optical properties of Sa-haran dust caused by long-range transport.
25
ACPD
15, 19325–19366, 2015Lidar measurements of aged Saharan dust
at Barbados
S. Groß et al.
Title Page
Abstract Introduction
Conclusions References
Tables Figures
◭ ◮
◭ ◮
Back Close
Full Screen / Esc
Printer-friendly Version Interactive Discussion
Discussion
P
a
per
|
Discussion
P
a
per
|
Discussion
P
a
per
|
Discussion
P
a
per
|
The mean systematic errors are 0.01 and 0.03 at 532 and 355 nm, respectively. Com-pared toδp measurements at 532 nm during the SAMUM campaigns we see slightly
lower values for long-range transported Saharan dust to Barbados, while over Central Europe slightly higher values have been found. This leads to the assumption that not only transport time but also the transport path, and the transport conditions have an
5
influence of possible changes of the optical properties of Saharan dust. At 355 nm we do not see significant changes in theδpvalues, but although the overall mean values are slightly higher for long-range transported Saharan dust to Barbados as well as to Central Europe. For long-range transported Saharan dust we do not see a significant wavelength dependence anymore.
10
Mean values of the lidar ratio of long-range transported Saharan dust over Barba-dos are 56±7 sr at 532 nm and 53±5 sr and thus agree well with the values found
for fresh Saharan dust over Morocco (Tesche et al., 2009b). Although these values are slightly lower than the values found for long-range transported Saharan dust over Central Europe (Wiegner et al., 2011) and of mid-range transported Saharan dust over
15
Cape Verde (Groß et al., 2011b) they agree for the measurement uncertainties. Thus we do not see a significant change in this optical properties during transport.
Though the presented measurements are a good test bed to study the optical prop-erties of long-range transported Saharan dust, there are a number of questions re-maining unsolved, e.g. the impact of transport condition on the changes of optical and
20
microphysical properties. Thus further studies will combine lidar measurements with information of the transport conditions and path, e.g. from model calculations. Further-more lidar measurements will be combined to in-situ measurements to get Further-more inside the relationship between optical and microphysical properties, e.g. the cloud conden-sation properties, and about a possible vertical sorting within the dust layer as recently
25
suggested by Yang et al. (2013).
ACPD
15, 19325–19366, 2015Lidar measurements of aged Saharan dust
at Barbados
S. Groß et al.
Title Page
Abstract Introduction
Conclusions References
Tables Figures
◭ ◮
◭ ◮
Back Close
Full Screen / Esc
Printer-friendly Version Interactive Discussion
Discussion
P
a
per
|
Discussion
P
a
per
|
Discussion
P
a
per
|
Discussion
P
a
per
|
contract no. KI1567/1-1, and by the Helmholtz Association under grant number VH-NG-606 (Helmholtz-Hochschul-Nachwuchsforschergruppe AerCARE). The SALTRACE campaign was mainly funded by the Helmholtz Association, the Deutsches Zentrum für Luft- und Raumfahrt (DLR), the Ludwig-Maximilians-Universität München (LMU), and the Institut für Troposphären-forschung (TROPOS). CIMEL calibration was performed at the AERONET-EUROPE calibration
5
center at GOA-UVA, supported by ACTRIS (European Union Seventh Framework Program, FP7/2007-2013) under grant agreement no. 262254.
The article processing charges for this open-access publication were covered by a Research Centre of the Helmholtz Association.
10
References
Amiridis, V., Balis, D. S., Giannakaki, E., Stohl, A., Kazadzis, S., Koukouli, M. E., and Zanis, P.: Optical characteristics of biomass burning aerosols over Southeastern Europe determined from UV-Raman lidar measurements, Atmos. Chem. Phys., 9, 2431–2440, doi:10.5194/acp-9-2431-2009, 2009. 19327
15
Ansmann, A., Riebensell, M., and Weitkamp, C.: Measurement of atmospheric aerosol extinc-tion profiles with a Raman lidar, Opt. Lett., 14, 746–748, 1990. 19327, 19330
Ansmann, A., Wandinger, U., Riebesell, M., Weitkamp, C., and Michaelis, W.: Independent measurement of extinction and backscatter profiles in cirrus clouds by using a combined Raman elastic-backscatter lidar, Appl. Optics, 31, 7113–7131, doi:10.1364/AO.31.007113,
20
1992. 19327, 19330
Ansmann, A., Petzold, A., Kandler, K., Tegen, I., Manfred, W., Müller, D., Weinzierl, B., Müller, T., and Heintzenberg, J.: Saharan Mineral Dust Experiments SAMUM-1 and SAMUM-2: what have we learned?, Tellus B, 63, 403–429, doi:10.1111/j.1600-0889.2011.00555.x, 2011. 19329
25
ACPD
15, 19325–19366, 2015Lidar measurements of aged Saharan dust
at Barbados
S. Groß et al.
Title Page
Abstract Introduction
Conclusions References
Tables Figures
◭ ◮
◭ ◮
Back Close
Full Screen / Esc
Printer-friendly Version Interactive Discussion
Discussion
P
a
per
|
Discussion
P
a
per
|
Discussion
P
a
per
|
Discussion
P
a
per
|
Bauer, S. E., Mishchenko, M. I., Lacis, A. A., Zhang, S., Perlwitz, J., and Metzger, S. M.: Do sulfate and nitrate coatings on mineral dust have important effects on radiative properties and climate modeling?, J. Geophys. Res.-Atmos., 112, D06307, doi:10.1029/2005JD006977, 2007. 19328
Biele, J., Beyerle, G., and Baumgarten, G.: Polarization lidar: correction of instrumental effects,
5
Opt. Express, 7, 427–435, doi:10.1364/OE.7.000427, 2000. 19331
Boucher, O., an P. Artaxo, D. R., Bretherton, C., Feingold, G., Forster, P., Keminen, V.-M., Kondo, Y., Liao, H., Lohmann, U., Rasch, P., Satheesh, S., Sherwood, S., Stevens, B., and Zhang, X. Y.: Clouds and aerosols, in: Climate Change 2013: the Physical Science Basis. Contribution of Working Group I to the Fifth Assessment Report of the
Intergovernmen-10
tal Panel on Climate Change, Cambridge University Press, Cambridge, UK, New York, NY, USA, 571–657, 2013. 19326
Burton, S. P., Ferrare, R. A., Hostetler, C. A., Hair, J. W., Rogers, R. R., Obland, M. D., But-ler, C. F., Cook, A. L., Harper, D. B., and Froyd, K. D.: Aerosol classification using airborne High Spectral Resolution Lidar measurements – methodology and examples, Atmos. Meas.
15
Tech., 5, 73–98, doi:10.5194/amt-5-73-2012, 2012. 19327, 19340, 19341
Draxler, R. R. and Rolph, G. D.: HYSPLIT (HYbrid Single Particle Lagrangian Integrated Trajectory) Model, NOAA Air Resources Laboratory, Silver Spring, MD, available at: http: //ready.arl.noaa.gov/HYSPLIT.php (last access: February 2015), 2012. 19333, 19353 Esselborn, M., Wirth, M., Fix, A., Tesche, M., and Ehret, G.: Airborne high spectral resolution
20
lidar for measuring aerosol extinction and backscatter coefficients, Appl. Optics, 47, 346– 358, doi:10.1364/AO.47.000346, 2008. 19327
Forster, P., Ramaswamy, V., Artaxo, P., Berntsen, T., Betts, R., Fahey, D. W., Haywood, J., Lean, J., Lowe, D. C., Myhre, G. Nganga, J., Prinn, R., Raga, G., Schulz M., and Van Dorland, R.: Changes in atmospheric constituents and in radiative forcing, in: Climate Change 2007: the
25
Physical Science Basis. Contribution of Working Group I to the Fourth Assessment Report of the Intergovernmental Panel on Climate Change, Cambridge University Press, Cambridge, UK, New York, NY, USA, 210–215, 2007. 19326, 19327
Freudenthaler, V., Esselborn, M., Wiegner, M., Heese, B., Tesche, M., Ansmann, A., Müller, D., Althause, D., Wirth, M., Fix, A., Ehret, G., Knippertz, P., Toledano, C., Gasteiger, J.,
Garham-30
ACPD
15, 19325–19366, 2015Lidar measurements of aged Saharan dust
at Barbados
S. Groß et al.
Title Page
Abstract Introduction
Conclusions References
Tables Figures
◭ ◮
◭ ◮
Back Close
Full Screen / Esc
Printer-friendly Version Interactive Discussion
Discussion
P
a
per
|
Discussion
P
a
per
|
Discussion
P
a
per
|
Discussion
P
a
per
|
Freudenthaler, V., Seefeldner, M., Groß, S., and Wandinger, U.: Accuracy of linear depolarisa-tion ratios in clean air ranges measured with POLIS-6 at 355 and 532 nm, in: Proceeding of 27. International Laser Radar Conference, 5–10 July 2015, no. 390, New York, 2015. 19330, 19331
Gasteiger, J., Groß, S., Freudenthaler, V., and Wiegner, M.: Volcanic ash from Iceland over
5
Munich: mass concentration retrieved from ground-based remote sensing measurements, Atmos. Chem. Phys., 11, 2209–2223, doi:10.5194/acp-11-2209-2011, 2011a. 19327 Gasteiger, J., Wiegner, M., Groß, S., Freudenthaler, V. Toledano, C., Tesche, M., and
Kan-dler, K.: Modeling lidar-relevant optical properties of complex mineral dust aerosols, Tellus B, 63, 725–741, doi:10.1111/j.1600-0889.2011.00559.x, 2011b. 19327
10
Goudie, A. and Middleton, N.: Saharan dust storms: nature and consequences, Earth-Sci. Rev., 56, 179–204, 2001. 19327, 19328
Groß, S., Gasteiger, J., Freudenthaler, V., Wiegner, M., Geiß, A., Toledano, C., Kandler, K., Tesche, M., Ansmann, A., and Wiedensohler, A.: Characterization of the planetary boundary layer during SAMUM-2 by means of lidar measurements, Tellus B, 63, 695–705, 2011a.
15
19327, 19331, 19338
Groß, S., Tesche, M., Freudenthaler, V., Toledano, C., Wiegner, M., Ansmann, A., Al-thausen, D., and Seefeldner, M.: Characterization of Saharan dust, marine aerosols and mixtures of biomass burning aerosols and dust by means of multi-wavelength depolarization-and Raman-measurments during SAMUM-2, Tellus B, 63, 706–724,
doi:10.1111/j.1600-20
0889.2011.00556.x, 2011b. 19328, 19331, 19338, 19339, 19340, 19341, 19342, 19350, 19364, 19365, 19366
Groß, S., Wiegner, M., Freudenthaler, V., and Toledano, C.: Lidar ratio of Saharan dust over Cape Verde Islands: assessment and error calculation, J. Geophys. Res.-Atmos., 116, D15203, doi:10.1029/2010JD015435, 2011c. 19331
25
Groß, S., Freudenthaler, V., Wiegner, M., Gasteiger, J., Geiß, A., and Schnell, F.: Dual-wavelength linear depolarization ratio of volcanic aerosols: lidar measurements of the Eyjafjallajökull plume over Maisach, Germany, Atmos. Environ., 48, 85–96, doi:10.1016/j.atmosenv.2011.06.017, 2012. 19366
Groß, S., Esselborn, M., Weinzierl, B., Wirth, M., Fix, A., and Petzold, A.: Aerosol classification
30
ACPD
15, 19325–19366, 2015Lidar measurements of aged Saharan dust
at Barbados
S. Groß et al.
Title Page
Abstract Introduction
Conclusions References
Tables Figures
◭ ◮
◭ ◮
Back Close
Full Screen / Esc
Printer-friendly Version Interactive Discussion
Discussion
P
a
per
|
Discussion
P
a
per
|
Discussion
P
a
per
|
Discussion
P
a
per
|
Groß, S., Wirth, M., Schäfler, A., Fix, A., Kaufmann, S., and Voigt, C.: Potential of airborne lidar measurements for cirrus cloud studies, Atmos. Meas. Tech., 7, 2745–2755, doi:10.5194/amt-7-2745-2014, 2014. 19327
Groß, S., Freudenthaler, V., Wirth, M., and Weinzierl, B.: Towards an aerosol classification scheme for future EarthCARE lidar observations and implications for research needs, Atmos.
5
Sci. Lett., 16, 77–82, doi:10.1002/asl2.524, 2015. 19327, 19340, 19341
Hair, J. W., Hostetler, C. A., Cook, A. L., Harper, D. B., Ferrare, R. A., Mack, T. L., Welch, W., Izquierdo, L. R., and Hovis, F. E.: Airborne High Spectral Resolution Lidar for profiling aerosol optical properties, Appl. Optics, 47, 6734–6752, doi:10.1364/AO.47.006734, 2008. 19327 Haywood, J. and Boucher, O.: Estimates of the direct and indirect radiative forcing due to
tro-10
pospheric aerosols: a review, Rev. Geophys., 38, 513–543, 2000. 19327
Holben, B., Eck, T., Slutsker, I., Tanré, D., Buis, J., Setzer, A., Vermote, E., Reagan, J., Kauf-man, Y., Nakajima, T., Lavenu, F., Jankowiak, I., and Smirnov, A.: AERONET – a federated instrument network and data archive for aerosol characterization, Remote Sens. Environ., 66, 1–16, doi:10.1016/S0034-4257(98)00031-5, 1998. 19330
15
Illingworth, A. J., Barker, H. W., Beljaars, A., Ceccaldi, M., Chepfer, H., Cole, J., Delanoë, J., Domenech, C., Donovan, D. P., Fukuda, S., Hirakata, M., Hogan, R. J., Huenerbein, A., Kollias, P., Kubota, T., Nakajima, T., Nakajima, T. Y., Nishizawa, T., Ohno, Y., Okamoto, H., Oki, R., Sato, K., Satoh, M., Shephard, M., Wandinger, U., Wehr, T., and van Zadelhoff, G.-J.: The EarthCARE Satellite: the next step forward in global measurements of clouds, aerosols,
20
precipitation and radiation, B. Am. Meteorol. Soc., eView, doi:10.1175/BAMS-D-12-00227.1, 2014. 19327, 19340, 19341, 19366
IPCC: Climate Change 2013: the Scientific Basis, Cambridge University Press, Cambridge, UK, New York, NY, USA, 2013. 19327
Liu, Z., Omar, A., Vaughan, M., Hair, J., Kittaka, C., Hu, Y., Powell, K., Trepte, C., Winker, D.,
25
Hostetler, C., Ferrare, R., and Pierce, R.: Calipso lidar observations of the optical proper-ties of saharan dust: a case study of long-range transport, J. Geophys. Res., 113, D07207, doi:10.1029/2007JD008878, 2008. 19328
Nousiainen, T.: Optical modeling of mineral dust particles: a review, J. Quant. Spectrosc. Ra., 110, 1261–1279, doi:10.1016/j.jqsrt.2009.03.002, 2009. 19328
30
ACPD
15, 19325–19366, 2015Lidar measurements of aged Saharan dust
at Barbados
S. Groß et al.
Title Page
Abstract Introduction
Conclusions References
Tables Figures
◭ ◮
◭ ◮
Back Close
Full Screen / Esc
Printer-friendly Version Interactive Discussion
Discussion
P
a
per
|
Discussion
P
a
per
|
Discussion
P
a
per
|
Discussion
P
a
per
|
Fung, I., Ghan, S., Ginoux, P., Gong, S.-L., Guenther, A., Herzog, M., Higurashi, A., Kaufman, Y., Kettle, A., Kiehl, J., Koch, D., Lammel, G., Land, C., Lohmann, U., Madronich, S., Mancini, E., Mishchenko, M., Nakajima, T., Quinn, P., Rasch, P., Roberts, D. L., Savoie, D., Schwartz, S., Seinfeld, J., Soden, B., Tanré, D., Taylor, K., Tegen, I., Tie, X., Vali, G., Van Dingenen, R., van Weele, M., and Zhang, Y.: Climate Change 2001: the Scientific Assessment, Cambridge
5
Univ. Press, Cambridge, UK, New York, NY, USA, 289–348, 2001. 19326
Penner, J. E., Xu, L., and Wang, M.: Satellite methods underestimate indirect climate forcing by aerosols, P. Natl. Acad. Sci. USA, 108, 13404–13408, 2011. 19326
Prospero, J. M., Bonatti, E., Schubert, C., and Carlson, T. N.: Dust in the Caribbean atmosphere traced to an African dust storm, Earth Planet. Sc. Lett., 9, 287–293,
doi:10.1016/0012-10
821X(70)90039-7, 1970. 19329
Redmond, H. E., Dial, K. D., and Thompson, J. E.: Light scattering and absorption by wind blown dust: theory, measurement, and recent data, Aeolian Res., 2, 5–26, doi:10.1016/j.aeolia.2009.09.002, 2010. 19328
Sakai, T., Nagai, T., Zaizen, Y., and Mano, Y.: Backscattering linear depolarization ratio
mea-15
surements of mineral, sea-salt, and ammonium sulfate particles simulated in a laboratory chamber, Appl. Optics, 49, 4441–4449, doi:10.1364/AO.49.004441, 2010. 19340
Schepanski, K., Tegen, I., Laurent, B., Heinold, B., and Macke, A.: A new Saharan dust source activation frequency map derived from MSG-SEVIRI IR-channels, Geophys. Res. Lett., 34, L18803, doi:10.1029/2007GL030168, 2007. 19333
20
Schuster, G. L., Vaughan, M., MacDonnell, D., Su, W., Winker, D., Dubovik, O., Lapyonok, T., and Trepte, C.: Comparison of CALIPSO aerosol optical depth retrievals to AERONET mea-surements, and a climatology for the lidar ratio of dust, Atmos. Chem. Phys., 12, 7431–7452, doi:10.5194/acp-12-7431-2012, 2012. 19340
Shao, Y., Wyrwoll, K.-H., Chappell, A., Huang, J., Lin, Z., McTainsh, G. H., Mikami, M.,
25
Tanaka, T. Y., Wang, X., and Yoon, S.: Dust cycle: an emerging core theme in Earth sys-tem science, Aeolian Res., 2, 181–204, doi:10.1016/j.aeolia.2011.02.001, 2011. 19327 Su, W., Loeb, N. G., Schuster, G. L., Chin, M., and Rose, F. G.: Global all-sky shortwave direct
radiative forcing of anthropogenic aerosols from combined satellite observations and GO-CART simulations, J. Geophys. Res.-Atmos., 118, 655–669, doi:10.1029/2012JD018294,
30
2013. 19327
multi-ACPD
15, 19325–19366, 2015Lidar measurements of aged Saharan dust
at Barbados
S. Groß et al.
Title Page
Abstract Introduction
Conclusions References
Tables Figures
◭ ◮
◭ ◮
Back Close
Full Screen / Esc
Printer-friendly Version Interactive Discussion
Discussion
P
a
per
|
Discussion
P
a
per
|
Discussion
P
a
per
|
Discussion
P
a
per
|
wavelength Raman and polarization lidars during Saharan Mineral Dust Experiment 2008, J. Geophys. Res., 114, D13202, doi:10.1029/2009JD011862, 2009a. 19331
Tesche, M., Ansmann, A., Müller, D., Althausen, D., Mattis, I., Heese, B., Freudenthaler, V., Wiegner, M., Esselborn, M., Pisani, G., and Knippertz, P.: Vertical profiling of Saharan dust with Raman lidars and airborne HSRL in southern Morocco during SAMUM, Tellus B, 61,
5
144–164, 2009b. 19331, 19338, 19339, 19341, 19342, 19350, 19365
Tesche, M., Gross, S., Ansmann, A., Müller, D., Althause, D., Freudenthaler, V., and Es-selborn, M.: Profiling of Saharan dust and biomass-burning smoke with multiwavelength polarization Raman lidar at Cape Verde, Tellus B, 63, 649–676, doi:10.1111/j.1600-0889.2011.00548.x, 2011. 19341
10
Washington, R., Todd, M., Middleton, N. J., and Goudie, A. S.: Dust-storm source areas de-termined by the total ozone monitoring spectrometer and surface observations, Ann. Assoc. Am. Geogr., 93, 297–313, 2003. 19327
Weinzierl, B., Sauer, D., Esselborn, M., Petzold, A., Mund, S., Veira, A., Tesche, M., Ans-mann, A., and Wirth, M.: Airborne observations of microphysical and optical properties of
15
dust and biomass burning aerosol layers in the Cape Verde region during SAMUM 2008, Tellus B, 63, 589–618, doi:10.1111/j.1600-0889.2011.00566.x, 2011. 19328
Wiegner, M., Gasteiger, J., Groß, S., Schnell, F., Freudenthaler, V., and Forkel, R.: Charac-terization of the Eyjafjallajökull ash-plume: potential of lidar remote sensing, Phys. Chem. Earth Pt. A/B/C, 45–46, 79–86, doi:10.1016/j.pce.2011.01.006, 2011. 19328, 19339, 19340,
20
19341, 19342, 19350, 19364, 19365, 19366
Winker, D. M., Vaughan, M. A., Omar, A., Hu, X., Powell, K. A., Liu, Z., Hund, W. H., and Young, S. A.: Overview of the CALIPSO mission and CALIOP data processing algorithms, J. Atmos. Ocean. Tech., 26, 2310–2323, doi:10.1175/2009JTECHA1281.1, 2009. 19328 Yang, W., Marshak, A., Kostinski, A. B., and Várnai, T.: Shape-induced gravitational sorting of
25
ACPD
15, 19325–19366, 2015Lidar measurements of aged Saharan dust
at Barbados
S. Groß et al.
Title Page
Abstract Introduction
Conclusions References
Tables Figures
◭ ◮
◭ ◮
Back Close
Full Screen / Esc
Printer-friendly Version Interactive Discussion
Discussion
P
a
per
|
Discussion
P
a
per
|
Discussion
P
a
per
|
Discussion
P
a
per
|
Table 1.Layer mean values for the case studies of lidar ratio Sp and particle linear
depolar-ization ratio δp including systematic errors (±), the standard deviations of the values within
the height range (σ) indicating the variability of the values within the layer, and the considered aerosol layer.a and b indicate the upper and/or lower boundary used to calculate the mean value.
Height a.g.l./km Lidar ratio/sr PLDR Layer
20 June 2013; (23–23:30 UTC)
0.25b/0.5a–1.5 21±3 (σ=1) (532 nm) a
0.02±0.01 (σ=0.01) (532 nm)b Boundary layer
17±2 (σ=1) (355 nm)a 0.02±0.01 (σ=0.01) (355 nm)b
2.0–2.5 56±5 (σ=2) (532 nm) 0.30±0.01 (σ=0.01) (532 nm) Dust layer 50±4 (σ=2) (355 nm) 0.26±0.02 (σ=0.01) (355 nm)
27 June 2013; (00:00–02:00 UTC)
0.25b/0.5a–1.5 25±3 (σ=1) (532 nm) a
0.06±0.01 (σ=0.01) (532 nm)b
Boundary layer 28±2 (σ=1) (355 nm)a 0.04±0.01 (σ=0.01) (355 nm)b
2.0–3.5a/3.75b 56±8 (σ=5) (532 nm) a
0.26±0.01 (σ=0.01) (532 nm)b
Dust layer 55±7 (σ=7) (355 nm)a 0.26±0.03 (σ=0.01) (355 nm)b
01 July 2013; (07:00–09:00 UTC)
0.4b/0.5a–1.5 30±4 (σ=2) (532 nm) a
0.06±0.01 (σ=0.01) (532 nm)b Boundary layer
25±2 (σ=1) (355 nm)a 0.04±0.01 (σ=0.01) (355 nm)b
2.25–3.5a/3.75b 54±7 (σ=8) (532 nm) a
0.27±0.01 (σ=0.01) (532 nm)b
Dust layer 53±6 (σ=3) (355 nm)a 0.27±0.03 (σ=0.01) (355 nm)a
11 July 2013; (23:00–24:00 UTC)
0.4b/0.75a–1.5 35±3 (σ=2) (532 nm)
a 0.10
±0.01 (σ=0.02) (532 nm)b
Boundary layer 35±2 (σ=1) (355 nm)a 0.14±0.01 (σ=0.02) (355 nm)b
ACPD
15, 19325–19366, 2015Lidar measurements of aged Saharan dust
at Barbados
S. Groß et al.
Title Page
Abstract Introduction
Conclusions References
Tables Figures
◭ ◮
◭ ◮
Back Close
Full Screen / Esc
Printer-friendly Version Interactive Discussion
Discussion
P
a
per
|
Discussion
P
a
per
|
Discussion
P
a
per
|
Discussion
P
a
per
|
Table 2.Layer mean values of the lidar ratio and particle linear depolarization ratio PLDR in-cluding systematic errors (±) of Saharan dust observations during SAMUM-1 in Morocco close to the source regions (Freudenthaler et al., 2009; Tesche et al., 2009b), of mid-range ported Saharan dust during SAMUM-2 at Cape Verde (Groß et al., 2011b), of long-range trans-ported Saharan dust to Central Europe in Munich, Germany (Wiegner et al., 2011), and of long-range transported Saharan dust across the Atlantic Ocean at Barbados during SALTRACE.
Campaign Lidar ratio/sr PLDR WL/nm
SAMUM-1 56±5 0.31±0.01 532 55±7 0.25±0.07 355
SAMUM-2 62±5 0.30±0.01 532 58±7 0.25±0.03 355
Munich 59±7 0.34±0.02 532 59±8 0.30±0.05 355
ACPD
15, 19325–19366, 2015Lidar measurements of aged Saharan dust
at Barbados
S. Groß et al.
Title Page
Abstract Introduction
Conclusions References
Tables Figures
◭ ◮
◭ ◮
Back Close
Full Screen / Esc
Printer-friendly Version Interactive Discussion
Discussion
P
a
per
|
Discussion
P
a
per
|
Discussion
P
a
per
|
Discussion
P
a
per
|
Figure 2.Time series of(a)aerosol layering during SALTRACE derived from POLIS lidar mea-surements during the evening measurement sessions (red indicates Saharan dust dominated aerosol layers, green indicates intermediate or mixed aerosol layers, blue indicates marine dominated aerosol layers and brown indicates mixtures of Saharan dust and marine aerosols),
ACPD
15, 19325–19366, 2015Lidar measurements of aged Saharan dust
at Barbados
S. Groß et al.
Title Page
Abstract Introduction
Conclusions References
Tables Figures
◭ ◮
◭ ◮
Back Close
Full Screen / Esc
Printer-friendly Version Interactive Discussion
Discussion
P
a
per
|
Discussion
P
a
per
|
Discussion
P
a
per
|
Discussion
P
a
per
|