AMTD
8, 12955–12992, 2015PBDEs size distribution and
health impact
Y. Lyu et al.
Title Page
Abstract Introduction
Conclusions References
Tables Figures
◭ ◮
◭ ◮
Back Close
Full Screen / Esc
Printer-friendly Version Interactive Discussion
Discussion
P
a
per
|
Discussion
P
a
per
|
Discussion
P
a
per
|
Discussion
P
a
per
|
Atmos. Meas. Tech. Discuss., 8, 12955–12992, 2015 www.atmos-meas-tech-discuss.net/8/12955/2015/ doi:10.5194/amtd-8-12955-2015
© Author(s) 2015. CC Attribution 3.0 License.
This discussion paper is/has been under review for the journal Atmospheric Measurement Techniques (AMT). Please refer to the corresponding final paper in AMT if available.
Particle-size distribution of
polybrominated diphenyl ethers (PBDEs)
and its implications for health
Y. Lyu1, T. Xu1, X. Li1, T. Cheng1, X. Yang1, X. Sun2, and J. Chen1
1
Shanghai Key Laboratory of Atmospheric Particle Pollution and Prevention (LAP3), Department of Environmental Science & Engineering, Fudan University,
Shanghai 200032, China 2
Environment Research Institute, Shandong University, Jinan 250100, China
Received: 19 October 2015 – Accepted: 17 November 2015 – Published: 9 December 2015
Correspondence to: X. Li ([email protected]) and X. Sun ([email protected])
AMTD
8, 12955–12992, 2015PBDEs size distribution and
health impact
Y. Lyu et al.
Title Page
Abstract Introduction
Conclusions References
Tables Figures
◭ ◮
◭ ◮
Back Close
Full Screen / Esc
Printer-friendly Version Interactive Discussion
Discussion
P
a
per
|
Discussion
P
a
per
|
Discussion
P
a
per
|
Discussion
P
a
per
|
Abstract
In order better to understand the particle-size distribution of particulate PBDEs and their deposition pattern in human respiratory tract, we made an one year campaign 2012–2013 for the measurement of size-resolved aerosol particles at Shanghai ur-ban site. The results showed that particulate PBDEs exhibited a bimodal distribution
5
with a mode peak in the accumulation particle size range and the second mode peak in the coarse particle size ranges. As the number of bromine atoms in the molecule increased, accumulation mode peak intensity increased while coarse mode peak in-tensity decreased. This change was the consistent with the variation of PBDEs’ sub-cooled vapor pressure. Absorption and adsorption process dominated the distribution
10
of PBDEs among the different size particles. Evaluated deposition flux of Σ13PBDE
was 26.8 pg h−1, in which coarse particles contributed most PBDEs in head and
tra-cheobronchial regions, while fine mode particles contributed major PBDEs in the alve-oli region. In associated with the fact that fine particles can penetrate deeper into the respiratory system, fine particle-bound highly brominated PBDEs can be inhaled more
15
deeply into human lungs and cause a greater risk to human health.
1 Introduction
Polybrominated diphenyl ethers (PBDEs) are a class of organobromine compounds that are widely used as flame retardant. They are applied to a broad array of textiles and consumer products including plastics, polymers, mattresses, upholstery, carpeting,
20
building materials and electronic equipment (de Wit, 2002; Alaee et al., 2003). Because the compounds are additive rather than chemically bound to the products, they can be released into the environment. They are persistent organic chemicals and can bioac-cumulate, therefore, they have become contaminants detectable in the environment, in animals, and in humans (Su et al., 2009; Besis and Samara, 2012). Human uptake is
25
AMTD
8, 12955–12992, 2015PBDEs size distribution and
health impact
Y. Lyu et al.
Title Page
Abstract Introduction
Conclusions References
Tables Figures
◭ ◮
◭ ◮
Back Close
Full Screen / Esc
Printer-friendly Version Interactive Discussion
Discussion
P
a
per
|
Discussion
P
a
per
|
Discussion
P
a
per
|
Discussion
P
a
per
|
food (Marklund et al., 2003; Wensing et al., 2005). The primary source of exposure to humans is believed to be consumption of contaminated fish, poultry, meat and dairy products (Su et al., 2009; Besis and Samara, 2012). Occupational exposures may oc-cur in computer, electronic warehouses and formulation facilities (Harrad et al., 2010). Inhalation exposure can take place through ambient aerosol or dust containing PBDEs.
5
Compared with dust PBDEs, the inhalation of ambient aerosols may be a minor path-way for human people, but it has a long-term bioaccumulation process in human body. When PBDEs are suspended in air, they can be present as particles. Since we can not say how long PBDEs remain in the air, long-term exposure to PBDEs has a greater
potential to cause health effects than does short-term exposure to low levels because
10
of their tendency to build up in your body over many years. Growing concerns about the health impacts of PBDEs have led to decline in their production and finally banned to use in the US and Europe since 2004 (Kemmlein et al., 2009). All technical mixtures of PBDEs were also totally phased out in other regions including China (Betts, 2008). However, it is likely that long-term exposure will continue long after PBDE production
15
has ended through emissions from PBDE-containing products that are still being used. Thus, it becomes necessary to investigate the particulate PBDEs characteristic existing in urban ambient aerosols.
Over the past decade, measurements on atmospheric PBDEs have been carried out in various areas around the world such as Turkey (Cetin and Odabasi, 2008), Japan
20
(Kakimoto et al., 2014), Thailand (Muenhor et al., 2010) and China (Yang et al., 2013) in Asia, USA (Hale et al., 2003) and Canada (Wilford et al., 2004) in North America, Greece (Besis et al., 2015), France (Castro-Jimenez et al., 2011) and Czech (Okonski et al., 2014) in Europe and someplace in Arctic (Moller et al., 2011; Wang et al., 2005). In these studies, the particulate PBDEs were mainly investigated in the individual
par-25
ticle size fractions such as PM2.5and PM10, and rarely involved with size-resolved
AMTD
8, 12955–12992, 2015PBDEs size distribution and
health impact
Y. Lyu et al.
Title Page
Abstract Introduction
Conclusions References
Tables Figures
◭ ◮
◭ ◮
Back Close
Full Screen / Esc
Printer-friendly Version Interactive Discussion
Discussion
P
a
per
|
Discussion
P
a
per
|
Discussion
P
a
per
|
Discussion
P
a
per
|
was merely reported in Thessaloniki, Athens (Greece) (Mandalakis et al., 2009; Be-sis et al., 2015), e-waste recycling sites in close to Guangzhou (China) (B. Z. Zhang et al., 2012; Luo et al., 2014b), and Brno (Czech) (Okonski et al., 2014). These stud-ies showed that major lighter brominated congeners existed on coarse particles, while most highly brominated congeners occurred in fine particles. In association with the
5
fact that fine particles can easily penetrate/enter the alveolar region, fine particle-bound highly brominated congeners can travel deep into the lungs and cause serious health problems for human people (Geiser et al., 2005). To clarify this issue we first need to investigate the actual particle-size distribution of PBDEs through a long-term observa-tion.
10
This investigation was conducted in urban Shanghai with the aim to evaluate the con-tribution of particle-size discon-tribution of PBDEs and their deposition in human respiratory tract. Besides this, the elucidation of influence of some factors such as the volatility, the
chemical affinities and releasing source onto these distributions was also attempted.
2 Experimental and methods 15
2.1 Chemicals
Standard mixtures of PBDEs (BDE-17, -28, -47, -66, -71, -85, -99, -100, -138, -153, -154, -183, -190 and -209) were purchased from AccuStandard, Inc. (USA). Internal
standards (13C-BDE-28, 47, 99 and 153) were purchased from Cambridge Isotope
Lab-oratories (Andover, MA). PBDE congeners are divided into 5 groups (e.g., tri-, tetra-,
20
AMTD
8, 12955–12992, 2015PBDEs size distribution and
health impact
Y. Lyu et al.
Title Page
Abstract Introduction
Conclusions References
Tables Figures
◭ ◮
◭ ◮
Back Close
Full Screen / Esc
Printer-friendly Version Interactive Discussion
Discussion
P
a
per
|
Discussion
P
a
per
|
Discussion
P
a
per
|
Discussion
P
a
per
|
2.2 Sample collection
The sampling campaign took place on the rooftop (20 m above the ground) of No. 4
teaching building at Fudan University campus (121.50◦E, 31.30◦N), approximately
5 km northeast of downtown Shanghai city (elevation about 4 m a.s.l.). A Fudan su-per monitoring station for atmospheric chemistry was running all year round. The site
5
was in close proximity to digital malls, residences and the traffic around was busy due
to close to sub-downtown. The main releasing sources at this site included industries emission, household heating and road transport. Details regarding the sampling site were included in our previous work (P. F. Li et al., 2011; X. Li et al., 2011). Particle
sam-ples were collected by drawing air through quartz fiber filter (Whatman QMA,∅81 mm),
10
using an Anderson 8-stage air sampler (Tisch Environmental Inc., USA). The flow rate
was controlled at 28.3 L min−1. The cutoffaerodynamic diameters for each stage were
<0.4, 0.4–0.7, 0.7–1.1, 1.1–2.1, 2.1–3.3, 3.3–4.7, 4.7–5.8, 5.8–9.0 and>9.0 µm. The
whole observing period ranged from December 2012 to November 2013. The sam-pling time was 120 h for each sample batch. A total of 189 particle samples (21 sample
15
batches containing 9 size fractions) were obtained at this site. Prior to sampling, the
filters that wrapped in aluminum foils were baked at 450◦C for 12 h to remove organic
materials. After sampling, loaded filters together with aluminum foils were stored at
−20◦C until extraction. In addition, meteorological data during the sampling period was
obtained from the Fudan atmospheric monitoring station (Lv et al., 2015).
20
2.3 Sample extraction
The aerosol samples were extracted by Soxhlet with a mixture of
dichloromethane/hexane (1 : 1, ν/ν). The extraction time was 36 h at a constant
temperature 69◦. After extraction, the samples were filtered through 0.45 µm PTFE
syringe filters and concentrated using a rotary evaporator (BÜCHI Rotavapor,
Switzer-25
land) and a pure N2 stream. Before instrumental analysis, 13C-BDE-28, -47, -99 and
AMTD
8, 12955–12992, 2015PBDEs size distribution and
health impact
Y. Lyu et al.
Title Page
Abstract Introduction
Conclusions References
Tables Figures
◭ ◮
◭ ◮
Back Close
Full Screen / Esc
Printer-friendly Version Interactive Discussion
Discussion
P
a
per
|
Discussion
P
a
per
|
Discussion
P
a
per
|
Discussion
P
a
per
|
2.4 Instrumental analysis
Each compound was quantified by an Agilent 7890A Series GC coupled to an Agilent 7000B Triple Quadruple MS (GC/MS/MS, Agilent Technologies Inc., USA) operating at electron impact energy of 70 eV and using the Multiple Reaction Monitoring (MRM)
mode. Samples separation was carried out by a DB-5MS (15 m×0.25 mm i.d. with
5
0.25 µm film thickness) capillary column (J&W Scientific, Folsom, CA). The column
temperature procedure was initially at 150◦C, then 12◦C min−1 to 315◦C with 2 min
hold. All samples were automatically injected by 2 µL in pluse splitless mode. The
in-jector temperature was set to 330◦C, the transfer line to 310◦C and the ion trap to
300◦C. High-purity Helium (99.999 %) was applied as carrier gas with a constant flow
10
rate of 1.2 mL min−1in column. Nitrogen gas was used as collision gas in MS. The
iden-tification and quaniden-tification of PBDEs were done according to retention times, selected precursor ions, product ions and the internal standard method relative to the closest eluting PBDE surrogate. The calibration solutions were prepared at five concentra-tions and contained uniform concentraconcentra-tions of the internal standards. For each analyte,
15
a relative response factor was determined for each calibration level using the internal standard. The five response factors were then averaged to produce a mean relative response factor for each species. Reported analyte concentrations were corrected for internal standards recoveries. The calibration curves showed a linear response in the
range 0.1– 5 µg L−1. The correlation coefficients of the calibration curve for the different
20
PBDEs wereR2>0.99.
2.5 Quality control and assurance
Each batch of samples included one procedural blanks. In that case, only BDE-71, 100,
154 and 190 were commonly detected at much lower levels (<5 %) in some samples.
The mean values of blanks were then subtracted from measured values of each
sam-25
AMTD
8, 12955–12992, 2015PBDEs size distribution and
health impact
Y. Lyu et al.
Title Page
Abstract Introduction
Conclusions References
Tables Figures
◭ ◮
◭ ◮
Back Close
Full Screen / Esc
Printer-friendly Version Interactive Discussion
Discussion
P
a
per
|
Discussion
P
a
per
|
Discussion
P
a
per
|
Discussion
P
a
per
|
isotopically-labelled PBDEs internal standard were higher than 70 % for all the sam-ples (refer to SRM 2585, NIST, Gaithersburg, MD). Repeatability was evaluated by per-forming four analyses of a standard PBDEs solution containing the above mentioned PBDEs and the surrogate standards in the same conditions. The relative standard de-viations (RSD) of the relative response factors were below the 10 % for all PBDEs.
5
The method detection (DL) and quantification limits (QL) were calculated as the con-centrations equivalent to three and ten times the noise of the quantifier ion for a blank
sample (DL ranged from 0.05 to 0.6 pg m−3). For the purpose of statistical analysis,
samples with concentrations under LOD were assigned concentrations equal to 0.5 LOD (Okonski et al., 2014).
10
2.6 Size-specific gas/particle partition
Two processes are commonly accepted for illustrating mechanisms of particle-gas par-tition, i.e., adsorption and absorption process. In the case of adsorption, it assumes that chemicals adsorb to active sites on the surface of the particle. The gas-particle
partitioning coefficients (Kp-ads) during the adsorption process is described by (Pankow,
15
1987):
Kp-ads=
NsATSPT e
(QL−Qv)/RT
1600p◦
L
, (1)
whereNs is the surface concentration of sorption sites (4×10−
10
mol cm−2), ATSP is
the specific surface area of the particles,T is the ambient temperature (292 K),R is the
ideal gas constant (8.31 J mol−1K−1),QL,Qvare respectively the enthalpy of desorption
20
from the surface and the enthalpy of vaporization of the subcooled liquid (kJ mol−1),p◦
L is the vapor pressure of the subcooled liquid. In contrast with PAHs, similar situation
was assumed for PBDEs thatQL−Qv≈1×10
4
J mol−1 (Aubin and Abbatt, 2006). After
logarithmic transformation on both sides in Eq. (1), we can get the followed Eq. (2):
logKp-ads=−logp◦L+logATSP−8.35 (2)
AMTD
8, 12955–12992, 2015PBDEs size distribution and
health impact
Y. Lyu et al.
Title Page
Abstract Introduction
Conclusions References
Tables Figures
◭ ◮
◭ ◮
Back Close
Full Screen / Esc
Printer-friendly Version Interactive Discussion
Discussion
P
a
per
|
Discussion
P
a
per
|
Discussion
P
a
per
|
Discussion
P
a
per
|
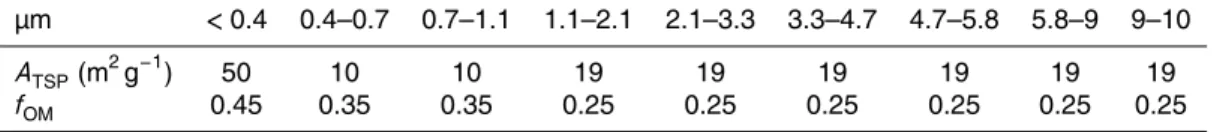
Size dependentATSP adopted from the results of Yu and Yu (2012) and the data was
list in Table 2. Based on three modes, we then obtained Eq. (3) which derived from Eq. (2).
logKp-ads=
−logp◦L−6.64 (Aitken mode: <0.4 µm)
−logp◦L−7.25 (Accumulation mode: 0.4−2.1 µm)
−logp◦L−7.06 (Coarse mode: 2.1−10 µm)
(3)
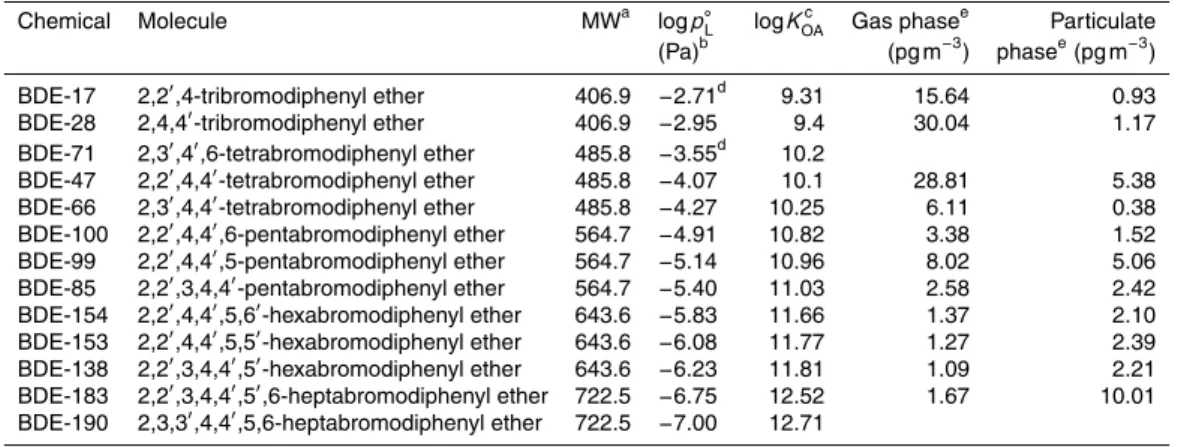
The temperature dependentp◦L values of PBDE congeners was calculated using the
5
regression parameters by (logp◦
L=A+B/T) (Tittlemier et al., 2002). In our study, the
average temperature of sampling campaign was 292 K. The temperature dependent
logp◦
Lwas list in Table 1.
In the case of absorption, it assumes that atmospheric aerosols are coated with an organic film and chemicals can absorb into this organic phase. The gas-particle
10
partitioning coefficients (Kp-abs) during the absorption process is described by Finizio
et al. (1997):
Kp-abs=10−9 Moγo
MOMγOMρOM
fOMKOA, (4)
whereMoandMOM are the mean molecular weights of octanol and the organic matter
phase (g mol−1), γo and γOM are the activity coefficients of the absorbing compound
15
in octanol and in the organic matter phase, respectively.fOM is the fraction of organic
matter phase on particles,KOA is octanol-air partition coefficient.ρOM is the density of
octanol (820 kg m−3at 20◦).
With the assumption that Mo
MOM =1,
γo
γOM =1, the Eq. (4) can be simplified to Eq. (5)
after logarithmic transformation on both sides:
20
AMTD
8, 12955–12992, 2015PBDEs size distribution and
health impact
Y. Lyu et al.
Title Page
Abstract Introduction
Conclusions References
Tables Figures
◭ ◮
◭ ◮
Back Close
Full Screen / Esc
Printer-friendly Version Interactive Discussion
Discussion
P
a
per
|
Discussion
P
a
per
|
Discussion
P
a
per
|
Discussion
P
a
per
|
Size-specific fOM was adopted from Yu and Yu (2012) and list in Table 2. Through
calculation, we can deduce Eq. (6) as followed:
logKp-abs=
logKOA−12.26 (Aitken mode: <0.4 µm)
logKOA−12.42 (Accumulation mode: 0.4−2.1 µm)
logKOA−12.51 (Coarse mode: 2.1−10 µm)
(6)
KOA has been reported as functions of temperature (logKOA=A+B/T) (Harner and
Shoeib, 2002). In this study, the average temperature of sampling campaign was 292 K.
5
The temperature dependent logKOAwas list in Table 1, along with other physiochemical
properties of the target PBDE congeners.
Pankow (Pankow, 1994a) proposed a definition of the measured particle-gas
par-tition coefficient (Kp-measured) to characterize the partitioning behavior of semi-volatile
organic compounds (SVOCs) between the gas and particulate phases
10
Kp-measured= P/TSP
/G (7)
WhereP andG are PBDEs in particulate and gas phase concentration, respectively,
and TSP is the total suspended particulate (µg m−3). After linear regression between
logKp-measured∼logp◦L and logKp-measured∼logKOA, we can get the relationship
be-tween logKp-measured∼logp◦LandKp-measured∼logKOA.
15
In association with Eqs. (4), (6) and (7), we can investigate the sorption mechanisms
governing particle-size distribution of PBDEs by comparing theoreticalKp-adsandKp-abs
with measuredKp-measured.
2.7 Human respiratory risk assessment
Because the size-resolved particles played a key role in health risk assessment through
20
inhalation (Luo et al., 2014a), we adopted a so-called International Commission on Ra-diological Protection (ICRP) model (International Commission on RaRa-diological
AMTD
8, 12955–12992, 2015PBDEs size distribution and
health impact
Y. Lyu et al.
Title Page
Abstract Introduction
Conclusions References
Tables Figures
◭ ◮
◭ ◮
Back Close
Full Screen / Esc
Printer-friendly Version Interactive Discussion
Discussion
P
a
per
|
Discussion
P
a
per
|
Discussion
P
a
per
|
Discussion
P
a
per
|
human respiratory tract. The human respiratory tract can be divided into three regions: head airway (HA), tracheobronchial region (TB), and alveoli region (AR). The particle
deposition efficiency (DE) in HA, TB and AR are estimated by the followed simplified
Eqs. (8), (9) and (10):
DEHA=IF×
1
1+e6.84+1.183 lnDp +
1
1+e0.924−1.885 lnDp
(8)
5
DETB= 3.52×10
−3
Dp
!
× h
e−0.234(lnDp+3.40)2
+63.9×e−0.819(lnDp−1.61)2
i
(9)
DEAR= 0.0155
Dp
!
× h
e−0.416(lnDp+2.84)2
+19.11×e−0.482(lnDp−1.362) 2i
(10)
WhereDpis diameter of the particle, and IF is inhalable fraction of all particles,
IF=1− 1− 1
1+7.6Dp2.8×10−4
!
/2.
The deposition flux (DF, pg h−1) of inhaled particulate PBDEs in respiratory tract is
10
estimated by
DF=X(DEi×Ci)×V (11)
Where DEi is the particle deposition efficiency in each region for Dpi (the average
diam-eter of each particle size fraction);Ci is PBDEs concentration in particle Dpi (pg m−
3 );
and V is the breathing rate. The lower and upper limit diameters of particles in this
15
research were assumed to be 0.1 and 30 µm, respectively. The respiration rate under
normal conditions was considered as 0.45 m3h−1(K. Zhang et al., 2012).
In addition, we applied hazard quotient (HQ) values to assess non-cancer risk of size-resolved PBDEs through inhalation. The formula is as follows:
HQ=DI/(BW×RfD), (12)
AMTD
8, 12955–12992, 2015PBDEs size distribution and
health impact
Y. Lyu et al.
Title Page
Abstract Introduction
Conclusions References
Tables Figures
◭ ◮
◭ ◮
Back Close
Full Screen / Esc
Printer-friendly Version Interactive Discussion
Discussion
P
a
per
|
Discussion
P
a
per
|
Discussion
P
a
per
|
Discussion
P
a
per
|
where DI is daily intake (pg day−1) and calculated by multiplying deposition flux (DF:
pg h−1) with average exposure time (ET: h day−1), BW is mean body weight of adult
(60 kg) and RfD is reported oral reference dose for PBDEs (pg kg−1
bw day−1
).
In order to understand the impact of risk and uncertainty in size-resolved particles, we used Monte Carlo simulations to produce probability distributions of hazard levels
5
with five thousand trials. Moreover, we used the SPSS version 22.0 (IBM company, Chicago, IL, USA) to perform Pearson correlation analysis for all data and considered
pvalues of smaller than 0.01 or 0.05 statistically significant.
3 Results and discussion
3.1 PBDEs occurrence and seasonal variation 10
Most PBDE congeners were detected in the vast majority of samples (Fig. 1 and Ta-ble 3). BDE-71, 100, 154 and 190 were sometimes present close to the detection lim-its of the method. Due to the erratic concentration of BDE 209, this compound has been removed from further analysis. The box plot in Fig. 1 summarizes the concen-trations measured throughout the year and allows for easy visualization of PBDE
con-15
gener groups (e.g., tri-, tetra-, penta-, hexa- and hepta-BDEs). The box contains the middle 50 % of the data, whereas the top and bottom end of the box represent the 75th and 25th percentiles of the data set, respectively. The extensions (“whiskers”) at either end of the box indicate the 95 and 5 percentile and the solid spheres rep-resent the maximum and minimum values. The median concentrations are indicated
20
by the solid vertical lines whereas the mean concentrations are depicted by the hor-izontal line. In general, the size of the box and the length of the whiskers are an indicator of the variability in concentrations at a given site for a given compounds containing the same number of bromine atoms. A small box shows that the distri-bution is uniform over the entire sampling period and vice versa. In these groups,
25
sam-AMTD
8, 12955–12992, 2015PBDEs size distribution and
health impact
Y. Lyu et al.
Title Page
Abstract Introduction
Conclusions References
Tables Figures
◭ ◮
◭ ◮
Back Close
Full Screen / Esc
Printer-friendly Version Interactive Discussion
Discussion
P
a
per
|
Discussion
P
a
per
|
Discussion
P
a
per
|
Discussion
P
a
per
|
ples, followed by hexa-BDE (16.7±7.8 pg m−3), hepta-BDE (11.2±3.1 pg m−3),
tetra-BDE (5.9±1.3 pg m−3) and tri-BDE (1.3±0.3 pg m−3). Among individual PBDEs,
P47, -99 and -85 were detected in 100 % of the ambient aerosol samples, with BDE-99 and -85 being the most dominant congeners. This may be due to the fact that less brominated BDEs have longer half-lives (years) and could be formed through
5
debromination of more brominated congeners (Bezares-Cruz et al., 2004). The
ob-served average concentrations of particulate Σ13PBDEs were ranged from 30.6 to
141.2 pg m−3 with a mean value of 86.3 pg m−3 (Table 3). This result was consistent
with the results of the previous measurements in Shanghai 108−367 pg m−3 (Yang
et al., 2013) and 104±54 pg m−3 (Yu et al., 2011), but was much lower than in
Bei-10
jing 760 pg m−3 (Yang et al., 2013) and in waste recycling zones of Qingyuan close to
Guangzhou 3260 pg m−3 (Tian et al., 2011). In addition, this results were compared
with those reported in aerosol samples from Ontario 88−1250 pg m−3 (Gouin et al.,
2012), Chicago 100±35 pg m−3 (Hoh and Hites, 2005) and three different stations in
western Europe 0.22−37 pg m−3 (Lee et al., 2004), as well as other Asian cities such
15
as Osaka (9.9−22.3 pg m−3) (Kakimoto et al., 2014), Busan (5.3−16 pg m−3), (Rudich
et al., 2007) and Singapore (7.5 pg m−3) (Shen et al., 2013). These direct comparison
of PBDEs concentrations between various urban environments should be done with
caution. Because of the differences existing within any urban environment, PBDE
lev-els could be significantly affected by the location of the sampling site and its proximity to
20
emission sources. Moreover, sampling methodology is a critical parameter affecting the
comparison between the observed concentrations of PBDEs in different sites. In most
published studies, collection of particulate PBDEs has been performed by using dif-ferent sampling, pretreatment and instrumental analysis system devices and in some cases underestimation of PBDE concentrations might have occurred because more
25
volatile species were mainly in the gas phase and easy to be lost during membrane sampling or storage period.
Seasonal variations were distinct at this urban sites, with significantly higher
AMTD
8, 12955–12992, 2015PBDEs size distribution and
health impact
Y. Lyu et al.
Title Page
Abstract Introduction
Conclusions References
Tables Figures
◭ ◮
◭ ◮
Back Close
Full Screen / Esc
Printer-friendly Version Interactive Discussion
Discussion
P
a
per
|
Discussion
P
a
per
|
Discussion
P
a
per
|
Discussion
P
a
per
|
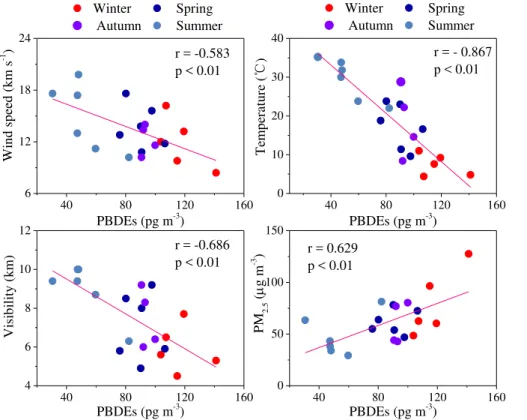
during summer (30.6−82.2 pg m−3) (Table 3). Higher concentrations in winter were at
least in part due to increased emissions and by the distinctive meteorological condi-tions including reduced mixing heights and lower precipitation depth for favoring the pollutants accumulation in the atmosphere (Volckens and Leith, 2003). In addition, the adsorption of gaseous PBDEs on particles was likely to increase during winter since
5
the partition coefficient, Kp was inversely correlated with temperature (r=−0.867,
p <0.01) (see Fig. 2). Lower concentrations in summer may have been caused by wet scavenging since some summer sampling days experienced precipitation at this site. Seasonal variations in PBDEs can also be explained by the Asian monsoon pat-terns. Shanghai sites are situated in a transitional zone of the northern subtropical
10
monsoon system, where the northwesterly winter monsoon bring polluted air masses from China Mainland, while the southeasterly summer monsoon bring cleaner oceanic aerosols comes from the oceans (Western Pacific) (Shi and Cui, 2012). Moreover, higher wind speeds appeared to be typically associated with lower PBDEs
concentra-tions (r=−0.583, p <0.01) (Fig. 2). Higher PBDEs concentrations were associated
15
with higher PM2.5level (r =0.629,p <0.01) and lower visibility (r =−0.686,p <0.01).
This seasonal pattern were consistent with those measured in Huaniao Island (Li et al., 2015), Qingyuan (Tian et al., 2011) and Dongguan (Zhang et al., 2009).
3.2 PBDEs size distribution and process mechanism
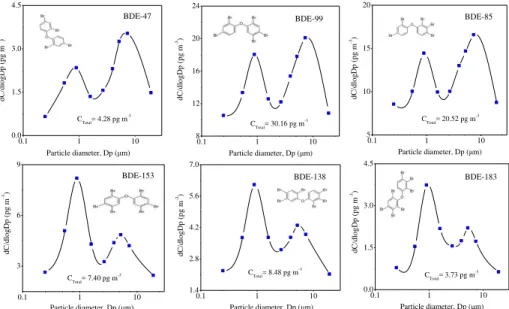
Among the PBDE congeners measured, we chose BDE-47, -85, -99, -138, -153 and
20
-183 for the study on size distribution due to detection frequencies higher than other congeners. Figure 3 plots the average size distributions of these PBDEs in the con-tinuous smoothed curves inverted from the sample data. The results showed that par-ticulate PBDEs exhibited a bimodal distribution with a mode peak in the accumulation particle size range and the second mode peak in the coarse particle size ranges. As the
25
AMTD
8, 12955–12992, 2015PBDEs size distribution and
health impact
Y. Lyu et al.
Title Page
Abstract Introduction
Conclusions References
Tables Figures
◭ ◮
◭ ◮
Back Close
Full Screen / Esc
Printer-friendly Version Interactive Discussion
Discussion
P
a
per
|
Discussion
P
a
per
|
Discussion
P
a
per
|
Discussion
P
a
per
|
brominated congeners BDE 47 and 85 were mainly associated with particles larger than 2.1 mm, whereas the highly brominated congeners were mainly sorbed to the fine particles. The similar bimodal distribution of PBDEs also occurred in Heraklion (Man-dalakis et al., 2009), Brno and Telnice (Okonski et al., 2014), Guangzhou (B. Z. Zhang
et al., 2012). Differences in the particle-size distribution of individual PBDEs could
re-5
flect differences in their emission sources but there was no credible scientific evidence
in support of this claim. Although published data on particle-size distribution of PB-DEs are not available for comparison, analogous trends have also been observed for other classes of organic contaminants such as PAHs. Previous field measurements by cascade impactors demonstrated that more-ring PAHs were sorbed to the fine aerosol
10
fraction, while more volatile or low-ring species were associated with larger particles (Wang et al., 2015; Kavouras et al., 1999; Kawanaka et al., 2004; Bi et al., 2005). The
reason on these is due to the different volatility of PAHs, since more volatile species
are absorbed to fine aerosol and distribute in coarse particles by rapid volatilization and condensation. On the contrary, for the more-ring PAHs, due to the lower vapour
15
pressures, the time required for this repartitioning process is much longer (Bi et al., 2005), therefore, they tend to remain in fine particles initially emitted (Duan et al., 2007). This hypothesis can explain the relatively higher abundance of more volatile PAHs in the coarse particle mode. Similarly, it can be applied the particle-size distribu-tion of PBDEs. To further confirm this hypothesis, the geometric mass diameter (GMD)
20
for particulate PBDEs was calculated and correlated with logarithmic subcooled liquid
vapor pressures (logPL) (Fig. 4). The mean GMD values for all PBDE congeners was
ranged from 1.9 to 2.9 µm in Shanghai, which was higher than those in Greece (0.14– 0.63 µm) (Mandalakis et al., 2009) and Guangzhou (0.98–1.98 µm) (Luo et al., 2014b).
Moreover, there are a positive moderate correlation between GMD and logPL(r =0.69,
25
p <0.01), indicating the GMD increases as the volatile of PBDE congeners increases. This phenomenon becomes more apparent in coarse size fraction with a increased
positive correlation (r =0.75,p <0.01) (right panel in Fig. 4). This result suggests that
AMTD
8, 12955–12992, 2015PBDEs size distribution and
health impact
Y. Lyu et al.
Title Page
Abstract Introduction
Conclusions References
Tables Figures
◭ ◮
◭ ◮
Back Close
Full Screen / Esc
Printer-friendly Version Interactive Discussion
Discussion
P
a
per
|
Discussion
P
a
per
|
Discussion
P
a
per
|
Discussion
P
a
per
|
tetra-BDEs. They are derived from the secondary distribution process, i.e., re-volatilize from fine particles and re-condensate onto coarse ones (Wang et al., 2008; La Guardia et al., 2006).
Moreover, chemical affinities also played an important role in PBDEs’ distribution
pro-cess. Theoretically, highly brominated congeners had strong hydrophobicity and prefer
5
to bound with small particles because they had large surface areas (Venkataraman et al., 1999). Such an explanation, however, cannot adequately account for the PBDEs distribution patterns observed in the present study. Perhaps in fact other factors, e.g. emission sources, sampling sites and weather conditions (temperature and/or relative humidity) might also influence their distributions (Zielinska et al., 2004). Although there
10
were still difficulties in totally clarifying the size distributing mechanism of PBDEs or
other SVOCs now, it was important to integrate all factors in consideration in future study.
3.3 Preliminary study on PBDEs partitioning mechanisms
Usually, two major mechanisms, i.e., adsorption and absorption played the important
15
role in PBDEs partitioning to multimodal urban aerosols (Lohmann and Lammel, 2004).
To clarify these processes, the theoreticalKp-adsandKp-abswere respectively calculated
based on Eqs. (3) and (6) because they involved the size-specific parameters, usually including organic matter fractions and the available adsorptive sites on aerosol
parti-cles (Pandis et al., 1992; Pankow, 1994b). The obtained theoreticalKp-ads and Kp-abs
20
values were estimated and compared with measured Kp-measured (from Eq. 7). Since
we had no gas PBDEs concentrations, the measuredKp-measured were based on a
re-cent study in shanghai by Yang et al. (2013). In their studies, both gas and particulate
PBDEs concentration were reported at an urban site about∼50 km away from our site
(Table 1). A range of 10–70 µg m−3 was assumed for size-specific particle
concentra-25
tion to calculateKp-measured. The measurement periods ranged from September 2008 to
August 2009. The average temperature was 18.4◦C, similar to the temperatures in our
AMTD
8, 12955–12992, 2015PBDEs size distribution and
health impact
Y. Lyu et al.
Title Page
Abstract Introduction
Conclusions References
Tables Figures
◭ ◮
◭ ◮
Back Close
Full Screen / Esc
Printer-friendly Version Interactive Discussion
Discussion
P
a
per
|
Discussion
P
a
per
|
Discussion
P
a
per
|
Discussion
P
a
per
|
with the theoretical Kp-ads and Kp-abs derived from adsorption and absorption in our
study. Note that we took <0.4µm, 0.4−2.1 µm and >2.1µm for Aitken, accumulation
and coarse mode, respectively.
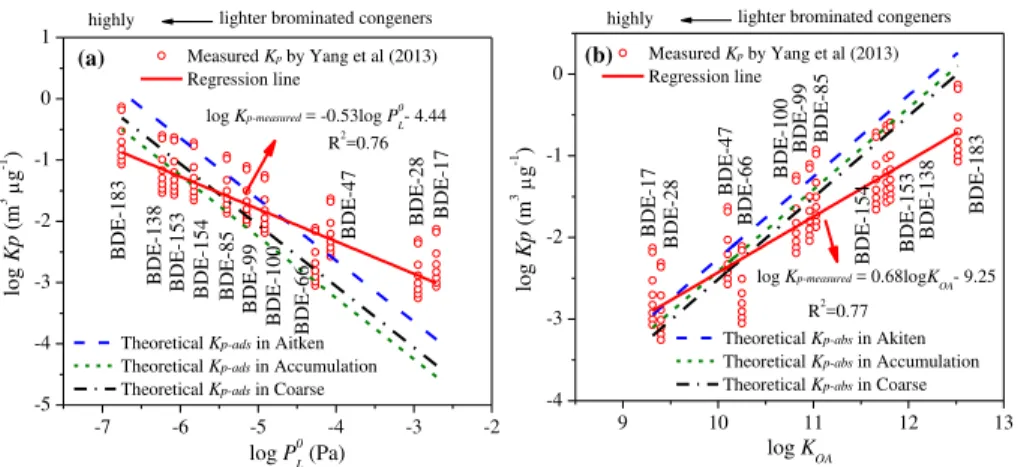
The plots of measured logKp-measuredvs. logp◦Land logKOAwere presented in Fig. 5,
along with two sets of theoreticalKp-ads and Kp-abs based on adsorption and
absorp-5
tion in three modes. As presented, significant linear correlations were found between
measured logKp-measuredand logp◦
L(R 2
=0.76) as well as measured logKp-measuredand
logKOA(R
2
=0.77). For the same class compounds under equilibrium conditions by
ei-ther adsorption or absorption, the slope of log-log plots of Kp and p◦
L was expected
to be close to −1 (Pankow and Bidleman, 1992) and the slope of log-log plots of Kp
10
andKOA should be close to 1 (Finizio et al., 1997). However, more gentle regression
lines (slopes: −0.53, 0.68) were detected (Fig. 5), similar to slopes reported in
previ-ous studies (Cetin and Odabasi, 2008; Yang et al., 2012). The deviations were possi-bly caused by kinetic limitations (non-equilibrium partition), thermodynamic limitations (lack of constancy in desorption) and additional sorption (Harner and Bidleman, 1998;
15
Cousins and Mackay, 2001; Lohmann et al., 2007).
The three mode data sets of theoretical logKp-ads and logKp-abs in Fig. 5a and b
were calculated using Eqs. (3) and (6), considering only adsorption mechanism or
absorption mechanism, respectively. As expected, the slopes for them were all −1.
Both logKp-ads considering only adsorption and logKp-abs considering only absorption
20
were compared with measured logKp−meaused in Fig. 5. The results showed that the
Kp-measuredvalues of highly brominated congeners (e.g., BDE-85, -99, -100, -138, -153,
-154 and -183) in three modes fell into the regression line of the theoretical Kp-ads.
(Fig. 5a), while the measuredKp-measured values of lighter brominated congeners (e.g.,
BDE-17,−28,−47 and −66) in three modes fell into the regression line of the
theo-25
reticalKp-abs (Fig. 5b). These facts revealed that adsorption on surfaces of particles
appeared to be responsible for bimodal distribution of highly brominated congeners, while absorption into organic matter seemed to play an important role for lighter
respec-AMTD
8, 12955–12992, 2015PBDEs size distribution and
health impact
Y. Lyu et al.
Title Page
Abstract Introduction
Conclusions References
Tables Figures
◭ ◮
◭ ◮
Back Close
Full Screen / Esc
Printer-friendly Version Interactive Discussion
Discussion
P
a
per
|
Discussion
P
a
per
|
Discussion
P
a
per
|
Discussion
P
a
per
|
tively close to the theoretical Kp-ads line in Aitken regression lines (Fig. 5a) and the
theoreticalKp-abs lines in the accumulation and coarse regression lines (Fig. 5b). This
meant that the mechanisms controlling the particle-size distribution of PBDEs included adsorption to Aitken mode particles and absorption to accumulation and coarse mode
particles. Adsorption is dependent on available aerosol surface area (ATSP) and
ab-5
sorption on available aerosol organic mass (fOM). AlthoughATSP andfOM could not be
measured and empirical data ofATSP orfOM were adopted from references in this
pa-per, we did provide a way to investigate the mechanisms for size distribution of SVOCs from the view of gas-particle partition.
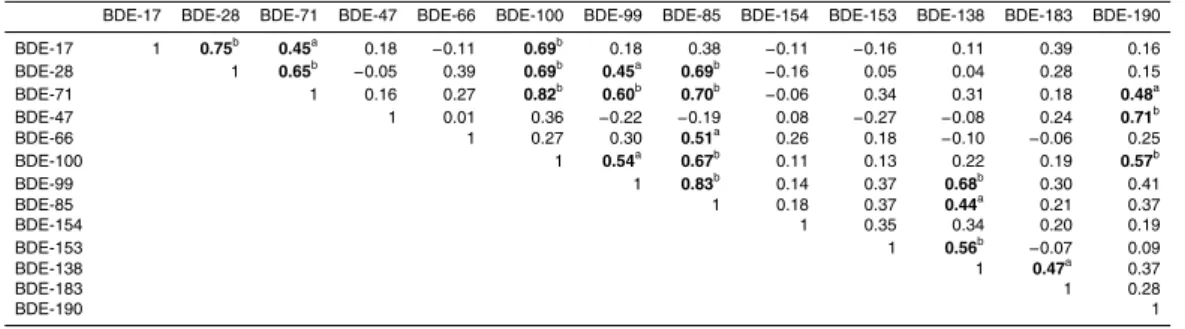
3.4 Correlation analysis of PBDEs 10
Table 4 presents a Pearson correlation matrix among PBDE congeners based on con-centrations. Significant correlation was found among the tri-BDEs (BDE-17 and -28,
r=0.75,p <0.05), as well as penta-BDEs (BDE-100, -99 and -85,r=0.67−0.83,p <
0.05). These high correlation values suggested tri-BDEs and/or penta-BDEs shared a common source and/or exhibited a similar distribution behavior in environment.
BDE-15
28 significantly correlated with BDE-71 (r =0.65,p <0.05), and both of them also
sig-nificantly correlated with penta-BDEs 100, 99 and 85. As we known, penta-BDEs were frequently detected in ambient particles around solid waste incineration plants (Dong et al., 2015). In this observation, we also found that penta-BDEs appeared high
con-centrations (mean: 49.5 pg m−3) compared with other congeners. Thus, we concluded
20
that these penta-BDEs and correlated congeners probable came from the same source regions because there were numerous of solid waste incineration plants located in sur-rounding places of Shanghai. Hepta-BDE (BDE-183 and -190) correlated poorly with the other congeners, with only two exception, which were statistically significant at the
r=0.47, p <0.01 level for BDE-183 and -138, as well asr =0.71, p <0.05 level for
25
AMTD
8, 12955–12992, 2015PBDEs size distribution and
health impact
Y. Lyu et al.
Title Page
Abstract Introduction
Conclusions References
Tables Figures
◭ ◮
◭ ◮
Back Close
Full Screen / Esc
Printer-friendly Version Interactive Discussion
Discussion
P
a
per
|
Discussion
P
a
per
|
Discussion
P
a
per
|
Discussion
P
a
per
|
et al., 2004; Söderström et al., 2004; Kajiwara et al., 2008). Here we did not measure higher brominated PBDEs (octa- and deca-BDEs) and no correlation analysis were performed on them. But as seen in Fig. 1, the hexa- vs. hepta-BDEs concentrations
(mean: 16.7 and 11.2 pg m−3) were relatively high, thus indicative of multiple releasing
sources in this area, i.e., local emission, higher brominated PBDEs breakdown and
5
long-range atmospheric transport maybe had the potential contributions to hexa- and hepta-BDEs contaminations.
3.5 Implication for health
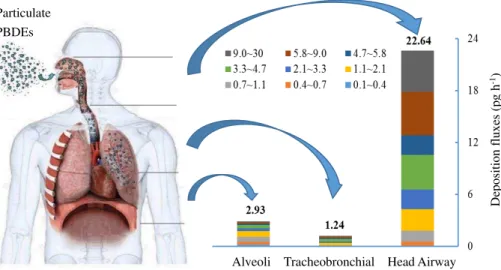
In this section, we calculated the regional deposition flux in human respiratory tract based on Eqs. (8), (9) and (10). Figure 6 showed the deposition fluxes of size-resolved
10
PBDEs for adult men. The total deposition fluxes of Σ13PBDE were calculated at
26.8 pg h−1. Among these compounds, penta −BDE was the major congeners and
contributed a mean value of 58 % (range: 31−70 %) to the total deposition fluxes. The
percent contribution ofΣ13PBDEs to the respiratory tract were 84.4 % (22.64 ng h−1) in
the head airway, 4.6 % (1.24 ng h−1) in the tracheobronchial, and 11.0 % (2.93 pg h−1)
15
in the alveoli regions, respectively. Moreover, we also found that coarse particles con-tributed major PBDEs in the head and tracheobronchial regions, while fine particles (accumulation plus Aitken mode particles) contributed lots of PBDEs in the alveoli re-gion. As we known, the particle-size distribution of PBDEs has a decisive influence
on their potential health effects. Considering that fine particles can penetrate deeper
20
into the respiratory system compared to coarse particles, fine particle-bound PBDEs are expected to accumulate in the lower parts of the lungs and pose a greater risk to human health.
We further evaluated the human health risk that caused by PBDEs by using HQ approach based on inhaled PBDEs data. Figure 7 showed that the HQ values of the
25
individual congeners were ranging from 4.0×10⁻⁷to 6.8×10⁻⁵with the total value of
1.6×10⁻⁴forΣ13PBDE. During the assessment process, we found that the HQ values
incon-AMTD
8, 12955–12992, 2015PBDEs size distribution and
health impact
Y. Lyu et al.
Title Page
Abstract Introduction
Conclusions References
Tables Figures
◭ ◮
◭ ◮
Back Close
Full Screen / Esc
Printer-friendly Version Interactive Discussion
Discussion
P
a
per
|
Discussion
P
a
per
|
Discussion
P
a
per
|
Discussion
P
a
per
|
stant and would result in uncertainty in the risk evaluation. Taking these situations into consideration, we utilized Monte Carlo (MC) simulation to evaluate the influences of
un-certainty on this exposure model and to examine whether a difference exists between
the model and the calculated HQ. In the simulation, the MC procedure was repeated
5000 times with different calculated HQ. The results of the simulation were depicted
5
in Fig. 8, which exhibited a wide gamma distribution. The 95 % percentile values of
HQ were in the range 9.15×10⁻⁵–8.36×10⁻⁵, with the mean value of 8.76×10⁻⁵. In
comparison with the corresponding experimental HQ data (1.6×10⁻⁴), excellent
agree-ments could be observed between the data, indicating the accuracy of our simulation. By comparison, these HQ values in the present study were much lower than the risk
10
guideline value (1.0) recommended by the US EPA. Even under heavy exercise
condi-tions (assuming a high breathing rate of 3 m3h−1
), the estimated HQ ofΣ13PBDE was
only (1.17±0.42)×10−3, far less than 1.Thus, particulate PBDEs in Shanghai urban
atmosphere posed low noncancer risk through inhalation. However, it was noteworthy here that only particle phase PBDEs participated in the assessment and we were not
15
sure whether the risk posed by atmospheric PBDEs (gas plus particle) exceeded the threshold. Specifically, BDE-47 and BDE-99 mainly existed in gas phase, were probably more toxic and bioaccumulative than other congeners (Darnerud, 2003). Furthermore, we only measured 13 PBDE congeners, neglecting risk caused by substantial octa -BDE and deca --BDE in particles, and other ways of exposure like ingestion, dermal
20
contact were not considered, either. Thus, it was not to suggest that the occurrence of particulate PBDEs in shanghai was not an issue; rather, we advocated further studies that measuring of more PBDE congeners in not only particle phase but gas phase in relation to health risk assessment.
4 Summary and conclusions 25
deposit-AMTD
8, 12955–12992, 2015PBDEs size distribution and
health impact
Y. Lyu et al.
Title Page
Abstract Introduction
Conclusions References
Tables Figures
◭ ◮
◭ ◮
Back Close
Full Screen / Esc
Printer-friendly Version Interactive Discussion
Discussion
P
a
per
|
Discussion
P
a
per
|
Discussion
P
a
per
|
Discussion
P
a
per
|
ing in respiratory tract. The particle-size distribution of PBDEs were bimodal distribu-tion with one peak at fine size fracdistribu-tions and the second peak at coarse size fracdistribu-tions. The peaks intensities were associated the molecular weights of PBDEs. The possi-ble reasons were expounded by the parameters such as physicochemical properties of PBDEs, meteorological factors and the emission source. Adsorption and
absorp-5
tion mechanisms respectively played the crucial roles in highly and lightly brominated congeners. Most PBDEs were predominantly distributed in small particles, which con-tributed the majority of PBDEs deposition fluxes in the human respiratory tract. Total
de-position fluxes of targetΣ13PBDE in the respiratory tract was calculated at 26.8 ng h−1.
The non-cancer risk of PBDEs from inhaling particles in Shanghai urban atmosphere
10
showed somewhat low. Further studies will be focused on the investigations of fine or ultrafine particles as transporters of toxic compounds from the atmosphere to the respiratory tract, and the evaluations of exposure risks to ultrafine particles in the at-mosphere.
Acknowledgements. This work was supported by the National Natural Science Foundation of
15
China (Nos. 21577021, 21177025, 21377028, 21277082, 41475109), the Excellent Academic Leader Program (No. 14XD1400600), FP720 project (AMIS, IRSES-GA-2011) and the program for New Century Excellent Talents in University (NCET-13-0349).
References
Alaee, M., Arias, P., Sjodin, A., and Bergman, A.: An overview of commercially used
bromi-20
nated flame retardants, their applications, their use patterns in different countries/regions and possible modes of release, Environ. Int., 29, 683–689, 2003.
Aubin, D. G. and Abbatt, J. P.: Laboratory measurements of thermodynamics of adsorption of small aromatic gases ton-hexane soot surfaces, Environ. Sci. Technol., 40, 179–187, 2006. Besis, A. and Samara, C.: Polybrominated diphenyl ethers (PBDEs) in the indoor and outdoor
25
AMTD
8, 12955–12992, 2015PBDEs size distribution and
health impact
Y. Lyu et al.
Title Page
Abstract Introduction
Conclusions References
Tables Figures
◭ ◮
◭ ◮
Back Close
Full Screen / Esc
Printer-friendly Version Interactive Discussion
Discussion
P
a
per
|
Discussion
P
a
per
|
Discussion
P
a
per
|
Discussion
P
a
per
|
Besis, A., Botsaropoulou, E., Voutsa, D., and Samara, C.: Particle-size distribution of polybromi-nated diphenyl ethers (PBDEs) in the urban agglomeration of Thessaloniki, northern Greece, Atmos. Environ., 104, 176–185, 2015.
Betts, K. S.: Unwelcome guest: PBDEs in indoor dust, Environ. Health Perspect., 116, A202– A208, 2008.
5
Bezares-Cruz, J., Jafvert, C. T., and Hua, I.: Solar photodecomposition of decabromodiphenyl ether: products and quantum yield, Environ. Sci. Technol., 38, 4149–4156, 2004.
Bi, X., Sheng, G., Peng, P. A., Chen, Y., and Fu, J.: Size distribution ofn-alkanes and polycyclic aromatic hydrocarbons (PAHs) in urban and rural atmospheres of Guangzhou, China, Atmos. Environ., 39, 477–487, 2005.
10
Castro-Jimenez, J., Mariani, G., Vives, I., Skejo, H., Umlauf, G., Zaldivar, J. M., Dueri, S., Mes-siaen, G., and Laugier, T.: Atmospheric concentrations, occurrence and deposition of per-sistent organic pollutants (POPs) in a Mediterranean coastal site (Etang de Thau, France), Environ. Pollut., 159, 1948–1956, 2011.
Cetin, B. and Odabasi, M.: Atmospheric concentrations and phase partitioning of
polybromi-15
nated diphenyl ethers (PBDEs) in Izmir, Turkey, Chemosphere, 71, 1067–1078, 2008. Cousins, I. T. and Mackay, D.: Gas–particle partitioning of organic compounds and its
interpre-tation using relative solubilities, Environ. Sci. Technol., 35, 643–647, 2001.
Darnerud, P. O.: Toxic effects of brominated flame retardants in man and in wildlife, Environ. Int., 29, 841–853, 2003.
20
de Wit, C. A.: An overview of brominated flame retardants in the environment, Chemosphere, 46, 583–624, 2002.
Dong, Y., Fu, S., Zhang, Y., Nie, H., and Li, Z.: Polybrominated diphenyl ethers in atmosphere from three different typical industrial areas in Beijing, China, Chemosphere, 123, 33–42, 2015.
25
Duan, J. C., Bi, X. H., Tan, J. H., Sheng, G. Y., and Fu, J. M.: Seasonal variation on size distribution and concentration of PAHs in Guangzhou city, China, Chemosphere, 67, 614– 622, 2007.
Eriksson, J., Green, N., Marsh, G., and Bergman, A.: Photochemical decomposition of 15 poly-brominated diphenyl ether congeners in methanol/water, Environ. Sci. Technol., 38, 3119–
30
AMTD
8, 12955–12992, 2015PBDEs size distribution and
health impact
Y. Lyu et al.
Title Page
Abstract Introduction
Conclusions References
Tables Figures
◭ ◮
◭ ◮
Back Close
Full Screen / Esc
Printer-friendly Version Interactive Discussion
Discussion
P
a
per
|
Discussion
P
a
per
|
Discussion
P
a
per
|
Discussion
P
a
per
|
Finizio, A., Mackay, D., Bidleman, T., and Harner, T.: Octanol-air partition coefficient as a pre-dictor of partitioning of semi-volatile organic chemicals to aerosols, Atmos. Environ., 31, 2289–2296, 1997.
Geiser, M., Rothen-Rutishauser, B., Kapp, N., Schurch, S., Kreyling, W., Schulz, H., Semm-ler, M., Hof, V. I., Heyder, J., and Gehr, P.: Ultrafine particles cross cellular membranes by
5
nonphagocytic mechanisms in lungs and in cultured cells, Environ. Health Perspect., 113, 1555–1560, 2005.
Gouin, T., Thomas, G. O., Cousins, I., Barber, J., Mackay, D., and Jones, K. C.: Air-surface exchange of polybrominated biphenyl ethers and polychlorinated biphenyls, Environ. Sci. Technol., 36, 1426–1434, 2002.
10
Hale, R. C., Alaee, M., Manchester-Neesvig, J. B., Stapleton, H. M., and Ikonomou, M. G.: Polybrominated diphenyl ether flame retardants in the North American environment, Environ. Int., 29, 771–779, 2003.
Harner, T. and Bidleman, T. F.: Octanol-air partition coefficient for describing particle/gas parti-tioning of aromatic compounds in urban air, Environ. Sci. Technol., 32, 1494–1502, 1998.
15
Harner, T. and Shoeib, M.: Measurements of octanol-air partition coefficients (K-OA) for poly-brominated diphenyl ethers (PBDEs): predicting partitioning in the environment, J. Chem. Eng. Data, 47, 228–232, 2002.
Harrad, S., de Wit, C. A., Abdallah, M. A.-E., Bergh, C., Björklund, J. A., Covaci, A., Darnerud, P. O., de Boer, J., Diamond, M., and Huber, S.: Indoor contamination with
hexabro-20
mocyclododecanes, polybrominated diphenyl ethers, and perfluoroalkyl compounds: an im-portant exposure pathway for people?, Environ. Sci. Technol., 44, 3221–3231, 2010. Hoh, E. and Hites, R. A.: Brominated flame retardants in the atmosphere of the East-Central
United States, Environ. Sci. Technol., 39, 7794–7802, 2005.
International Commission on Radiological Protection, I.: ICRP Publication 66: Human
Respira-25
tory Tract Model for Radiological Protection, 66, Elsevier Health Sciences, New York, USA, 1995.
Kajiwara, N., Noma, Y., and Takigami, H.: Photolysis studies of technical decabromodiphenyl ether (DecaBDE) and ethane (DeBDethane) in plastics under natural sunlight, Environ. Sci. Technol., 42, 4404–4409, 2008.
30
AMTD
8, 12955–12992, 2015PBDEs size distribution and
health impact
Y. Lyu et al.
Title Page
Abstract Introduction
Conclusions References
Tables Figures
◭ ◮
◭ ◮
Back Close
Full Screen / Esc
Printer-friendly Version Interactive Discussion
Discussion
P
a
per
|
Discussion
P
a
per
|
Discussion
P
a
per
|
Discussion
P
a
per
|
Kavouras, I. G., Lawrence, J., Koutrakis, P., Stephanou, E. G., and Oyola, P.: Measurement of particulate aliphatic and polynuclear aromatic hydrocarbons in Santiago de Chile: source reconciliation and evaluation of sampling artifacts, Atmos. Environ., 33, 4977–4986, 1999. Kawanaka, Y., Matsumoto, E., Sakamoto, K., Wang, N., and Yun, S. J.: Size distributions of
mutagenic compounds and mutagenicity in atmospheric particulate matter collected with
5
a low-pressure cascade impactor, Atmos. Environ., 38, 2125–2132, 2004.
Kemmlein, S., Herzke, D., and Law, R. J.: Brominated flame retardants in the European chem-icals policy of REACH – regulation and determination in materials, J. Chromatogr. A, 1216, 320–333, 2009.
La Guardia, M. J., Hale, R. C., and Harvey, E.: Detailed polybrominated diphenyl ether (PBDE)
10
congener composition of the widely used penta-, octa-, and deca-PBDE technical flame-retardant mixtures, Environ. Sci. Technol., 40, 6247–6254, 2006.
Larsen, R. K. and Baker, J. E.: Source apportionment of polycyclic aromatic hydrocarbons in the urban atmosphere: a comparison of three methods, Environ. Sci. Technol., 37, 1873–1881, 2003.
15
Lee, R. G. M., Thomas, G. O., and Jones, K. C.: PBDEs in the atmosphere of three locations in Western Europe, Environ. Sci. Technol., 38, 699–706, 2004.
Li, P. F., Li, X., Yang, C. Y., Wang, X. J., Chen, J. M., and Collett, J. L.: Fog water chemistry in Shanghai, Atmos. Environ., 45, 4034–4041, 2011.
Li, X., Li, P., Yan, L., Chen, J., Cheng, T., and Xu, S.: Characterization of polycyclic aromatic
20
hydrocarbons in fog-rain events, J. Environ. Monit., 13, 2988–2993, 2011.
Li, Y., Lin, T., Wang, F., Ji, T., and Guo, Z.: Seasonal variation of polybrominated diphenyl ethers in PM2.5aerosols over the East China Sea, Chemosphere, 119, 675–681, 2015.
Lohmann, R. and Lammel, G.: Adsorptive and absorptive contributions to the gas-particle partitioning of polycyclic aromatic hydrocarbons: state of knowledge and recommended
25
parametrization for modeling, Environ. Sci. Technol., 38, 3793–3803, 2004.
Lohmann, R., Gioia, R., Eisenreich, S. J., and Jones, K. C.: Assessing the importance of ab-and adsorption to the gas-particle partitioning of PCDD/Fs, Atmos. Environ., 41, 7767–7777, 2007.
Luo, P., Bao, L.-J., Wu, F.-C., Li, S.-M., and Zeng, E. Y.: Health risk characterization for
resi-30
AMTD
8, 12955–12992, 2015PBDEs size distribution and
health impact
Y. Lyu et al.
Title Page
Abstract Introduction
Conclusions References
Tables Figures
◭ ◮
◭ ◮
Back Close
Full Screen / Esc
Printer-friendly Version Interactive Discussion
Discussion
P
a
per
|
Discussion
P
a
per
|
Discussion
P
a
per
|
Discussion
P
a
per
|
Luo, P., Ni, H. G., Bao, L. J., Li, S. M., and Zeng, E. Y.: Size distribution of airborne particle-bound polybrominated diphenyl ethers and its implications for dry and wet deposition, Envi-ron. Sci. Technol., 48, 13793–13799, 2014b.
Lv, Y., Li, X., Xu, T. T., Cheng, T. T., Yang, X., Chen, J. M., Linuma, Y., and Herrmann, H.: Size distributions of polycyclic aromatic hydrocarbons in urban atmosphere: sorption mechanism
5
and source contributions to respiratory deposition, Atmos. Chem. Phys. Discuss., 15, 20811– 20850, doi:10.5194/acpd-15-20811-2015, 2015.
Mandalakis, M., Besis, A., and Stephanou, E. G.: Particle-size distribution and gas/particle par-titioning of atmospheric polybrominated diphenyl ethers in urban areas of Greece, Environ. Pollut., 157, 1227–1233, 2009.
10
Marklund, A., Andersson, B., and Haglund, P.: Screening of organophosphorus compounds and their distribution in various indoor environments, Chemosphere, 53, 1137–1146, 2003. Moller, A., Xie, Z. Y., Cai, M. H., Zhong, G. C., Huang, P., Cai, M. G., Sturm, R., He, J. F., and
Ebinghaus, R.: Polybrominated diphenyl ethers vs. alternate brominated flame retardants and dechloranes from East Asia to the Arctic, Environ. Sci. Technol., 45, 6793–6799, 2011.
15
Muenhor, D., Harrad, S., Ali, N., and Covaci, A.: Brominated flame retardants (BFRs) in air and dust from electronic waste storage facilities in Thailand, Environ. Int., 36, 690–698, 2010. Okonski, K., Degrendele, C., Melymuk, L., Landlova, L., Kukucka, P., Vojta, S., Kohoutek, J.,
Cupr, P., and Klanova, J.: Particle size distribution of halogenated flame retardants and impli-cations for atmospheric deposition and transport, Environ. Sci. Technol., 48, 14426–14434,
20
2014.
Pandis, S. N., Harley, R. A., Cass, G. R., and Seinfeld, J. H.: Secondary organic aerosol forma-tion and transport, Atmos. Environ., 26, 2269–2282, 1992.
Pankow, J. F.: Review and comparative-analysis of the theories on partitioning between the gas and aerosol particulate phases in the atmosphere, Atmos. Environ., 21, 2275–2283, 1987.
25
Pankow, J. F.: An absorption-model of gas-particle partitioning of arganic-compounds in the atmosphere, Atmos. Environ., 28, 185–188, 1994a.
Pankow, J. F.: An absorption-model of the gas aerosol partitioning involved in the formation of secondary organic aerosol, Atmos. Environ., 28, 189–193, 1994b.
Pankow, J. F. and Bidleman, T. F.: Interdependence of the slopes and intercepts from log log
30
AMTD
8, 12955–12992, 2015PBDEs size distribution and
health impact
Y. Lyu et al.
Title Page
Abstract Introduction
Conclusions References
Tables Figures
◭ ◮
◭ ◮
Back Close
Full Screen / Esc
Printer-friendly Version Interactive Discussion
Discussion
P
a
per
|
Discussion
P
a
per
|
Discussion
P
a
per
|
Discussion
P
a
per
|
Rudich, Y., Donahue, N. M., and Mentel, T. F.: Aging of organic aerosol: bridging the gap be-tween laboratory and field studies, Annu. Rev. Phys. Chem., 58, 321–352, 2007.
Söderström, G., Sellström, U., de Wit, C. A., and Tysklind, M.: Photolytic debromination of decabromodiphenyl ether (BDE 209), Environ. Sci. Technol., 38, 127–132, 2004.
Shen, X., Zhao, Y., Chen, Z., and Huang, D.: Heterogeneous reactions of volatile organic
com-5
pounds in the atmosphere, Atmos. Environ., 68, 297–314, 2013.
Shi, J. and Cui, L. L.: Characteristics of high impact weather and meteorological disaster in Shanghai, China, Nat. Hazards, 60, 951–969, 2012.
Su, Y. S., Hung, H., Brice, K. A., Su, K., Alexandrou, N., Blanchard, P., Chan, E., Sverko, E., and Fellin, P.: Air concentrations of polybrominated diphenyl ethers (PBDEs) in 2002–2004
10
at a rural site in the Great Lakes, Atmos. Environ., 43, 6230–6237, 2009.
Tian, M., Chen, S.-J., Wang, J., Zheng, X.-B., Luo, X.-J., and Mai, B.-X.: Brominated flame re-tardants in the atmosphere of E-waste and rural sites in Southern China: seasonal variation, temperature dependence, and gas-particle partitioning, Environ. Sci. Technol., 45, 8819– 8825, 2011.
15
Tittlemier, S. A., Halldorson, T., Stern, G. A., and Tomy, G. T.: Vapor pressures, aqueous sol-ubilities, and Henry’s law constants of some brominated flame retardants, Environ. Toxicol. Chem., 21, 1804–1810, 2002.
Venkataraman, C., Thomas, S., and Kulkarni, P.: Size distributions of polycyclic aromatic hydro-carbons – gas/particle partitioning to urban aerosols, J. Aerosol Sci., 30, 759–770, 1999.
20
Volckens, J. and Leith, D.: Effects of sampling bias on gas–particle partitioning of semi-volatile compounds, Atmos. Environ., 37, 3385–3393, 2003.
Wang, J., Ho, S. S. H., Cao, J., Huang, R., Zhou, J., Zhao, Y., Xu, H., Liu, S., Wang, G., Shen, Z., and Han, Y.: Characteristics and major sources of carbonaceous aerosols in PM2.5 from Sanya, China, Sci. Total Environ., 530–531, 110–119, 2015.
25
Wang, X. M., Ding, X., Mai, B. X., Xie, Z. Q., Xiang, C. H., Sun, L. G., Sheng, G. Y., Fu, J. M., and Zeng, E. Y.: Polyhrominated diphenyl ethers in airborne particulates collected during a research expedition from the Bohai Sea to the Arctic, Environ. Sci. Technol., 39, 7803– 7809, 2005.
Wang, Z.-Y., Zeng, X.-L., and Zhai, Z.-C.: Prediction of supercooled liquid vapor pressures and
30
AMTD
8, 12955–12992, 2015PBDEs size distribution and
health impact
Y. Lyu et al.
Title Page
Abstract Introduction
Conclusions References
Tables Figures
◭ ◮
◭ ◮
Back Close
Full Screen / Esc
Printer-friendly Version Interactive Discussion
Discussion
P
a
per
|
Discussion
P
a
per
|
Discussion
P
a
per
|
Discussion
P
a
per
|
Wensing, M., Uhde, E., and Salthammer, T.: Plastics additives in the indoor environment – flame retardants and plasticizers, Sci. Total Environ., 339, 19–40, 2005.
Wilford, B. H., Harner, T., Zhu, J. P., Shoeib, M., and Jones, K. C.: Passive sampling survey of polybrominated diphenyl ether flame retardants in indoor and outdoor air in Ottawa, Canada: implications for sources and exposure, Environ. Sci. Technol., 38, 5312–5318, 2004.
5
Yang, M., Jia, H. L., Ma, W. L., Qi, H., Cui, S., and Li, Y. F.: Levels, compositions, and gas-particle partitioning of polybrominated diphenyl ethers and dechlorane plus in air in a Chinese northeastern city, Atmos. Environ., 55, 73–79, 2012.
Yang, M., Qi, H., Jia, H. L., Ren, N. Q., Ding, Y. S., Ma, W. L., Liu, L. Y., Hung, H., Sverko, E., and Li, Y. F.: Polybrominated diphenyl ethers in air across China: levels, compositions, and
10
gas-particle partitioning, Environ. Sci. Technol., 47, 8978–8984, 2013.
Yu, H. and Yu, J. Z.: Polycyclic aromatic hydrocarbons in urban atmosphere of Guangzhou, China: size distribution characteristics and size-resolved gas-particle partitioning, Atmos. Environ., 54, 194–200, 2012.
Yu, Z., Liao, R., Li, H., Mo, L., Zeng, X., Sheng, G., and Fu, J.: Particle-bound Dechlorane Plus
15
and polybrominated diphenyl ethers in ambient air around Shanghai, China, Environ. Pollut., 159, 2982–2988, 2011.
Zhang, B. Z., Guan, Y. F., Li, S. M., and Zeng, E. Y.: Occurrence of Polybrominated Diphenyl Ethers in Air and Precipitation of the Pearl River Delta, South China: annual Washout Ratios and Depositional Rates, Environ. Sci. Technol., 43, 9142–9147, 2009.
20
Zhang, B. Z., Zhang, K., Li, S. M., Wong, C. S., and Zeng, E. Y.: Size-dependent dry deposi-tion of airborne polybrominated diphenyl ethers in urban Guangzhou, China, Environ. Sci. Technol., 46, 7207–7214, 2012.
Zhang, K., Zhang, B. Z., Li, S. M., Wong, C. S., and Zeng, E. Y.: Calculated respiratory exposure to indoor size-fractioned polycyclic aromatic hydrocarbons in an urban environment, Sci.
25
Total Environ., 431, 245–251, 2012.