ACPD
10, 31039–31081, 2010Adsorption activation by mineral dust CCN
P. Kumar et al.
Title Page
Abstract Introduction
Conclusions References
Tables Figures
◭ ◮
◭ ◮
Back Close
Full Screen / Esc
Printer-friendly Version Interactive Discussion
Discussion
P
a
per
|
Dis
cussion
P
a
per
|
Discussion
P
a
per
|
Discussio
n
P
a
per
|
Atmos. Chem. Phys. Discuss., 10, 31039–31081, 2010 www.atmos-chem-phys-discuss.net/10/31039/2010/ doi:10.5194/acpd-10-31039-2010
© Author(s) 2010. CC Attribution 3.0 License.
Atmospheric Chemistry and Physics Discussions
This discussion paper is/has been under review for the journal Atmospheric Chemistry and Physics (ACP). Please refer to the corresponding final paper in ACP if available.
Measurements of cloud condensation
nuclei activity and droplet activation
kinetics of fresh unprocessed regional
dust samples and minerals
P. Kumar1, I. N. Sokolik2, and A. Nenes1,2
1
School of Chemical and Biomolecular Engineering, Georgia Institute of Technology, Atlanta, GA 30332, USA
2
School of Earth and Atmospheric Sciences, Georgia Institute of Technology, Atlanta, GA 30332, USA
Received: 28 November 2010 – Accepted: 3 December 2010 – Published: 21 December 2010
Correspondence to: A. Nenes ([email protected])
ACPD
10, 31039–31081, 2010Adsorption activation by mineral dust CCN
P. Kumar et al.
Title Page
Abstract Introduction
Conclusions References
Tables Figures
◭ ◮
◭ ◮
Back Close
Full Screen / Esc
Printer-friendly Version Interactive Discussion
Discussion
P
a
per
|
Dis
cussion
P
a
per
|
Discussion
P
a
per
|
Discussio
n
P
a
per
|
Abstract
This study reports laboratory measurements of cloud condensation nuclei (CCN) activ-ity and droplet activation kinetics of aerosols dry-generated from clays, calcite, quartz, and desert soil samples from Northern Africa, East Asia/China, and Northern America. Based on the observed dependence of critical supersaturation,sc, with particle dry
di-5
ameter,Ddry, we find that FHH adsorption activation theory is a far more suitable frame-work for describing fresh dust CCN activity than K ¨ohler theory. One set of FHH param-eters (AFHH∼2.25±0.75,BFHH∼1.20±0.10) can adequately reproduce the measured
CCN activity for all species considered, and also explains the large range of hygroscop-icities reported in the literature. Based on threshold droplet growth analysis, mineral
10
dust aerosols were found to display retarded activation kinetics compared to ammo-nium sulfate. Comprehensive simulations of mineral dust activation and growth in the CCN instrument suggest that this retardation is equivalent to a reduction of the water vapor uptake coefficient (relative to that for calibration ammonium sulfate aerosol) by 30–80%. These results suggest that dust particles do not require deliquescent material
15
to act as CCN in the atmosphere.
1 Introduction
Clouds are an important component of the Earth’s radiation budget and hydrological cycle. Even small changes in cloud properties may have significant impacts on climate (Collins et al., 1994). Perturbations in aerosol loadings can alter cloud properties,
20
giving rise to the aerosol indirect effect on climate. Aerosol effects on clouds constitute one of the most uncertain components of anthropogenic climate change (Forster et al., 2007). Of all atmospheric aerosol species, mineral aerosol (or dust) remains the least understood component in the study of aerosol-cloud-climate interactions. It has been well recognized that dust plays an important role in cold cloud processes because
25
ACPD
10, 31039–31081, 2010Adsorption activation by mineral dust CCN
P. Kumar et al.
Title Page
Abstract Introduction
Conclusions References
Tables Figures
◭ ◮
◭ ◮
Back Close
Full Screen / Esc
Printer-friendly Version Interactive Discussion
Discussion
P
a
per
|
Dis
cussion
P
a
per
|
Discussion
P
a
per
|
Discussio
n
P
a
per
|
can also affect warm clouds by acting as Cloud Condensation Nuclei (CCN), changes of which affect their radiative (Twomey, 1974) and precipitation properties (Rosenfeld et al., 2001).
In general, the ability of dust particles to serve as CCN depends on their miner-alogy, size, morphology, and atmospheric processing. Quantitative understanding of
5
the interactions of dust with water vapor is complex because of its varying source-dependent mineralogical composition and aging during its atmospheric residence. Min-eral aerosol may constitute of iron oxides (e.g., hematite, goethite), carbonates (e.g., calcite, dolomite), quartz, and clays (e.g., kaolinite, illite, and montmorillonite) (Lafon et al., 2006; Chou et al., 2008; Coz et al., 2009; Twohy et al., 2009). Dust
parti-10
cles mainly originate from arid and semi-arid regions, with an annual emission of ap-proximately 1000–5000 Tg (Schuttlefield et al., 2007). Differences in parent soils, and emission and transport processes cause substantial variability in size-resolved compo-sition and morphology of dust particles (Sokolik et al., 2001; Jeong and Sokolik, 2008). Dust particles can remain suspended in the atmosphere for up to several weeks and
15
can be transported over large distances downwind from source regions. During their transport, dust particles (especially the carbonate fraction which can comprise up to 30% of the total mass), provides reaction sites for heterogeneous chemical reactions with atmospheric trace gases and pollutants (Levin et al., 1996), resulting in modified dust properties, such as enhanced hygroscopicity (Hatch et al., 2008). However, not
20
all dust particles undergo aging. Depending on transport routes of dust plumes and environmental conditions, dust particles can remain unprocessed and have the same properties as freshly emitted dust in source regions. Thus, it is important to understand the CCN activity of fresh dust particles as well as aged dust.
To describe the CCN activity of freshly emitted dust, two phenomena must be
ac-25
ACPD
10, 31039–31081, 2010Adsorption activation by mineral dust CCN
P. Kumar et al.
Title Page
Abstract Introduction
Conclusions References
Tables Figures
◭ ◮
◭ ◮
Back Close
Full Screen / Esc
Printer-friendly Version Interactive Discussion
Discussion
P
a
per
|
Dis
cussion
P
a
per
|
Discussion
P
a
per
|
Discussio
n
P
a
per
|
2007; Sorjamaa and Laaksonen, 2007; Kumar et al., 2009a). The formulation of Hen-son (2007) used the BET (Brunauer Emmett Teller) (Brunauer et al., 1938) adsorption isotherm, while Sorjamaa and Laaksonen (2007) used the multilayer FHH (Frenkel, Halsey and Hill) adsorption isotherm with two adjustable parameters (AFHHandBFHH).
Based on analysis of published data on dust-water interactions, Kumar et al. (2009b)
5
showed the importance of including water adsorption effects when describing the hy-groscopic and CCN behavior of mineral aerosol. Kumar et al. (2009a) addressed the need to account for adsorption activation in atmospheric models by developing a cloud droplet formation parameterization where the CCN constitutes an external mixture of soluble aerosol (that follow KT) and insoluble aerosol (that follow FHH adsorption
ac-10
tivation theory, FHH-AT). Here we report new measurements to further support the dust-CCN parameterization developed by Kumar et al. (2009a).
Past studies have already demonstrated that both regional dusts as well as individ-ual clays can interact with water and act as effective CCN. For example, Koehler et al. (2009) and Herich et al. (2009) measured CCN activation of two types of regional dust
15
samples (Northern Africa and Arizona Test Dust) and several clays (kaolinite, illite, and montmorillonite), respectively, at water vapor supersaturation relevant to atmospheric conditions. These studies, however, parameterized the observed hygroscopicity using a KT framework in terms of a hygroscopicity parameter, κ (Petters and Kriedenweis, 2007). This approach was evaluated by Kumar et al. (2009b), who, after examining the
20
relationship betweensc andDdryfor the published dust samples suggested that FHH-AT is a better description of fresh dust CCN activity as thesc−Ddry exponents deter-mined from FHH-AT were closer to observations than from KT. Furthermore, no study to date has accounted for non-sphericity effects in the CCN activity relationships, even if it is well known that dust particles are non-spherical (e.g., Okada et al., 2001; Chou
25
ACPD
10, 31039–31081, 2010Adsorption activation by mineral dust CCN
P. Kumar et al.
Title Page
Abstract Introduction
Conclusions References
Tables Figures
◭ ◮
◭ ◮
Back Close
Full Screen / Esc
Printer-friendly Version Interactive Discussion
Discussion
P
a
per
|
Dis
cussion
P
a
per
|
Discussion
P
a
per
|
Discussio
n
P
a
per
|
(such as for dust CCN), this approach may not suffice causing biases in measured CCN activity towards higher hygroscopicity (Petters et al., 2007). A comprehensive analysis of charging efficiency (e.g., Moore et al., 2010) needs to be considered to avoid such biases in observed hygroscopicity.
In this study, we investigate the CCN-relevant properties of clays and several dust
5
samples representative of major regional dust sources. Measurements were carried out with a Droplet Measurement Technologies Continuous-Flow Streamwise Thermal Gradient CCN (CFSTGC) counter (Roberts and Nenes, 2005; Lance et al., 2006). The CCN activation behavior of mineral aerosols generated from Northern American, African, and East Asian desert soils as well as individual clays (illite and
montmoril-10
lonite), calcite (CaCO3), and quartz (SiO2) are studied. The effects of multiple charging and shape (non-sphericity) on the sizing of particles and activation curves are exam-ined. The experimental results are used to infer the dominant activation physics (KT or FHH-AT) and determine the appropriate adsorption parameters (e.g.,AFHH,BFHH) that describe the hygroscopicity of fresh dust for the use in droplet activation
parameteri-15
zations of Kumar et al. (2009a). Finally, using the method of threshold droplet growth analysis (TDGA, e.g., Asa-Awuku et al., 2010; Padr ´o et al., 2010), potential retarda-tions in the activation kinetics of dust (compared to calibration aerosol) are identified. A comprehensive simulation of dust activation in the CCN instrument is then performed to parameterize these kinetic delays in terms of changes in the effective water vapor
20
uptake coefficient.
2 Measurements and data analysis
2.1 Regional dust samples and individual minerals
Aerosols from regional soil samples and individual minerals/clays were generated and analyzed in this study. Table 1 provides a summary of the analyzed samples, including
25
ACPD
10, 31039–31081, 2010Adsorption activation by mineral dust CCN
P. Kumar et al.
Title Page
Abstract Introduction
Conclusions References
Tables Figures
◭ ◮
◭ ◮
Back Close
Full Screen / Esc
Printer-friendly Version Interactive Discussion
Discussion
P
a
per
|
Dis
cussion
P
a
per
|
Discussion
P
a
per
|
Discussio
n
P
a
per
|
source regions of Northern Africa and East Asia. Commercially available Arizona Test Dust (ATD) was used as representative of North America soil. Individual minerals/clays used to generate aerosol were analyzed as purchased, with no physical and chemical treatments to resemble atmospheric behaviors.
2.2 Measurements of CCN activity
5
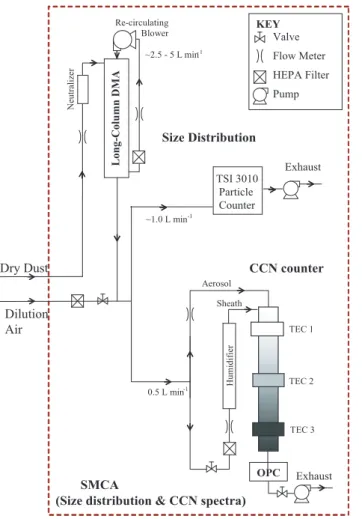
The measurement setup consists of three sections: aerosol generation, particle size selection, and CCN measurement (Fig. 1). To generate aerosol, approximately 3 g of the desired sample were placed in a 1000 ml sealed Erlenmeyer flask which is con-nected to a Burrell-Wrist Action Shaker (Model 75). Compressed filtered air is intro-duced into the flask that generates polydisperse fine aerosols by mechanical
disin-10
tegration (“saltation”) with a distribution that resembles the size distributions of dust plumes generated in the natural source regions (Lafon et al., 2006).
The dry aerosol is then sent to the electrostatic classifier for particle size selection (TSI Model 3080) with a Differential Mobility Analyzer (DMA, TSI Model 3081). Before entering the classifier, aerosols are passed through an impactor to remove
supermicro-15
meter size particles and then charged with a series of Kr-85 neutralizers. The particles are then classified in the DMA by their electrical mobility set by the voltage applied to the DMA. The Sheath flow rate in the DMA is set to 2.3 l min−1, and the monodis-perse flow is set to 0.45 l min−1. The classified aerosol flow is mixed with filtered air and then sampled by a Condensation Particle Counter (CPC, TSI Model 3010), and
20
a Droplet Measurement Technologies Continuous-Flow Streamwise Thermal Gradient CCN (CFSTGC) chamber.
The CPC measures the total concentration of aerosol, or condensation nuclei (CN) present in the monodisperse stream. The fraction of aerosol acting as CCN is mea-sured by exposing particles to a constant water vapor supersaturation within the
CF-25
ACPD
10, 31039–31081, 2010Adsorption activation by mineral dust CCN
P. Kumar et al.
Title Page
Abstract Introduction
Conclusions References
Tables Figures
◭ ◮
◭ ◮
Back Close
Full Screen / Esc
Printer-friendly Version Interactive Discussion
Discussion
P
a
per
|
Dis
cussion
P
a
per
|
Discussion
P
a
per
|
Discussio
n
P
a
per
|
supersaturation, s, which reaches maximum at the column centerline. CCN flowing along the column centerline are activated to cloud droplets and are counted at the exit with an optical particle counter (OPC). Each value of ∆T generates a unique super-saturation value, which in this study varied between 0.15% and 1%. CCN activity is characterized by the dry activation diameter,Ddry, which corresponds to the minimum
5
dry particle diameter that activates at the certain supersaturation of interest,sc. Ddryis found by expressing the ratio of CCN to CN concentration as a function of dry particle diameter, and, determining the diameter for which 50% of the classified aerosol acts as CCN.
The calibration of the instrument supersaturation is determined from the Ddry of
10
(NH4)2SO4calibration aerosol at a given∆T. (NH4)2SO4aerosol was generated by at-omizing an aqueous solution and subsequently drying the droplet stream with a series of silica-gel diffusion dryers. Ddryof (NH4)2SO4is then related tos by applying K ¨ohler theory, assuming that (NH4)2SO4has a shape factor of 1.04 in the DMA (Kuwata and Kondo, 2009), density of 1760 kg m−3, surface tension of water (calculated at the
av-15
erage column temperature), molar mass of 0.132 kg mol−1, and osmotic coefficients calculated with the Pitzer activity coefficient model (Pitzer and Mayorga, 1973). A re-lationship between∆T vs. instrument supersaturation is determined by repeating the above calibration procedure over a range of∆T. This relationship is then used in all dust activation experiments. Calibration is repeated throughout the measurements,
20
and exhibits little variability (about 5% relative uncertainty in instrument supersatura-tion).
Size-resolved CCN activity is carried out using the Scanning Mobility CCN Analysis (SMCA) (Moore et al., 2010), where the DMA used for aerosol classification is oper-ated in scanning voltage mode. This allows the concurrent determination of aerosol
25
ACPD
10, 31039–31081, 2010Adsorption activation by mineral dust CCN
P. Kumar et al.
Title Page
Abstract Introduction
Conclusions References
Tables Figures
◭ ◮
◭ ◮
Back Close
Full Screen / Esc
Printer-friendly Version Interactive Discussion
Discussion
P
a
per
|
Dis
cussion
P
a
per
|
Discussion
P
a
per
|
Discussio
n
P
a
per
|
(measured in the optical particle counter of the CCN instrument) as a function of their dry diameter. The dependence of droplet size on the supersaturation profile and dust dry particle size is used to study the dust activation kinetics.
2.3 Data analysis methodology
The measurement ofDdry, and corresponding sc, is fitted with a power law function
5
sc=CDdryx . The experimental exponent,xexp (Kumar et al., 2009b), is then compared against the exponent determined from fits of KT and FHH-AT to the data. The appropri-ateness of each theory is evaluated based on its ability to reproducexexp. According to KT, particles with appreciable hygroscopicity exhibitx=−3/2. In FHH-AT,x depends on the value ofAFHHandBFHHbut generally ranges between−0.80 and−1.20 (Kumar
10
et al., 2009a). The same fitting procedure also determines the adsorption parameters
AFHHandBFHH(for FHH-AT), and the hygroscopicity parameterκ(for KT).
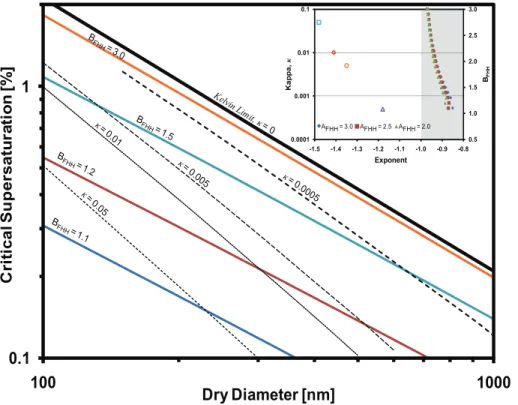
The adsorption parameterBFHH strongly affects the shape of the equilibrium curve
and largely determines the existence and values ofscand critical wet diameter,Dc (de-scribed as the wet diameter of the aerosol particle at the maximum of the equilibrium
15
curve) (Kumar et al., 2009a).AFHHalso affects these parameters, but to a lesser extent
thanBFHH. Figure 2 shows the relationship between Ddry and sc for a range ofBFHH
values computed at surface tension of water equal to 0.072 J m−2, temperature equal to 298.15 K, andAFHH=2.50. LowerBFHHvalues correspond to more hydrophilic dust. AsBFHHapproaches 3.0, particles become less hydrophilic (withx→−1), which
corre-20
sponds to insoluble but wettable particles that follow the Kelvin equation. Similarly for KT, asκ decreases fromκ=0.05 toκ=0 (Fig. 2) particles becomes less hygroscopic causing a decrease in the exponent fromx=−1.5 to x→ −1.0. It can be seen from Fig. 2 that the slopes determined from KT (expressed in terms ofκ) are much steeper than those determined from FHH-AT (expressed in terms ofBFHH). This suggests that
25
ACPD
10, 31039–31081, 2010Adsorption activation by mineral dust CCN
P. Kumar et al.
Title Page
Abstract Introduction
Conclusions References
Tables Figures
◭ ◮
◭ ◮
Back Close
Full Screen / Esc
Printer-friendly Version Interactive Discussion
Discussion
P
a
per
|
Dis
cussion
P
a
per
|
Discussion
P
a
per
|
Discussio
n
P
a
per
|
Droplet activation kinetics of aerosol inside CFSTGC depends on the supersatura-tion profiles, residence time, water vapor uptake coefficient, dry particle size (Nenes et al., 2001; Roberts and Nenes, 2005; Lance et al., 2006), as well as the theory used to describe the equilibrium vapor pressure for the particle (KT or FHH-AT). Ac-tivation kinetics can be characterized by the difference in droplet size, ∆Dw, between
5
dust CCN and (NH4)2SO4 CCN with same sc. A negative ∆Dw implies that mineral aerosol exhibits retarded activation kinetics (the converse is typically not observed). This technique is called threshold droplet growth analysis (TDGA) and has been suc-cessfully used by a number of in-situ and laboratory studies (Asa-Awuku et al., 2010; Padr ´o et al., 2010).
10
We quantitatively describe the growth of dust by simulating the process of droplet nu-cleation and growth within the CCN instrument using the comprehensive computational fluid dynamics model. We use the Lance et al. (2006) model, which numerically simu-lates the temporal and spatial distributions of velocity, pressure, temperature, and water vapor concentration throughout the growth chamber, considering the coupling of
parti-15
cle and gas phases through the release of latent heat and condensation/evaporation of water vapor onto the droplets. The kinetics of dust activation is then parameterized in terms of an effective uptake coefficient, which influences the mass transfer coefficient of water onto the dust CCN. Condensation growth of aerosol is computed based on a size-dependent mass transfer coefficient multiplied by the difference between
gas-20
phase and equilibrium water vapor pressure (Nenes et al., 2001):
Dpd Dp d t =
s−seq ρwRT
4P◦
H2OD
′
vMw+
∆HvMw
4k′
aT ∆H
vρw
RT −1
(1)
whereDp is the droplet diameter, s is the local instrument supersaturation, ρw is the water density,Mwis the molar mass of water,R is the universal gas constant,T is the average column temperature, PH◦
2O is the equilibrium water vapor pressure, and∆Hv
25
ACPD
10, 31039–31081, 2010Adsorption activation by mineral dust CCN
P. Kumar et al.
Title Page
Abstract Introduction
Conclusions References
Tables Figures
◭ ◮
◭ ◮
Back Close
Full Screen / Esc
Printer-friendly Version Interactive Discussion
Discussion
P
a
per
|
Dis
cussion
P
a
per
|
Discussion
P
a
per
|
Discussio
n
P
a
per
|
modified for noncontinuum effects (Fukuta and Walter, 1970)
D′
v=
Dv
1+ 2Dv
αcDp q
2πMw RT
(2)
whereDvis the diffusivity of water vapor in air,αcis the water vapor uptake coefficient,
ka′ is the thermal conductivity of air modified for non-continuum effects,
k′
a=
ka
1+ 2ka
αTDpρacp
q
2πMa
RT
(3)
5
whereMa is the mean molar mass of air, ka is the thermal conductivity of air, ρa is the air density,cpis the heat capacity of air, andαT is thermal accommodation coeffi -cient (equal to 1.0). For insoluble CCN activating according to FHH-AT, the equilibrium supersaturation of the droplet,seq, is given by Kumar et al. (2009a)
seq=exp
4σMw
RT ρwDp−AFHH
Dp−Ddry
2DH2O
!−BFHH
−1 (4)
10
whereσ is the CCN surface tension at the point of activation (Pruppacher and Klett, 1997), Ddry is the dry CCN diameter, DH2O is the diameter of water molecule equal to 2.75 ˚A (Kumar et al., 2009a), and AFHH and BFHH are adsorption parameters con-strained from the activation experiments.
The instrument model was initialized using the appropriate geometric dimensions
15
and operating conditions of DMT CFSTGC (Lance et al., 2006). A computational grid of 200 cells in the radial and 200 cells in the axial direction were used in each simu-lation. A Lagrangian approach is used to determine CCN growth in the CFSTGC by Eq. (1), assuming the particles flow along streamlines occupied by the aerosol region of the chamber (determined from the sheath-aerosol ratio) and grow according to the
ACPD
10, 31039–31081, 2010Adsorption activation by mineral dust CCN
P. Kumar et al.
Title Page
Abstract Introduction
Conclusions References
Tables Figures
◭ ◮
◭ ◮
Back Close
Full Screen / Esc
Printer-friendly Version Interactive Discussion
Discussion
P
a
per
|
Dis
cussion
P
a
per
|
Discussion
P
a
per
|
Discussio
n
P
a
per
|
local water vapor saturation ratio and temperature (Roberts and Nenes, 2005; Lance et al., 2006). The droplet diameter at the exit of the flow chamber is then compared against the measured droplet size distribution, following the binning scheme used in the optical detection of the instrument. The value of uptake coefficient is then inferred by minimizing the discrepancy between predicted and observed droplet distributions in
5
OPC.
3 Results and discussion
3.1 Effects of multiple charging and dust particle shapes
3.1.1 Correction for multiply charged particles in SMCA
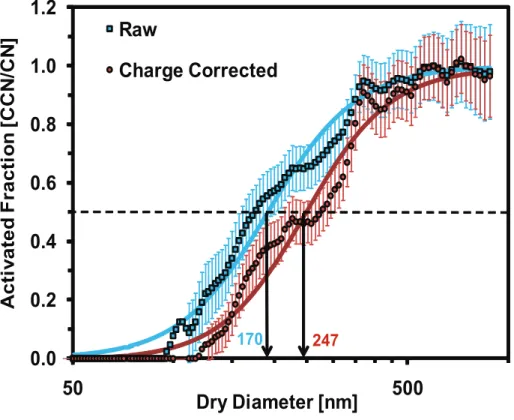
To account for the effect of multiply charged particles in the activation curves and
ob-10
servedDdry, we assume an equilibrium charge distribution for the particles entering the DMA and apply a correction algorithm as described in Moore et al. (2010). The correc-tion algorithm determines the contribucorrec-tion from the multiply charged (+2, +3, +4, +5 and+6 charges) particles to the total particle counts in each size bin for the CN time series and rebins respective contributions to its “true” size bin. The same procedure is
15
applied to the CCN time series. The inversion of the CN, CCN time series determines the activation fraction and henceDdry. To ensure sufficient residence time for attaining equilibrium charge distribution inside the Kr-85 neutralizers, we determine the number of neutralizers beyond which the inverted size distribution does not change. Test re-sults indicate that 3 Kr-85 neutralizers in series (with a total nominal activity of 10 mCi)
20
were sufficient to completely neutralize the surface charges and attain the Boltzmann equilibrium distribution.
The impact of multiply charged particles is shown in Fig. 3, which presents the ac-tivation curves (with and without multiple charging corrections) at 0.30% supersatu-ration for aerosol generated from the Soil 2 sample. Ddry increases from ∼170 nm to
25
ACPD
10, 31039–31081, 2010Adsorption activation by mineral dust CCN
P. Kumar et al.
Title Page
Abstract Introduction
Conclusions References
Tables Figures
◭ ◮
◭ ◮
Back Close
Full Screen / Esc
Printer-friendly Version Interactive Discussion
Discussion
P
a
per
|
Dis
cussion
P
a
per
|
Discussion
P
a
per
|
Discussio
n
P
a
per
|
enhanced at lower supersaturations (e.g.,sc=0.15% andsc=0.20%) that correspond to large particles with a pronounced probability of multiple charging. The uncertainty in the activation efficiency due to counting statistics uncertainty and flow rate variability (expressed as error bars in Fig. 3) were accounted for using the procedure of Moore et al. (2010).
5
3.1.2 Accounting for dust non-sphericity
Dust particles exhibit a variety of complex shapes that are difficult to measure or ex-press in terms of a unique set of parameters or functions. Characterization of dust non-sphericity is often done by either (i) introducing a dynamic shape factor, χ, (de-fined as the ratio of drag force, FD, experienced by the non-spherical particle to that
10
experienced by a volume equivalent sphere when both move at the same velocity in the gas; e.g., DeCarlo et al., 2004), or (ii) providing an Aspect Ratio (AR), defined as the ratio of the longest dimension of particles to the orthogonal shortest length (width). Commonly,χ is obtained by tandem electrical mobility and aerodynamic particle sizing (e.g., DeCarlo et al., 2004; Kuwata and Kondo, 2009) and is an integrated measure of
15
the three-dimensional particle shape. AR is measured with electron microscopy that re-ports two dimensional image projections of particles from which the longest dimension and width are determined (e.g., Kalashnikova and Sokolik, 2004).
Here we assess the effect of dust non-sphericity in CCN activity measurements by considering the range of values of AR orχ reported in the literature for different types
20
of mineral aerosol. A number of recent studies have reported measurements of AR values for species considered in this study. For instance, Chou et al. (2008) report a mean AR equal to 1.7 for Niger dust collected during the AMMA campaign, Kandler et al. (2009) report AR equal to 1.64 for Saharan dust collected over Spain, and Coz et al. (2009) report AR equal to 1.81 for African dust. These AR values are
some-25
ACPD
10, 31039–31081, 2010Adsorption activation by mineral dust CCN
P. Kumar et al.
Title Page
Abstract Introduction
Conclusions References
Tables Figures
◭ ◮
◭ ◮
Back Close
Full Screen / Esc
Printer-friendly Version Interactive Discussion
Discussion
P
a
per
|
Dis
cussion
P
a
per
|
Discussion
P
a
per
|
Discussio
n
P
a
per
|
than 1 µm). Furthermore, the extent of non-sphericity can be affected by the aerosol generation method (Sullivan et al., 2010) which can give rise to very different parti-cle morphologies from those generated with the dry soft-saltation technique used in this study. All factors together can contribute to uncertainty in shape factor for simi-lar aerosol types. For instances for ATD, M ¨ohler et al. (2008) reported χ=1.3 while
5
Endo et al. (1998) reportedχ=1.5. Similarly for illite, Hudson et al. (2008) and M ¨ohler et al. (2008) reportedχ=1.3±0.02 andχ=1.3, respectively. For other clays and
min-erals analyzed in this study such as montmorillonite, Hudson et al. (2008) reported
χ=1.11±0.03, while Hinds (1999) report a value ofχ=1.36 for quartz.
In this study, we use the published range of dust non-sphericity. As most of the
10
recent studies on African and Asian mineral dust aerosol have quantified dust non-sphericity based on AR, we initially started with the Fuchs (1964) approach to convert from AR toχ assuming mineral aerosol as a spheroid. However, we found that us-ing the Fuchs (1964) approach results in much lower values ofχ (∼1.007–1.034) than
those determined from direct measurements ofχ (∼1.11–1.50). According to Davies 15
(1979), sand particles composed of a mixture of different minerals have a dynamic shape factor of 1.3–1.6. Therefore, in this study non-sphericity corrections are per-formed for all species considering χ=1.3±0.2 as this covers all possible values of
measuredχ. Further, we examine the importance of this uncertainty inχ for dust-CCN measurements.
20
Size selection in this study is performed using the DMA that classifies a particle according to its electric mobility. Electrical mobility can then be related to the physical diameter if the number of elementary charges per particle andχ are known (together with the strength of the electric field and other operational parameters in the DMA). Oftenχ is assumed unity. For mineral dust, however,χ >1 which translates into a larger
25
ACPD
10, 31039–31081, 2010Adsorption activation by mineral dust CCN
P. Kumar et al.
Title Page
Abstract Introduction
Conclusions References
Tables Figures
◭ ◮
◭ ◮
Back Close
Full Screen / Esc
Printer-friendly Version Interactive Discussion
Discussion
P
a
per
|
Dis
cussion
P
a
per
|
Discussion
P
a
per
|
Discussio
n
P
a
per
|
Dserelationship. By converting fromDdrytoDse, the aerosol physical size is expressed in terms of the characteristic length responsible for controlling surface water vapor adsorption. Dse is determined by converting the electrical mobility diameter (Dm), to particle volume equivalent diameter (Dve), and from there toDse.
DeterminingDve fromDm
5
Dve is determined fromDm by iterative solution of the dynamic shape factor equation
(DeCarlo et al., 2004):
χ=DmC(Dve)
DveC(Dm)
(5)
whereC(Dm) and C(Dve) are the slip correction factors for Dm and Dve, respectively.
C(Dm) and C(Dve) can be approximated from the correlation of Willeke and Baron
10
(2001):
C(Di)=1+
2λ Di
1.142+0.558exp
−0.999Di
2λ
(6)
whereλis the mean free path of the gas molecules andDi corresponds to either ofDm
orDve. Application of Eq. (5) to determineDve requires knowledge ofχ.
DeterminingDse fromDve
15
Whenχ is known (or estimated), the correlation of Leith (1987) is used to relateχ,Dse, andDve:
χ=1
3 D
n
Dve
+2
3 D
se
Dve
(7)
whereDn is the diameter of the sphere whose projected area is equal to that of the
particle normal to the direction of flow. For the DMA,Dn=Dm, hence Eq. (7) can be
ACPD
10, 31039–31081, 2010Adsorption activation by mineral dust CCN
P. Kumar et al.
Title Page
Abstract Introduction
Conclusions References
Tables Figures
◭ ◮
◭ ◮
Back Close
Full Screen / Esc
Printer-friendly Version Interactive Discussion
Discussion
P
a
per
|
Dis
cussion
P
a
per
|
Discussion
P
a
per
|
Discussio
n
P
a
per
|
rearranged to expressDseas
Dse=3χ Dve−Dm
2 (8)
Despite involved uncertainties, accounting for dust non-sphericity provides more real-istic representation of dust particles as well as enables us to determine non-sphericity effects on the physics controlling the activation of insoluble dust particles.
5
3.1.3 Effect of charge and shape corrections on dust CCN activation
The largest change in dry critical activation diameter from multiple charging correc-tions is observed at the point of lowest supersaturation (corresponding to the largest activation diameters with highest probability of multiple charging). For all species con-sidered in this study (regional dusts and clays/minerals), we found that accounting for
10
non-sphericity usingχ=1.3, can result in an increase in activation diameters by up to 18–20% when converting fromDm toDse using the procedure outlined above. Based on Fig. 4, as the final activation diameters (after including both charge and shape cor-rections) lie outside the experimental error bars (or region of experimental uncertainty) determined from the raw data, the essence of including the charge and shape
correc-15
tions is justified and hence performed for all the samples studied here.
We also found that introducing both multiple charging and shape correction changes the dry activation diameters significantly and hence the exponents determined from the
sc−Ddryrelationship. For example in the case of ATD,xexp=−1.23 for the uncorrected
data; after applying charge corrections,xexp=−0.78; with shape and charge correc-20
tions,xexp=−0.82. This is a very large and important difference, enough to shift the implied activation mechanism from a regime where both FHH-AT and KT may be ac-tive (xexp=−1.23) to a regime where FHH-AT dominates (xexp=−0.82). This example
emphasizes the importance of applying corrections (especially for multiple charges) for adequate interpretation of the activation data.
ACPD
10, 31039–31081, 2010Adsorption activation by mineral dust CCN
P. Kumar et al.
Title Page
Abstract Introduction
Conclusions References
Tables Figures
◭ ◮
◭ ◮
Back Close
Full Screen / Esc
Printer-friendly Version Interactive Discussion
Discussion
P
a
per
|
Dis
cussion
P
a
per
|
Discussion
P
a
per
|
Discussio
n
P
a
per
|
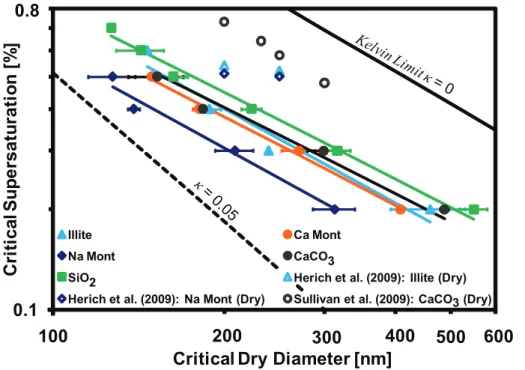
3.2 Results of dust CCN activation measurements
The CCN activation curves for dry-generated dust and mineral/clay samples are shown in Figs. 5 and 6, respectively. CCN activity is presented in terms of dry activation di-ameter (Dse, given by Eq. 8) against instrument supersaturation. The CCN activity data (points) are fit to a power law expression from which the experimental exponent,
5
xexp, is determined. TheAFHH,BFHH, and corresponding exponent, xFHH, were deter-mined from fitting the FHH-AT model (lines) to the experimental data via least squares minimization. The dry generation method used in this study did not produce sufficient number concentrations of particles with sizes smaller than 100 nm. Hence the CCN ac-tivity is restricted to supersaturations 0.7% and below (corresponding toDdry∼100 nm 10
and above).
Figure 5 clearly demonstrates that dust aerosols are CCN at atmospherically relevant supersaturations. It also indicates that soft saltation technique can generate mineral dust in the fine mode (withDdry between 100 nm and 500 nm) which may contribute to CCN. The measuredDdry for different dust samples are much larger than expected
15
for (NH4)2SO4, suggesting that dust has a lower CCN activation potential than what is expected for KT aerosol. Figure 5 suggests that dust aerosols collected from different regions of the globe can have different activation properties which are attributed to the physical properties, morphology and the chemical composition of the parent soils. The CCN activity comparisons amongst different regional dust samples indicate that East
20
Asian soils have a range of CCN activity potentials with BFHH∼1.1–1.3. In
compari-son, Niger Soil (representative of North African dust) and ATD (representative of North American dust) were found to exhibit less variability, withBFHH=1.25–1.28. The range
in CCN activity of East Asian soils is most likely reflective of the compositional variabil-ity. Differences in CCN activity amongst samples collected in the same region likely
25
reflect the chemical heterogeneity within the dust samples. We found that the experi-mental data (points) can be described by FHH-AT fits (lines) well, withAFHH∼2.25±0.75
ACPD
10, 31039–31081, 2010Adsorption activation by mineral dust CCN
P. Kumar et al.
Title Page
Abstract Introduction
Conclusions References
Tables Figures
◭ ◮
◭ ◮
Back Close
Full Screen / Esc
Printer-friendly Version Interactive Discussion
Discussion
P
a
per
|
Dis
cussion
P
a
per
|
Discussion
P
a
per
|
Discussio
n
P
a
per
|
(for particles of a given dry diameter) in terms of a hygroscopicity parameter,κ. CCN activity results for regional soils, and minerals and clays indicate aκ≤0.05 for all
sam-ples considered in this study.
Figure 6 presents the CCN activity of all the minerals and clays considered. The activation diameters obtained for different dusts (Fig. 5) are within the range of those
5
observed for different clays and minerals (Fig. 6). This suggests that dust CCN activ-ity is controlled by adsorption of water onto the clay and mineral components in the dust samples. Comparison between CCN activities for different clays indicates mont-morillonite (both Na and Ca rich) is more hydrophilic than illite, which agrees with the findings of Herich et al. (2009). Higher CCN activation potential for montmorillonite can
10
be attributed to the mineralogy of the sample; the presence of unbounded Na and Ca cations allows water to penetrate the interlayer molecular space, which together with adsorption results in the clay swelling to several times its original volume. In the case of illite, the interlayer space is mainly occupied by poorly hydrated potassium cations that prevent these clay types from expanding, thus reducing the amount of water that
15
can adsorb on the surface and its CCN activation potential.
The CCN activity of SiO2and CaCO3was also measured (Fig. 6). As expected, SiO2 was the least CCN active of species considered withBFHH=1.36 versus BFHH<1.30 for the other clays and minerals (Table 2). This is because the majority of the silica surface does not interact strongly with water vapor since physisorption occurs primarily
20
on the limited number of silanol sites (Young, 1958). We also find that the charged-corrected activation curves in our study differ from published CCN activation data for CaCO3 (Sullivan et al., 2009), montmorillonite, and illite (Herich et al., 2009). For ample, charge-corrected activation curves for clays (illite and Na-montmorillonite) ex-hibitedκ=0.02−0.04, versus 0.002−0.003 in Herich et al. (2009). In addition, (OMYA)
25
CaCO3in this study was found to exhibit multipleκvalues, 0.02 atsc=0.4%−0.5% and
0.003−0.007 atsc=0.2%−0.3%, higher than found by Sullivan et al. (2009) for (Solvay)
ACPD
10, 31039–31081, 2010Adsorption activation by mineral dust CCN
P. Kumar et al.
Title Page
Abstract Introduction
Conclusions References
Tables Figures
◭ ◮
◭ ◮
Back Close
Full Screen / Esc
Printer-friendly Version Interactive Discussion
Discussion
P
a
per
|
Dis
cussion
P
a
per
|
Discussion
P
a
per
|
Discussio
n
P
a
per
|
Similarly, we find a good comparison in CCN activity measurements based on κ
values for regional dust samples considered in this study (for activation curves with and without multiple charging corrections) and past studies. For dry-generated ATD (non-corrected), κ=0.04 determined in this study compares well with non-corrected
κ=0.025 found by Koehler et al. (2009). Similarly, a good comparison for African dust
5
samples was found with charge-corrected κ=0.023 (Herich et al., 2009) and non-correctedκ=0.054 (Koehler et al., 2009) determined for Saharan Dust, and charge-corrected and non-charge-correctedκ=0.02−0.04 for Niger dust data.
The differences cited above for CaCO3can be attributed to factors such as sample-to-sample variability (as confirmed by Sullivan et al., 2010) and method of aerosol
10
generation. The soft saltation technique may yield very different particles from studies using a custom-built dry dust generator (Herich et al., 2009) or fluidized bed (Koehler et al., 2009). Furthermore, the lack of charge correction (in previous studies) will pro-vide activation curves sensitive to the aerosol size distribution (as it determines the fraction of multiply charged particles with same mobility diameter), so differences in
15
the dust size distribution will lead to variable biases inDdry. Unfortunately, absence of number size distributions of the CCN in the published studies precludes a conclusive attribution of these differences to multiple charging biases.
Table 2 shows the values of the experimental exponent, determined from thesc−Ddry
data for all dust samples and individual minerals/clays. Thexexp values determined in
20
this study are much lower than those reported by Kumar et al. (2009b) that were de-termined from the experimental data of Koehler et al. (2009) and Sullivan et al. (2009). This is a result of experimental measurements performed in this study at much lower supersaturations, as well as the application of multiple charge and shape factor cor-rections to the activation curves that tend to further shiftDdryandxexp(as illustrated in
25
Fig. 4).
ACPD
10, 31039–31081, 2010Adsorption activation by mineral dust CCN
P. Kumar et al.
Title Page
Abstract Introduction
Conclusions References
Tables Figures
◭ ◮
◭ ◮
Back Close
Full Screen / Esc
Printer-friendly Version Interactive Discussion
Discussion
P
a
per
|
Dis
cussion
P
a
per
|
Discussion
P
a
per
|
Discussio
n
P
a
per
|
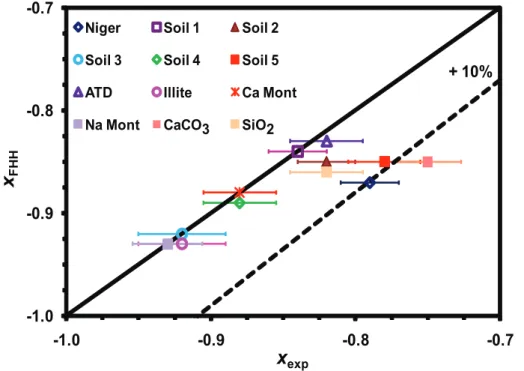
for CaCO3 is outside the range of exponents that can be predicted by FHH-AT, xFHH
deviates fromxexpby more than 10%. For Na-montmorillonite, Ca-montmorillonite, soil 1 and soil 3,xFHHis in excellent agreement withxexpsuggesting that the above can be parameterized using FHH-AT. This suggests that the CCN activity of clays is consistent with multilayer adsorption activation theory. In the case of illite, SiO2, ATD, Niger, Soil
5
2, Soil 4, and Soil 5, xFHH lies within the variability ofxexp, suggesting that FHH-AT also is an excellent description of CCN activity. Considering the uncertainty observed in experimental exponents (Fig. 7), it can be argued that the dust samples considered in this study are in excellent agreement with FHH-AT. Furthermore,xexpfor all samples are found to be between −0.80 and −1.20 (range relevant for adsorption activation 10
as given by Kumar et al., 2009a) as well as between−0.75 (determined for CaCO3)
and −0.93 (determined for Na-montmorillonite) providing support that nucleation of freshly generated regional dust aerosols is controlled by water vapor adsorption on clays and minerals. This confirms the conclusions of Kumar et al. (2009b) that (i) using the KT framework for parameterizing dust-CCN interactions is inappropriate, and,
15
(ii) adsorption effects must be included when describing the hygroscopic and CCN behavior of mineral aerosol.
It can also be seen from the insert in Fig. 2, that for KT to predict the correct exponent determined from the experimentalsc−Ddry relationships on dust and clays (shown as
shaded region), the values ofκ must be very low (less than 0.0005), much lower than
20
those determined in previous studies (Koehler et al., 2009; Herich et al., 2009; Sullivan et al., 2009). On the contrary, FHH-AT can predict experimental exponents obtained from dust and clays sc−Ddry relationships (Table 2) using a single set of values for
AFHH and BFHH. Furthermore, the predicted water vapor uptake under sub-saturated conditions is very low, and can explain the very low apparent hygroscopicity measured
25
ACPD
10, 31039–31081, 2010Adsorption activation by mineral dust CCN
P. Kumar et al.
Title Page
Abstract Introduction
Conclusions References
Tables Figures
◭ ◮
◭ ◮
Back Close
Full Screen / Esc
Printer-friendly Version Interactive Discussion
Discussion
P
a
per
|
Dis
cussion
P
a
per
|
Discussion
P
a
per
|
Discussio
n
P
a
per
|
While the application of the shape factor corrections to CCN activation data changes the dry activation diameters considerably, it does so uniformly so that the exponent derived from thesc−Ddryrelationship (hence the implied activation physics) is not sub-stantially affected. This can be seen from Table 2. Applyingχ=1.3±0.2, changesxexp
by as little as 5% from charge correctedxexp. The omission of multiple-charging
correc-5
tions to the activation curves, however, has a profound effect on the implied activation physics, as the dust appears significantly more CCN active than it really is.
3.3 Droplet growth kinetics
In addition to CCN activity, the optical particle counter of CFSTGC measures droplet sizes that can be used to explore CCN activation kinetics of mineral dust. This is
10
carried out using TDGA, by comparing droplet diameter, Dw, from the sample CCN against that of (NH4)2SO4 calibration aerosol with same critical supersaturation and maintaining identical instrument conditions (flow rates, pressure, and inlet tempera-ture). If the droplet sizes from mineral aerosol are smaller than that observed from cal-ibration aerosol (for conditions of identical instrument supersaturation, i.e., with same
15
sc), the activation kinetics of mineral dust is likely slower than the calibration aerosol.
However, if activated droplet sizes are indistinguishable (to within experimental uncer-tainty) from (NH4)2SO4droplet size, mineral dust exhibits the same activation kinetics as the reference aerosol.
Figure 8 presents the droplet diameters observed at OPC that are activated from
20
regional dust aerosols as a function of instrument supersaturation. For comparison, droplet sizes are presented for pure (NH4)2SO4 aerosol with sc equal to the instru-ment supersaturation. It is evident that droplet growth for mineral aerosol at samescis lower than that determined for (NH4)2SO4 calibration aerosol. The difference in outlet suggests a delay in activation kinetics as both particles are exposed to the same
super-25
ACPD
10, 31039–31081, 2010Adsorption activation by mineral dust CCN
P. Kumar et al.
Title Page
Abstract Introduction
Conclusions References
Tables Figures
◭ ◮
◭ ◮
Back Close
Full Screen / Esc
Printer-friendly Version Interactive Discussion
Discussion
P
a
per
|
Dis
cussion
P
a
per
|
Discussion
P
a
per
|
Discussio
n
P
a
per
|
Reduced growth at same sc observed for the mineral aerosol inside the CFTSGC
can be attributed to three potential factors: (i) different shape of the equilibrium curve (FHH-AT vs. KT), (ii) different mass transfer coefficient (or αc) of water vapor to the growing droplet, and (iii) dry particle size. To compare the effect of theory (KT or FHH-AT) used to describe equilibrium vapor pressure, we simulated droplet sizes at the
5
exit of CFSTGC column for different αc and sc. Simulations suggest that the size of activated droplets at the exit of the growth column, originating from particles activating at samescand with sameαcare almost identical, suggesting that the activation theory has an almost negligible effect on the final droplet size (not shown). Simulations (not shown) indicate that dry CCN size has a negligible effect on final droplet sizes. Based
10
on the above, the droplet size difference between dust CCN and (NH4)2SO4calibration aerosol is primarily driven by the intrinsic activation kinetics of the aerosol (which here is parameterized as difference in water vapor mass transfer coefficients (hence αc)). This is consistent with a slower timescale associated with adsorption of additional multi-layers of water vapor than absorption of water from deliquesced aerosol (Seinfeld and
15
Pandis, 2006; Pruppacher and Klett, 1997).
Data shown in Fig. 8 can be used to infer the water vapor uptake coefficient for dust by simulating dust CCN growth within the CFSTGC. Figure 10 shows values of
αcdetermined for different regional dust aerosols relative to (NH4)2SO4. Compared to (NH4)2SO4 calibration aerosol (that activates according to classical KT), mineral dust
20
CCN grows to smaller droplet sizes that implies slower growth rate. When expressed in terms ofαc, it corresponds to an average 50% reduction inαc. In absolute terms, if αc of water upon deliquesced (NH4)2SO4 aerosol is of order 0.2 (Davidovits et al.,
2006), a 50% reduction would giveαc of water upon dust∼0.1. The αc tends to
de-crease as instrument supersaturation inde-creases; at the highest supersaturation, the
25
amount of water adsorbed at Dc is much lower than for larger particles (low critical
ACPD
10, 31039–31081, 2010Adsorption activation by mineral dust CCN
P. Kumar et al.
Title Page
Abstract Introduction
Conclusions References
Tables Figures
◭ ◮
◭ ◮
Back Close
Full Screen / Esc
Printer-friendly Version Interactive Discussion
Discussion
P
a
per
|
Dis
cussion
P
a
per
|
Discussion
P
a
per
|
Discussio
n
P
a
per
|
vapor uptake coefficient on mineral dust (Seisel et al., 2005) is in agreement with the inferred αc from the highest critical supersaturation (αc∼0.065). The diversity of
in-ferred uptake coefficients could also be related to the chemical heterogeneity between samples. Such differences in reduced αc can play an important role in dynamics of
cloud formation in dust-laden conditions (Nenes et al., 2002; Lance et al., 2004).
5
4 Summary
In this study, the CCN properties and droplet activation kinetics of aerosol generated from regional dust samples and individual minerals (clays, calcite, and quartz) were measured. The aerosols were generated dry in the lab, and properties were mea-sured using the Scanning Mobility CCN Analysis (Moore et al., 2010). Including
mul-10
tiple charging corrections significantly increasedDdry and decreased xexp. Dust
non-sphericity was accounted for by converting from electrical mobility diameter,Dm, to sur-face area equivalent diameter such that the sursur-face area available for adsorption can be accounted for. Non-sphericity corrections were accounted for by using the dynamic shape factor,χ=1.3±0.2 as this range covered published data for species considered 15
in this study. It was found that while the application of the shape factor corrections to CCN activation data changes the dry activation diameters, it does so uniformly so that the magnitude of the exponent derived from thesc−Ddryrelationship (hence the implied
activation physics) is not substantially affected with a deviation of as low as 5%. The xexp for regional dust samples and mineral aerosols investigated in this study
20
was found to be in excellent agreement with FHH-AT (mostly agreeing to within 10%) and one set of adsorption parameters (AFHH∼2.25±0.75, BFHH∼1.20±0.10). In con-trast, KT cannot capture xexp without a hygroscopicity parameter that exhibits very strong size-dependence. This confirms the assessment of Kumar et al. (2009b) and further supports that FHH-AT provides more realistic representation of fresh dust CCN
25
activity than KT.
ACPD
10, 31039–31081, 2010Adsorption activation by mineral dust CCN
P. Kumar et al.
Title Page
Abstract Introduction
Conclusions References
Tables Figures
◭ ◮
◭ ◮
Back Close
Full Screen / Esc
Printer-friendly Version Interactive Discussion
Discussion
P
a
per
|
Dis
cussion
P
a
per
|
Discussion
P
a
per
|
Discussio
n
P
a
per
|
supersaturation. This implies slower activation kinetics of dust relative to (NH4)2SO4 aerosol. These delays in activation by dust CCN, when parameterized in terms of the water vapor uptake coefficient,αc, translates to a 30–80% (average=50%) reduction inαc (relative to the (NH4)2SO4aerosol).
The samples studied here are representative of major regional dust sources, and the
5
adsorption activation parameters determined can be used to express their CCN poten-tial in cloud droplet formation parameterizations developed by Kumar et al. (2009a). These parameterizations are valid for fresh dust in the dust source regions and for transported dust if it will not undergo significant atmospheric processing. A combined KT and FHH-AT framework, however, may be needed to accurately describe the CCN
10
activity of aged dust, dry lakebed dust mixed with salts (e.g., Owens Lake, Texcoco, and Aral Sea), and more generally dust particles with significant amounts of soluble materials.
A major implication of this study is that freshly-emitted dust and mineral aerosols can act as CCN through the effects of water adsorption alone. In some cases, 100 nm
15
dust particles can exhibit comparable hygroscopicity to organic species with κ∼0.05
or a particle with (NH4)2SO4volume fraction of 10%. Dust particles in the Giant CCN (GCCN) size range will exhibit much lower apparent hygroscopicity because of their lower surface-to-volume ratio. Whether the effects of adsorption is sufficient to make freshly emitted dust GCCN act as a good collector drop is an open question left for
20
ACPD
10, 31039–31081, 2010Adsorption activation by mineral dust CCN
P. Kumar et al.
Title Page
Abstract Introduction
Conclusions References
Tables Figures
◭ ◮
◭ ◮
Back Close
Full Screen / Esc
Printer-friendly Version Interactive Discussion
Discussion
P
a
per
|
Dis
cussion
P
a
per
|
Discussion
P
a
per
|
Discussio
n
P
a
per
|
Appendix A
Nomenclature
Symbol Units Description
sc Critical supersaturation
x Power law exponent relatingscandDdry
Ddry m Dry CCN diameter
C m−x Power law constant
xexp Experimental exponent
xFHH FHH-AT exponent
AFHH FHH adsorption isotherm parameter
BFHH FHH adsorption isotherm parameter
κ Hygroscopicity parameter
Dc m Critical wet diameter
∆T K Thermal gradient
s Instrument supersaturation
∆Dw m Droplet size difference at OPC
Dp m Droplet diameter
ρw kg m−3 Water density
Mw kg mol−1 Molar mass of water
R J mol−1K−1 Universal gas constant
T K Average column temperature
P◦
H2O mbar Equilibrium water vapor pressure
∆Hv J mol−1 Enthalpy of vaporization of water
D′
v m2s
−1 Di
ACPD
10, 31039–31081, 2010Adsorption activation by mineral dust CCN
P. Kumar et al.
Title Page
Abstract Introduction
Conclusions References
Tables Figures
◭ ◮
◭ ◮
Back Close
Full Screen / Esc
Printer-friendly Version Interactive Discussion
Discussion
P
a
per
|
Dis
cussion
P
a
per
|
Discussion
P
a
per
|
Discussio
n
P
a
per
|
Dv m2s−1 Di
ffusivity of water vapor in air
αc Water vapor uptake coefficient
k′
a J m
−1
s−1K−1 Thermal conductivity of air modified for non-continuum effects
Ma kg mol−1 Mean molar mass of air
ka J m−1s−1K−1 Thermal conductivity of air
ρa kg m
−3
Air density
cp J K−1 Heat capacity of air
αT Thermal accommodation coefficient
seq Droplet equilibrium supersaturation
σ N m−1 CCN surface tension
DH2O m Diameter of water molecule
FD N Drag force
χ Dynamic shape factor
AR Aspect Ratio
Dm m Electrical mobility diameter
Dse m Surface-area equivalent diameter
Dve m Volume equivalent diameter
C(Dm) Slip correction factors forDm
C(Dve) Slip correction factors forDve
λ m Mean free path of the gas molecules
Dn m Diameter of the sphere whose projected area
ACPD
10, 31039–31081, 2010Adsorption activation by mineral dust CCN
P. Kumar et al.
Title Page
Abstract Introduction
Conclusions References
Tables Figures
◭ ◮
◭ ◮
Back Close
Full Screen / Esc
Printer-friendly Version Interactive Discussion
Discussion
P
a
per
|
Dis
cussion
P
a
per
|
Discussion
P
a
per
|
Discussio
n
P
a
per
|
Acknowledgement. This work was supported by the NOAA ACC and NSF CAREER grants. We would like to thank Terry Lathem and Richard Moore for their help with the experimental setup. We thank Sandra Lafon for providing Niger dust samples. We also thank Pramod Warrier and Dhaval Bhandari from Amyn Teja and William J. Koros research groups, respectively for providing samples of SiO2minerals for this study.
5
References
Asa-Awuku, A., Nenes, A., Gao, S., Flagan, R. C., and Seinfeld, J. H.: Water-soluble SOA from Alkene ozonolysis: composition and droplet activation kinetics inferences from analysis of CCN activity, Atmos. Chem. Phys., 10, 1585–1597, doi:10.5194/acp-10-1585-2010, 2010. Brunauer, S., Emmett, P. H., and Teller, E.: Adsorption of gases in multimolecular layers, J. Am. 10
Chem. Soc., 60(2), 309–319, 1938.
Chou, C., Formenti, P., Maille, M., Ausset, P., Helas, G., Harrison, M., and Osborne, S.: Size distribution, shape, and composition of mineral dust aerosols collected during the African monsoon multidisciplinary analysis special observation period 0: dust and biomass-burning experiment field campaign in Niger, January 2006, J. Geophys. Res., 113, D00C10, 15
doi:10.1029/2008JD009897, 2008.
Collins, W. D., Conant, W. C., and Ramanathan, V.: Earth Radiation Budget, Clouds, and Climate Sensitivity. The Chemistry of the Atmosphere: Its Impact on Global Change, edited by: Calvert, J. G., Blackwell Scientific Publishers, Oxford, UK, 207–215, 1994.
Coz, E., G ´omez-Moreno, F. J., Pujadas, M., Casuccio, G. S., Lersch, T. L., and Artinano, B.: 20
Individual particle characteristics of North African dust under different long-range transport scenarios, Atmos. Environ., 43, 1850–1863, 2009.
Davidovits P., Kolb, C. E., Williams, L. R., Jayne, J. T., and Worsnop, D. R.: Mass accom-modation and chemical reactions at gas-liquid interfaces, Chem. Rev., 106(4), 1323–1354, 2006.
25
Davies, C. N.: Particle-fluid interaction, J. Aerosol Sci., 10, 477–513, 1979.
DeCarlo, P. F., Slowik, J. G., Worsnop, D. R., Davidovits, P., and Jimenez, J. L.: Particle mor-phology and density characterization by combined mobility and aerodynamic diameter mea-surements. Part 1: Theory, Aerosol Sci. Tech., 38, 1185–1205, 2004.