Cop
yright
© ABE&M t
odos os dir
eit
os r
eser
vados
.
Effect of treatment with sitagliptin on
somatosensory-evoked potentials
and metabolic control in patients
with type 2 diabetes mellitus
Efeito do tratamento com sitagliptina sobre os potenciais evocados somatossensoriais e controle metabólico de pacientes com diabetes melito tipo 2
Joelma Ines Tagliapietra Barros1, Francisco Vagnaldo Fechine1, Renan Magalhães Montenegro Júnior2, Otoni Cardoso do Vale3, Virgínia Oliveira Fernandes4, Marcellus Henrique Loiola Ponte de Souza5, Gilmara Holanda da Cunha6, Manoel Odorico de Moraes1, Catarina Brasil d’Alva1, Maria Elisabete Amaral de Moraes1
ABSTRACT
Objective: To evaluate the effect of sitagliptin on somatosensory-evoked potentials (SEPs) and metabolic control in patients with type 2 diabetes mellitus without clinical diabetic neuropathy. Materials and methods: Interventional, prospective, and open study. Patients with less than six months from the diagnosis were included. Examinations of SEPs and laboratory tests at fasting and after food stimulation were performed before and after three months of treatment with sitagliptin (100 mg/day). Results: There was a reduction in the mean levels of HbA1c (P < 0.0001), fasting glucose (P = 0.001), total cholesterol (P = 0.019), and ALT (P = 0.022). An increase in active GLP-1 was found at the end of the study (P = 0.0025). Several SEPs showed statistically signiicant differences when analyzed before and after treatment with sitagliptin. Conclusion: The results give a glimpse of the possible use of sitagliptin in the treatment of some neurode-generative conditions of the peripheral nervous system, in addition to its already established role in glycemic control. Arq Bras Endocrinol Metab. 2014;58(4):369-76
Keywords
Diabetes mellitus, type 2; dipeptidyl-peptidase IV inhibitors; incretins; diabetes complications
RESUMO
Objetivo: Avaliar o efeito da sitagliptina nos potenciais evocados somatossensoriais (PESS) e controle metabólico de pacientes com diabetes melito tipo 2, sem neuropatia diabética. Mate-riais e métodos: Estudo de intervenção, prospectivo e aberto. Os pacientes com menos de seis meses de diagnóstico foram incluídos. Exames dos PESS e testes laboratoriais em jejum e após a estimulação com alimentos foram realizados antes e depois de três meses de tratamento com sitagliptina (100 mg/dia). Resultados: Houve redução nos níveis médios de HbA1c (P < 0,0001), glicemia de jejum (P = 0,001), colesterol total (P = 0,019) e ALT (P = 0,022). Veriicou-se aumento de GLP-1 ativo (P = 0,0025). Vários PESS mostraram diferenças estatisticamente signiicativas quando os valores foram analisados antes e após o tratamento com sitagliptina. Conclusão: Os resultados vislumbram a possível utilização de sitagliptina no tratamento de algumas con-dições neurodegenerativas do sistema nervoso periférico, em adição ao seu papel no controle glicêmico. Arq Bras Endocrinol Metab. 2014;58(4):369-76
Descritores
Diabetes melito tipo 2; inibidores da dipeptidil-peptidase IV; incretinas; complicações do diabetes
1 Clinical Pharmacology Unit, Department of Physiology and Pharmacology, School of Medicine, Universidade Federal do Ceará (UFC), Fortaleza, CE, Brazil 2 Department of Community Health, School of Medicine, UFC, Fortaleza, CE, Brazil 3 Department of Clinical Medicine, School of Medicine, UFC, Fortaleza, CE, Brazil
4 University Hospital Walter Cantidio, UFC, Fortaleza, CE, Brazil
5 Department of Physiology and Pharmacology, School of Medicine, UFC, Fortaleza, CE, Brazil 6 Department of Nursing, UFC, Fortaleza, CE, Brazil
Correspondence to:
Maria Elisabete Amaral de Moraes Clinical Pharmacology Unit, Department of Physiology and Pharmacology,
Faculdade de Medicina, Universidade Federal do Ceará Coronel Nunes de Melo, 1127 Rodolfo Teóilo
60430-270 – Fortaleza, CE, Brazil [email protected]
Received on Ago/2/2013 Accepted on Jan/24/2014
Cop
yright
© ABE&M t
odos os dir
eit
os r
eser
vados
.
INTRODUCTION
D
iabetes mellitus, a chronic non-transmissibledis-ease, is one of the most prevalent diseases in the world (1). Hyperglycemia increases inlammation, os-motic damage and neuronal oxidative stress, leading to impaired function of proteins and damage to transcrip-tion factors and mitochondrial DNA, as well as increas-ing the expression of pro-apoptotic proteins. These inter-connected processes are harmful to the nervous system, slowing axonal transport by altering neuronal signaling, and ultimately promoting neuronal dysfunction (2).
Diabetic neuropathy is deined as the presence of signs or symptoms of peripheral nerve dysfunction in diabetic patients after the exclusion of other causes (3). Deiciencies in central nervous system conduc-tion in diabetics can be readily detected by the study of somatosensory-evoked potentials (SEPs), which are the electrical responses of the nervous system to mo-tor or sensory stimulation. Its role in the diagnosis of neurological diseases is the identiication or location of one or more lesions in somatosensory pathways, even before the onset of clinical abnormalities (4). Glyce-mic control improves nerve conduction. Studies with glucagon-like peptide-1 (GLP-1) analogues and dipep-tidyl peptidase-4 (DPP-4) inhibitors show that, in ad-dition to its hypoglycemic effect, they may act directly on nerve cell protection against lipotoxicity and gluco-toxicity (5-8).
In this context, sitagliptin binds to DPP-4 and pre-vents the breakdown of GLP-1 and glucose-dependent insulinotropic polypeptide (GIP). Both GLP-1 and GIP are types of incretin hormones released by the intestines, which stimulate insulin secretion from β cells and sup-press glucagon secretion. GLP-1 and GIP are rapidly bro-ken down by DPP-4. Incretin hormones depend on the level of blood glucose to stimulate insulin. DPP-4 inhibi-tors are associated with lower incidence of hypoglycemia compared with conventional hypoglycemic drugs (9).
Thus, this study aimed to evaluate the effects of treat-ment with sitagliptin on SEPs and metabolic control (as well as their interrelationships) in patients with type 2
diabetes mellitus without clinical diabetic neuropathy.
MATERIALS AND METHODS
Patients
This study was conducted in accordance with the Decla-ration of Helsinki, and the protocol was approved by the
Ethics Committee of the Federal University of Ceará, in Fortaleza, Brazil, under registration number 189/07. All patients gave their written, informed consent and were free to withdraw from the trial at any time.
Twenty type 2 diabetic patients aged 18-65 years were eligible and agreed to take part in the study. Eli-gible patients were those newly diagnosed (less than six months), not previously treated with hypoglycemic drugs or in wash-out period of seven half-lives of the hypoglycemic drug used before entering the study, and without clinical diabetic neuropathy. The exclusion criteria were positive ketones in the urine (ketonuria) above two plus (2+), any symptoms or signs sugges-tive of brain or neurological involvement, insulin use, pregnant or nursing women, history of alcohol intake greater than or equal to 20 g/day.
Study design
Patients were evaluated in the pre-treatment period, monthly during the three months of treatment, and in the post-treatment period. In the pre- and post-treat-ment periods, the patients were examined and blood pressure was measured after sitting for at least 15 min using a calibrated electronic sphygmomanometer, and using the average of two readings. Blood was drawn (12 hours fasting) for complete blood count, glycated hemoglobin (HbA1c) (turbidimetry), insulin, gluca-gon (radioimmunoassay), active GLP-1 (immunoas-say), glucose, total cholesterol, HDL cholesterol, tri-glycerides, alanine aminotransferase (ALT), aspartate aminotransferase (AST), and gamma glutamyl transfer-ase (GGT) (automated enzymatic method). The meal test consisted in the ingestion of a 566-kcal shake (33% lipids, 20% protein and 47% carbohydrate of slow ab-sorption), followed by the collection of blood samples at 5, 15, 30, 45, 60, 90, 120, 150, and 180 minutes, to perform serial measurements of glucose, insulin, gluca-gon, and active GLP-1. The values obtained were used to calculate the area under the curve for glucose, insu-lin, glucagon, and active GLP-1.
Cop
yright
© ABE&M t
odos os dir
eit
os r
eser
vados
.
After that, this tube was immediately placed on ice to prevent peptide breakdown. For glucagon determina-tion, the blood sample was collected in a tube without anticoagulant but added of a protease inhibitor cocktail (20 μL/mL blood). Then, it was immediately placed in an ice bath. For the other times (0 minute of fasting and 5, 15, 30, 45, 60, 90, 120, 150, and 180 minutes after food intake), samples were collected only for glu-cose, insulin, glucagon, and active GLP-1.
Patients were then submitted to the examination of SEPs. The patient was kept in a supine position, alert or in spontaneous sleep without sedatives in a quiet room. Square pulses of 0.2 milliseconds duration were applied on the median nerve in the wrist, at a frequency of three pulses per second. Surface electrodes (coated with silver chloride, measuring 1 cm in diameter) were afixed to the skin, previously cleaned, covered with colloid con-ductive paste in ive regions, including Erb’s point (the angle between the sternocleidomastoid muscle and the clavicle) ipsilateral to the stimulus (N9), spinous process of the sixth cervical vertebra (VC6), anterior neck above the thyroid cartilage (PA), the parietal region 70 mm lateral to midline and 30 mm behind Cz (midpoint of the midline), subsequent to the region contralateral to the stimulus of potential N9 and N20 (N20 records the activity of the cerebral cortex), and frontal median (Fz - reference electrode). The ground electrode for the ive regions was afixed on the shoulder contralateral to the stimulus. We evaluated the peak latencies of the following potentials: Erb (N9), spinal (N13) in assembly VC6-PA and potentials N20 picked up by electrodes on the scalp.
The conduction time from component N9 to spinal component N13 or spinal N13 response component to N20 cortical potential and of potential N9 to potential N20 was measured by the peak-to-peak method. The peak latency of the spinal N13 potential in the assem-bly VC6-PA was taken as the entry time of the nerve impulse in the spinal cord (10). The peak latency of component N20 (cortical arrival time) was identiied as a marker where the frontal and parietal contralateral potentials diverge. The central conduction time (CCT) was deined as the transit time between the peak of the N9-N13, N13-N20, and N9-N20 potential.
After this assessment, patients were instructed to take a tablet of 100 mg sitagliptin once daily in the morning, while fasting, for three months. They were assessed monthly by a physician, and they were exclud-ed from the study if it was necessary to introduce other hypoglycemic agents or insulin. After three months, the
patients underwent laboratory and electrophysiological tests again, and were reassessed by a physician.
Statistical analysis
The quantitative variables were initially analyzed by the Kolmogorov-Smirnov test to verify the normality of distribution. Descriptive statistics were expressed as the means and standard deviations. Comparisons between pre- and post-treatment were made using the paired t
test. The degree and sign of linear correlation between two variables were quantiied by the Pearson’s correla-tion coeficient. Areas under the curve (AUCs) were calculated using the trapezoidal rule and compared u sing the t test for paired data (11,12).
In all cases, probability α of type I error (signii-cance level) was set at 0.05 (5%), which was considered statistically signiicant (P < 0.05). The software Graph-Pad Prism® version 5.00 for Windows® (GraphPad
Software, San Diego, California, USA, 2007) was used to perform the statistical procedures and to prepare the graphs.
RESULTS
Of the 20 patients evaluated, 14 were female and six were male, and the average age was 53.2 ± 8.4 years without statistically signiicant difference in age be-tween the sexes (males = 55.0 ± 6.4 years and females = 51.3 ± 10.3 years; P = 0.42).
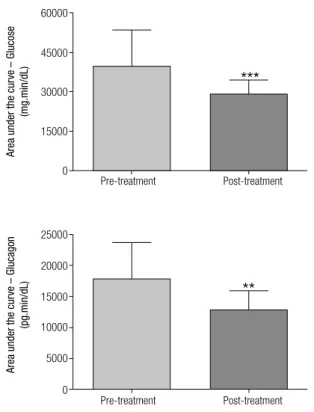
There was a reduction in the mean levels of HbA1c (pre-treatment: 8.17 ± 1.90%; post-treatment: 6.66 ± 1.27%; P < 0.0001), fasting glucose (pre-treatment: 169.32 ± 53.72 mg/dL; post-treatment: 136.42 ± 29.68 mg/dL; P = 0.001), total cholesterol (pre-treat-ment: 209.40 ± 48.90 mg/dL; post-treat(pre-treat-ment: 189.65 ± 28.19 mg/dL; P = 0.019) and ALT (pre-treatment: 24.83 ± 13.78 U/L; post-treatment: 20.85 ± 13.94 U/L; P = 0.022). An increase in active GLP-1 was ob-served at the end of the study (pre-treatment: 7.86 ± 3.78 pmol/L; post-treatment: 14.16 ± 10.18 pmol/L; P = 0.0025) (Table 1).
Cop
yright
© ABE&M t
odos os dir
eit
os r
eser
vados
.
Table 1. Comparison of biochemical variables in the pre- and post-treatment with sitagliptin. Data expressed as means ± standard deviations
Parameter Pre-treatment Post-treatment Difference between
means (CI-95%) P value Reference range
Glucose 169.32 ± 53.72 136.42 ± 29.68 34.41 (15.20 – 50.59) 0.001 70 – 99 mg/dL
HbA1c 8.17 ± 1.90 6.66 ± 1.27 1.51(0.91 – 2.11) < 0.0001 < 6%
Insulin 18.09 ± 11.90 20.57 ± 12.47 -2.48 (-7.07 – 2.11) 0.273 0 – 30 µUI/mL
Glucagon 62.40 ± 20.12 53.73 ± 17.92 4.70 (1.26 – 10.59) 0.120 < 60 pg/mL
Active GLP1 7.86 ± 3.78 14.16 ± 10.18 -6.30 (-10.09 – -2.52) 0.0025 5 – 10 pmol/L
Triglycerides 230.25 ± 194.63 178.95 ± 70.06 51.30 (-27.80 – 130.40) 0.190 < 150 mg/dL
Total cholesterol 209.40 ± 48.90 189.65 ± 28.19 19.75 (3.56 – 35.94) 0.019 < 200 mg/dL
HDL cholesterol 40.15 ± 9.10 39.40 ± 10.14 0.75 (-1.77 – 3.27) 0.540 ≥ 60 mg/dL
LDL cholesterol 123.20 ± 36.81 114.46 ± 21.59 8.74 (-5.57 – 23.05) 0.222 < 100 mg/dL
GGT 33.37 ± 21.81 27.06 ± 12.27 6.31 (-0.28 – 12.90) 0.059 Male: 8 – 61 U/L
Female: 5 –36 U/L
AST 20.46 ± 8.64 18.87 ± 10.09 1.59 (-0.65 – 3.84) 0.154 Male: ≤ 38 U/L
Female: ≤ 32 U/L
ALT 24.83 ± 13.78 20.85 ± 13.94 3.98 (0.62 – 7.32) 0.022 Male: ≤ 41 U/L
Female: ≤ 31 U/L
CI-95%: 95% conidence interval; P value: statistical signiicance; HbA1c: glycated hemoglobin; HDL: high density lipoprotein; GGT: gamma glutamyl transferase; AST: aspartate aminotransferase; ALT: alanine aminotransferase.
Figure 1. Area under the curve of glucose and glucagon in the meal test before (pre-treatment) and three months after treatment with sitagliptin (post-treatment). Data expressed as means and standard deviations. *** P = 0.0001; ** P = 0.0021.
Figure 2. Area under the curve of active GLP-1 and insulin in the meal test before (pre-treatment) and three months after treatment with sitagliptin (post-treatment). Data expressed as means and standard deviations. ** P = 0.0030.
Pre-treatment Post-treatment
Pre-treatment Post-treatment
60000
25000
20000
15000
10000
5000
0
***
45000
30000
15000
0
Area under the cur
ve – Glucose
(mg.min/dL)
Area under the cur
ve – Gluca
gon
(pg.min/dL)
**
Pre-treatment Post-treatment
Pre-treatment Post-treatment
12000
20000
15000
10000
5000
0
**
9000
6000
3000
0
Area under the cur
ve – GLP-1
(pmol.min/L)
Area under the cur
ve – Insulin
Cop
yright
© ABE&M t
odos os dir
eit
os r
eser
vados
.
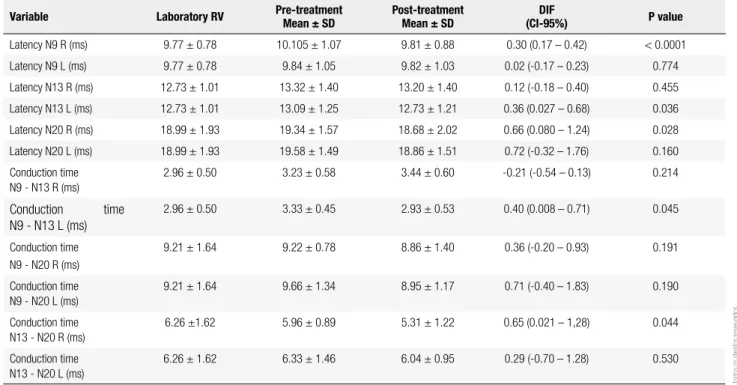
No statistically signiicant differences were observed in the amplitude of evoked potentials when patients were divided into low and high potential, using the me-dian (153.5 cm) as the cutoff value, either before or after treatment with sitagliptin. Before treatment with sita-gliptin, nerve conduction displayed abnormalities even without clinical symptoms, compared with the reference values of the laboratory where the tests were performed. As seen in table 2, several evoked potentials showed sta-tistically signiicant differences when values were ana-lyzed before and after treatment with sitagliptin.
Signiicant correlations were observed for changes in some measurements of SEPs, and in the changes of some biochemical parameters after treatment with sitagliptin. There was a positive correlation (r = 0.48, P = 0.04) between the change in fasting glucose con-centration and the variation in N13 R latency in that the decrease in fasting glucose concentration was as-sociated with a reduction in the latency of the evoked potential N13 on the right side at the end of treatment with sitagliptin. For this same potential, we observed a trend toward a positive correlation with HbA1c (P = 0.07). There was also a positive correlation (r = 0.53, P = 0.03) between the change in fasting glucagon and
N13 latency evoked from the left side, indicating that a decrease in fasting glucagon concentration was associ-ated with a decrease in latency of N13 on the left side after treatment with sitagliptin. Regarding the area un-der the curve of active GLP-1, we observed a negative correlation (r = - 0.62, P = 0.02) with the variation in latency of N20 L, i.e., an increase in GLP-1 AUC cor-related with a reduction in latency of N20 left at the end of treatment with sitagliptin (Table 3).
Importantly, among the parameters measured at fasting, the variation in triglyceride levels had a negative correlation (r = -0.47, P = 0.03) with the variation in AUC of active GLP-1 after treatment with sitagliptin, i.e., the decrease in fasting triglyceride concentration was correlated with an increase in concentration of ac-tive GLP-1 after food stimulation.
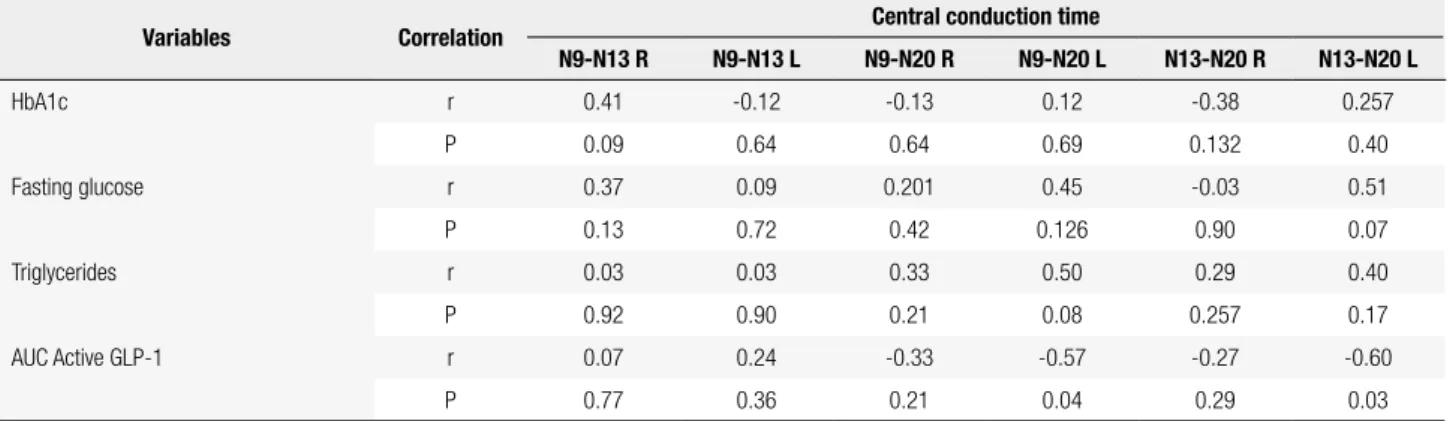
In the analysis of central conduction times (CCT), the AUC of active GLP-1 was negatively correlated with the central conduction time N9 - N20L (r = -0.57, P = 0.04) and the central conduction time N13-N20L (r = - 0.60, P = 0.03). This inding indicates that an increase in AUC of active GLP-1 after sitagliptin treat-ment is correlated with a decrease in central conduction time N9-N20 and N13-N20 on the left side (Table 4).
Table 2. Comparison of latency and conduction times of somatosensory-evoked potentials (SEPs) in the pre- and post-treatment with sitagliptin
Variable Laboratory RV Pre-treatment Mean ± SD
Post-treatment Mean ± SD
DIF
(CI-95%) P value
Latency N9 R (ms) 9.77 ± 0.78 10.105 ± 1.07 9.81 ± 0.88 0.30 (0.17 – 0.42) < 0.0001
Latency N9 L (ms) 9.77 ± 0.78 9.84 ± 1.05 9.82 ± 1.03 0.02 (-0.17 – 0.23) 0.774
Latency N13 R (ms) 12.73 ± 1.01 13.32 ± 1.40 13.20 ± 1.40 0.12 (-0.18 – 0.40) 0.455
Latency N13 L (ms) 12.73 ± 1.01 13.09 ± 1.25 12.73 ± 1.21 0.36 (0.027 – 0.68) 0.036
Latency N20 R (ms) 18.99 ± 1.93 19.34 ± 1.57 18.68 ± 2.02 0.66 (0.080 – 1.24) 0.028
Latency N20 L (ms) 18.99 ± 1.93 19.58 ± 1.49 18.86 ± 1.51 0.72 (-0.32 – 1.76) 0.160
Conduction time N9 - N13 R (ms)
2.96 ± 0.50 3.23 ± 0.58 3.44 ± 0.60 -0.21 (-0.54 – 0.13) 0.214
Conduction time N9 - N13 L (ms)
2.96 ± 0.50 3.33 ± 0.45 2.93 ± 0.53 0.40 (0.008 – 0.71) 0.045
Conduction time N9 - N20 R (ms)
9.21 ± 1.64 9.22 ± 0.78 8.86 ± 1.40 0.36 (-0.20 – 0.93) 0.191
Conduction time N9 - N20 L (ms)
9.21 ± 1.64 9.66 ± 1.34 8.95 ± 1.17 0.71 (-0.40 – 1.83) 0.190
Conduction time N13 - N20 R (ms)
6.26 ±1.62 5.96 ± 0.89 5.31 ± 1.22 0.65 (0.021 – 1,28) 0.044
Conduction time N13 - N20 L (ms)
6.26 ± 1.62 6.33 ± 1.46 6.04 ± 0.95 0.29 (-0.70 – 1.28) 0.530
Cop
yright
© ABE&M t
odos os dir
eit
os r
eser
vados
.
Table 3. Correlation between the changes in the latency of SEPs and changes in some biochemical parameters measured at fasting and after food stimulation before and after the treatment with sitagliptin
Variable Correlation Latency
N9R N9L N13R N13L N20R N20L
HbA1c r -0.06 0.36 0.43 0.08 -0.15 0.21
P 0.81 0.142 0.07 0.74 0.54 0.47
Fasting glucose r 0.13 0.25 0.48 0.23 0.23 0.53
P 0.59 0.31 0.04 0.37 0.36 0.06
Fasting glucagon r 0.17 0.134 -0.02 0.53 0.17 -0.10
P 0.49 0.60 0.93 0.03 0.50 0.74
AUC active GLP-1 r 0.24 0.19 0.20 0.14 -0.31 -0.62
P 0.30 0.45 0.43 0.56 0.22 0.02
AUC glucose r 0.002 0.33 0.46 0.26 -0.11 0.50
P 0.99 0.19 0.06 0.28 0.67 0.07
N9 R: latency N9 right; N9 L: latency N9 left; N13 R: latency N13 right; N 13L: latency N13 left; N20 R: latency N20 right; N20 L: latency N20 left; HbA1c: glycated hemoglobin; GLP-1: glucagon-like peptide-1; r: Pearson correlation coeficient; P: statistical signiicance of the correlations.
Table 4. Correlation between changes in central conduction time (CCT) of SEPs and changes in some biochemical parameters measured in the fasting state before and after treatment with sitagliptin
Variables Correlation Central conduction time
N9-N13 R N9-N13 L N9-N20 R N9-N20 L N13-N20 R N13-N20 L
HbA1c r 0.41 -0.12 -0.13 0.12 -0.38 0.257
P 0.09 0.64 0.64 0.69 0.132 0.40
Fasting glucose r 0.37 0.09 0.201 0.45 -0.03 0.51
P 0.13 0.72 0.42 0.126 0.90 0.07
Triglycerides r 0.03 0.03 0.33 0.50 0.29 0.40
P 0.92 0.90 0.21 0.08 0.257 0.17
AUC Active GLP-1 r 0.07 0.24 -0.33 -0.57 -0.27 -0.60
P 0.77 0.36 0.21 0.04 0.29 0.03
R: right; L: left; AUC: area under the curve; HbA1c: glycated hemoglobin; GLP-1: glucagon-like peptide-1; r: Pearson correlation coeficient; P: statistical signiicance of the correlations.
DISCUSSION
This study evaluated the effects of sitagliptin on SEPs and metabolic control of patients with type 2 diabe-tes mellitus without clinical diabetic neuropathy.
Fast-ing blood glucose levels decreased after treatment, as well as the concentration of HbA1c. In this study, mean concentration of HbA1c after treatment was 6.66%, and over 75% had a satisfactory result in relation to the reduction of HbA1c. It is likely that this result relects the short duration of disease in these patients, who still have a good supply of functioning β cells and are, therefore, more responsive to treatment.
Regarding active GLP-1, the AUC was lower before treatment, and there was a substantial increase after the use of DPP-4 inhibitor, as described in previous studies (13,14). Before treatment, the patients had
abnormali-ties in nerve transmissions even without clinical symp-toms. Several electrophysiological studies have docu-mented increased latencies in addition to the slowing of nerve conduction in diabetic patients compared with normal subjects, suggesting lesions in the somatosen-sory nerve pathways (15-17).
Cop
yright
© ABE&M t
odos os dir
eit
os r
eser
vados
.
Furthermore, when the left median nerve was stimu-lated, it was found that the effects of treatment were most intense in the proximal peripheral conduction or root, since there was a signiicant reduction in latency of N13 and of central conduction time N9-N13. The short treatment period, as well as the small number of volunteers who participated in the study (n = 20), may have contributed to the asymmetric improvement of nerve conduction.
The triggering factor of most complications in dia-betes is chronic exposure to high glucose levels (18). In our study, an analysis of the correlation between the electrophysiological and biochemical parameters showed that improvement of glycemic control observed in the three months of treatment was associated with improved measures of some evoked potentials. Electro-physiological studies in type 1 and 2 diabetes with short disease duration and without clinical complications have found signiicant abnormalities in latency values of visual and auditory SEPs, and these abnormalities were correlated with the state of glycemic control (19). Other study also found signiicant correlations between changes in SEPs, HbA1c and fasting glucose (16).
On the other hand, studies of the effects of recombi-nant GLP-1 in rats demonstrated a reduction in intesti-nal lymph low, triglyceride absorption and synthesis of apolipoproteins, which limited the release of triglyce-rides into the circulation after providing feed contain-ing lipids. In our study, we observed that the increase in area under the curve of active GLP-1 was correlated with decreased serum triglyceride levels after treatment. Moreover, the decrease in triglycerides correlated with the improvement in conduction time N9-N20L (20).
Studies have shown a signiicant association of triglyceride levels with changes in SEPs (16), and elevated triglyceride levels have been correlated with the loss of myelinated ibers in the sural nerve (21). Studies exa mining the action of GLP-1 and exendin-4 on prolife ration, differentiation and neuronal degeneration of nerve cells (6-8), and the effect of the DPP-4 inhibitor vildagliptin on peripheral nerves of streptozotocin-induced diabetic rats (9) suggested that the DPP-4 inhibitor can prevent the degeneration of peripheral nerves in an animal model of induced diabetes.
In line with the literature reviewed, we noted that increased concentration of active GLP-1 caused by the treatment with the inhibitor of the enzyme that de-grades the endogenous peptide was correlated with im-provement in nerve impulse conduction. Taking into
account the correlations between the results of evoked potentials, metabolic control and active GLP-1 levels, the question now is whether improved nerve conduc-tion in these patients was due to a direct neuroprotec-tive/neuroregenerative effect of endogenous GLP-1 caused by binding to its receptors on peripheral and central nerves, a direct consequence of metabolic con-trol achieved with the therapy, or both.
In this study, sitagliptin produced about two times greater concentration of endogenous GLP-1. It is spec-ulated that its use for a longer period, or the use of GLP-1 analogues that increase GLP-1 levels over ten times could show better improvement in the conduc-tion of nerve impulses. Preclinical studies suggest the possibility that activation of GLP-1 receptor may have a neuroprotective/neuroregenerative effect by means of mechanisms independent of glycemic control (22-25).
In reviewing the literature, no studies similar to ours were found. Based on the results of preclinical re-search, it is important to conduct studies in humans with longer treatment and greater number of volun-teers to achieve better monitoring of the improvement in nerve impulse conduction in diabetic patients with or without clinical diabetic neuropathy. Our study has several limitations. Most important, there was no place-bo group or control group showing the same improve-ment of glycemic control without sitagliptin use. Also, the number of patients and the period of observation were insuficient to assess a more consistent effect of the treatment on nerve impulse conduction. Unfortu-nately, this study had a small sample and was conducted over a relatively short period. Thus, studies with larger samples and longer duration are needed.
Cop
yright
© ABE&M t
odos os dir
eit
os r
eser
vados
.
already established role in the glycemic control of type 2 diabetes.
Disclosure: no potential conlict of interest relevant to this article was reported.
REFERENCES
1. Guidoni CM, Borges APS, Freitas O, Pereira LRL. Prescription pat-terns for diabetes mellitus and therapeutics implications: a popu-lation-based analysis. Arq Bras Endocrinol Metab. 2012;56(2):120-27.
2. Yorek MA. The role of oxidative stress in diabetic vascular and neural disease. Free Radic Res. 2003;37(5):471-80.
3. American Diabetes Association. Standards of medical care in dia-betes – 2010. Diadia-betes Care. 2010;33(Suppl 1):S11-61.
4. Legatt AD, Soliman E. Somatosensory evoked potentials: general principles. St. Petersburg: eMedicine Corporation; 2006. 5. Perry T, Lahiri DK, Chen D, Zhou J, Shaw KT, Egan JM, et al. A
no-vel neurotrophic property of glucagon-like peptide 1: a promoter of nerve growth factor-mediated differentiation in PC12 cells. J Pharmacol Exp Ther. 2002;300(3):958-66.
6. Perry T, Haughey NJ, Matson MP, Egan JM, Greig NH. Protection and reversal of excitotoxic neuronal damage by glucagon-like peptide-1 and exendin-4. J Pharmacol Exp Ther. 2002;302(3):881-8. 7. Perry T, Holloway HW, Weerasuriya A, Mouton PR, Duffy K, Mat-tison JA, et al. Evidence of GLP-1-mediated neuroprotection in an animal model of pyridoxine-induced peripheral sensory neuropa-thy. Exp Neurol. 2007;203(2):293-301.
8. Jin HY, Liu WJ, Park JH, Baek HS, Park TS. Effect of dipepti-dyl peptidase-IV (DPP-IV) inhibitor (Vildagliptin) on peripheral nerves in streptozotocin-induces diabetic rats. Arch Med Res. 2009;40(7):536-44.
9. Sakamoto Y, Oyama J, Ikeda H, Kuroki S, Gondoh S, Iwamoto T, et al. Effects of sitagliptin beyond glycemic control: focus on quality of life. Cardiovasc Diabetol. 2013;12(1):35.
10. Chiappa KH. Evoked potentials in clinical medicine. New York: Lippincott Williams & Wilkins; 1997.
11. Armitage P, Berry G. Statistical methods in medical research. Ox-ford: Blackwell; 1994.
12. Motulsky H. Intuitive biostatistics. Oxford: Oxford University Press; 1995.
13. Visboll T, Krarup T, Deacon CF, Madsbad S, Holst JJ. Reduced post-prandial concentrations of intact biologically active glucagon-like peptide 1 in type 2 diabetic patients. Diabetes. 2001;50(3):609-13. 14. Herman GA, Bergman A, Stevens C, Kotey P, Yi B, Zhao P, et al.
Effect of single oral doses of sitagliptin, a dipeptidyl peptidase-4 inhibitor, on incretin and plasma glucose levels after an oral glu-cose tolerance test in patients with type 2 diabetes. J Clin Endo-crinol Met. 2006;91(11):4612-9.
15. Kucera P, Goldenberg Z, Varsik P, Buranova D, Traubner P. Spinal cord lesions in diabetes mellitus. Somatosensory and motor evoked potentials and spinal conduction time in diabetes mel-litus. Neuro Endocrinol Lett. 2005;26(2):143-7.
16. Napoleão RM. Evoked potentials somatosensory median nerve in diabetic patients: correlations with biochemical markers. Dis-sertation (a Master degree in Medical Clinic), Faculty of Medicine, Federal University of Ceará, Ceará, Brazil, 2006.
17. Misulis KE. Potencial evocado de Spehlmann. Rio de Janeiro: Revinter; 2003.
18. Kikkawa Y, Kuwabara S, Misawa S, Tamura N, Kitano Y, Ogawara K, et al. The acute effects of glycemic control on nerve conduction in human diabetics. Clin Neurophysiol. 2005;116(2):270-4. 19. Pozzessere G, Rizzo PA, Valle E, Mollica MA, Meccia A, Morano
S, et al. Early detection of neurological involvement in IDDM and NIDDM. Multimodal evoked potentials versus metabolic control. Diabetes Care. 1998;11(6):473-80.
20. Qin X, Shen H, Liu M, Yang Q, Zheng S, Sabo M, et al. GLP-1 re-duces intestinal lymph low, triglyceride absorption, and apo-lipoprotein production in rats. Am J Physiol Gastrointest Liver Physiol. 2005;288(5):G943-9.
21. Wiggin TD, Sullivan KA, Pop-Busui R, Amato A, Sima AA, Feld-man EL. Elevated triglycerides correlate with progression of dia-betic neuropathy. Diabetes. 2009;58(7):1634-40.
22. Jolivalt CG, Fineman M, Deacon CF, Carr RD, Calcutt NA. GLP-1 signals via ERK in peripheral nerve and prevents nerve dysfunc-tion in diabetic mice. Diabetes Obes Metab. 2011;13(11):990-1000. 23. Himeno T, Kamiya H, Naruse K, Harada N, Ozaki N, Seino Y, et al.
Beneicial effects of exendin-4 on experimental polyneuropathy in diabetic mice. Diabetes. 2011;60(9):2397-406.
24. Liu WJ, Jin HY, Lee KA, Xie SH, Baek HS, Park TS. Neuroprotective effect of the glucagon-like peptide-1 receptor agonist, synthetic exendin-4, in streptozotocin-induced diabetic rats. Br J Pharma-col. 2011;164(5):1410-20.