Cop
yright
© ABE&M t
odos os dir
eit
os r
eser
vados
.
Cop
yright
© ABE&M t
odos os dir
eit
os r
eser
vados
.
Leptin replacement therapy for the
treatment of non-HAART associated
lipodystrophy syndromes: a
meta-analysis into the effects of leptin on
metabolic and hepatic endpoints
Terapia de reposição de leptina para o tratamento de síndromes
lipodistróicas não associadas ao uso de antirretrovirais: uma metanálise dos efeitos da leptina em parâmetros metabólicos e hepáticos
Alexander J. Rodríguez1, Teresa Neeman2, Aaron G. Giles1,
Claudio A. Mastronardi1, Gilberto Paz-Filho1
ABSTRACT
The clinical manifestations of lipodystrophy syndromes (LS) are hypoleptinemia, hyperglyce-mia, insulin resistance, dyslipidemia and hepatic steatosis. Leptin replacement therapy (LRT) is effective at improving these pathologies. Currently, there are no data compiling the evidence from the literature, and demonstrating the effect of LRT in LS patients. A systematic review of the MEDLINE and Cochrane Library databases was conducted to identify studies assessing the effect of LRT on metabolic and hepatic endpoints in patients with LS not associated with highly active antiretroviral therapy (HAART) use. Standardized mean differences (SMD) and 95% con-idence intervals of pooled results were calculated for overall changes in glucose homeostasis, lipid proile, and hepatic physiology, using an inverse-variance random-effects model. After screening, 12 studies were included for review. Meta-analysis of results from 226 patients sho-wed that LRT decreased fasting glucose [0.75 SMD units (range 0.36-1.13), p = 0.0001], HbA1c [0.49 (0.17-0.81), p = 0.003], triglycerides [1.00 (0.69-1.31), p < 0.00001], total cholesterol [0.62 (0.21-1.02), p = 0.003], liver volume [1.06 (0.51-1.61), p = 0.0002] and AST [0.41 (0.10-0.73) p = 0.01]. In patients with non-HAART LS, LRT improves the outcome of several metabolic and hepatic parameters. Studies were limited by small populations and therefore large prospective trials are needed to validate these indings. Arq Bras Endocrinol Metab. 2014;58(8):783-97
Keywords
Leptin; lipodystrophy; meta-analysis; metreleptin; nonalcoholic fatty liver disease
RESUMO
As manifestações clínicas das síndromes lipodistróicas (SL) incluem hipoleptinemia, hipergli-cemia, resistência insulínica, dislipidemia e esteatose hepática. A terapia de reposição de lepti-na (TRL) melhora tais parâmetros, mas atualmente não há dados compilados demonstrando tal efeito. Uma revisão sistemática dos bancos de dados MEDLINE e Cochrane Library identiicou estudos avaliando os efeitos da TRL sobre parâmetros metabólicos e hepáticos em pacientes com SL não associadas ao uso de antirretrovirais. Diferenças médias padronizadas (DMP) e intervalos de coniança de 95% foram calculados a partir dos resultados, para os efeitos da TRL sobre a homeostase da glicose, peril lipídico, e morfologia/função hepática, usando um mode-lo de variação inversa e efeitos randômicos. Após a triagem, 12 estudos foram incluídos para revisão. A metanálise dos resultados de 226 pacientes mostrou que a TRL reduziu a glicemia de jejum [0,75 DMP (amplitude 0,36-1,13), p = 0,0001], HbA1c [0,49 (0,17-0,81), p = 0,003], triglicerí-deos [1,00 (0,69-1,31), p < 0,00001], colesterol total [0,62 (0,21-1,02), p = 0,003], volume hepático [1,06 (0,51-1,61), p = 0,0002] e AST [0,41 (0,10-0,73), p = 0,001]. Em pacientes com SL não asso-ciada ao uso de antirretrovirais, a TRL melhora vários parâmetros metabólicos e hepáticos. Os estudos avaliados foram limitados pelo pequeno número de pacientes. Maiores estudos clíni-cos prospectivos são necessários para validar tais achados. Arq Bras Endocrinol Metab. 2014;58(8):783-97
Descritores
Leptina; lipodistroia; metanálise; metreleptina; doença hepática gordurosa não alcoólica
1 Department of Genome Biology, The John Curtin School of Medical Research, The Australian National University, Canberra, Australia 2 Statistical Consulting Unit, The Australian National University, Canberra, Australia
Correspondence to:
Gilberto Paz-Filho Garran Rd, Building, 131 Acton, ACT 2600, Australia [email protected]
Received on Jan/30//2014 Accepted on July/29/2014
Cop
yright
© ABE&M t
odos os dir
eit
os r
eser
vados
.
INTRODUCTION
L
ipodystrophy syndromes (LS) are congenital and acquired disorders characterized by the generali-zed or partial absence of subcutaneous adipose tissue. Cases of lipodystrophy not associated with the use of highly active antiretroviral therapy (HAART) are rare conditions, and most determined by molecular defects in genes that regulate adipocyte differentiation, lipid metabolism, and lipid droplet morphology (1). As the adipose tissue is an important endocrine organ that syn-thesizes hormones with cytokine-like actions (known as adipokines) (2,3), its absence determines several meta-bolic defects, such as insulin resistance, diabetes, and hypertriglyceridemia, which can lead to the develop-ment of atherosclerosis, acute pancreatitis, and nonal-coholic fatty liver disease (NAFLD) (4).Leptin is one of the most abundant adipokines. It is an important metabolic regulator responsible for not only controlling food intake and energy expenditure, but also for maintaining glucose, insulin and lipid ho-meostasis (5,6). Impaired leptin action, due to leptin resistance or leptin deiciency, results in several metabo-lic abnormalities such as insulin resistance, hyperinsu-linemia, diabetes, and hypertriglyceridemia, which are similar to those that are observed in LS. In fact, LS and leptin deiciency have similar metabolic manifestations, with low leptin levels (7-9).
Leptin replacement therapy is the treatment of choi-ce for LS. Numerous animal models have shown that exogenous supplementation of leptin, in order to achie-ve physiological leachie-vels of the hormone, is effectiachie-ve in restoring normal glycemic control, normal serum lipid proile and liver function (10,11). In humans, leptin replacement therapy (LRT) with recombinant methio-nyl human leptin (r-metHuLeptin, metreleptin) has been evaluated by several clinical trials (12), and has been recently approved by the FDA for the treatment of patients with generalized lipodystrophy (13). Admi-nistered as a subcutaneous injection once or twice daily, metreleptin reverses the metabolic abnormalities that are seen in LS, leading to signiicant improvements in overall health (14-16).
Currently, there is no data that comprehensively and succinctly demonstrate the effect of LRT on me-tabolic and hepatic parameters in LS patients. Therefo-re, this meta-analysis sought to survey the literature in this area, and quantitatively assess the effect of LRT in patients with all forms of LS (generalized and partial,
congenital and acquired; excluding HAART-related LS) on various clinical endpoints. We sought data from clinical trials and case series on blood concentrations of glucose, insulin and glycated hemoglobin (Hb1Ac) as markers of glycemic control; triglycerides (TG), total cholesterol (TC), high-density lipoprotein (HDL) cho-lesterol and low-density lipoprotein (LDL) chocho-lesterol as markers of lipid control; and alanine aminotransfera-se (ALT), aspartate aminotransferaaminotransfera-se (AST) and albu-min as markers of liver function. Also, total liver volu-me and liver fat were assessed as radiological indings of liver health in response to LRT.
MATERIALS AND METHODS
Literature search
We conducted a literature review of published work in accordance with the PRISMA guidelines (17). Rele-vant studies were retrieved on 9/26/2013 from the MEDLINE (January 1966 to September 2013) and Cochrane Library of Clinical Trials (January 1980 to September 2013) databases. In order to identify stu-dies assessing the outcomes of LRT for the treatment of all forms of LS not related to HAART, we applied as search terms the following title/abstract phrases: [“leptin” AND (“lipodystrophy” OR “lipoatrophy”)] with no language restriction. Titles and abstracts of identiied searches were screened. In addition, refer-ence lists of all articles were manually scanned and the ‘related article tool’ provided following a term search was used to identify other potentially relevant studies. We termed these the “grey literature”. The full texts were assessed to determine eligibility for inclusion. Studies were eligible if they assessed the outcomes of systemically administered leptin as a treatment for LS. Speciic exclusion criteria were: i) study population consisting of participants whose LS were a result of HAART for the treatment of HIV; ii) studies that did not report speciic data on the outcome of glycemic, lipid or hepatic measures following leptin treatment; iii) studies evaluating an agent other than leptin or a derivative of leptin (e.g. r-metHu-leptin/metreleptin); iv) case-reports of a single individual patient; v) studies published in languages other than English.
Data abstraction
Cop
yright
© ABE&M t
odos os dir
eit
os r
eser
vados
.
blood concentrations of glucose, insulin, HbA1c, TG, TC, HDL, LDL, ALT, AST and albumin, and on liver fat and volume. Data capture was performed inde-pendently by two examiners (AJR, AGG). Data relat-ing to the study design (includrelat-ing population, patient sampling, follow-up time and leptin replacement dos-age), and baseline characteristics of study participants (including age, body mass index, LS etiology and other risk factors) were extracted. Further, we evalu-ated laboratory methods used to determine levels of systemic markers of leptin replacement outcomes. Ad-ditionally the quality of each study was assessed using a quality assessment questionnaire, which was modi-ied from the previously validated QUADAS 2 tool as there is currently no accepted quality assessment tool for studies examining leptin to treat LS (18). Our ques-tionnaire contained eight points relating to study de-sign, outcome measurement and analysis. Each point was marked as ‘yes’, ‘no’ or ‘unclear’, and the quality percentage score was based on the percentage of ‘yes’ responses that was obtained by each study. Sample co-pies of the data extraction form and quality assessment questionnaire are available upon request. Any questions or inconsistencies regarding these data were resolved through iteration and consensus. We included patients with acquired, congenital, partial and generalized forms of LS, and evaluated the effects of LRT collectively and separately by LS subtype.
Statistical methods
To mitigate against differences in the way marker con-centrations were measured and reported, the absolute levels of the aforementioned markers were converted into a common unit by calculating a standardized mean difference (SMD). Standardized mean differences were derived from the reported p-values, by calculating the t-statistic and dividing by the square root of the popula-tion size. Standard errors were estimated as the inverse of the square root of the population size. We did not include data where signiicance tests were not performed (i.e. where p-values were not reported). Heterogeneity was determined by the I2 index, which provides an
indi-cation into the inconsistencies between the studies (19). Results were presented as mean ± standard deviation (SD) or median and interquartile range (IQR). Meta-analysis was performed using an inverse-variance random effects model with RevMan v5.1 software (The Nordic Cochrane Centre, The Cochrane Collaboration, 2012).
This software allows for the automated output of forest plots, I2 index, test for overall effect, effect signiicance
and a funnel plot as an indication into publication bias.
RESULTS
Included literature
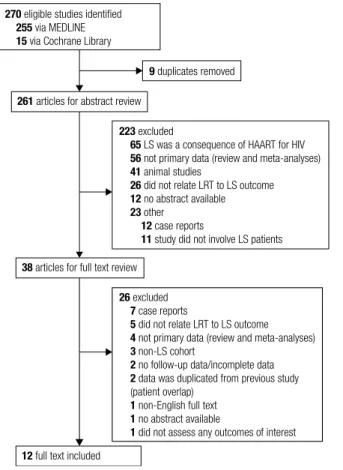
The initial database search yielded 270 abstracts, of which 261 unique abstracts were reviewed for eligibility. Following abstract screening, 223 were excluded because they did not it the inclusion criteria; mainly because they evaluated only HAART-associated LS (n = 65), or did not include primary original data (n = 56). Thirty-eight articles were eligible for full-text review. Of those, 26 were excluded mainly due to not being population-based data (case reports) or review articles and two of these stu-dies were excluded as they represented data sets based on duplicated results from previous studies (20,21). Overall, 12 studies were included for data analysis (14,16,22-31). Figure 1 illustrates the low diagram outlining literature search strategy and study selection.
270 eligible studies identiied
255 via MEDLINE
15 via Cochrane Library
223 excluded
65 LS was a consequence of HAART for HIV
56 not primary data (review and meta-analyses)
41 animal studies
26 did not relate LRT to LS outcome
12 no abstract available
23 other
12 case reports
11 study did not involve LS patients
26 excluded
7 case reports
5 did not relate LRT to LS outcome
4 not primary data (review and meta-analyses)
3 non-LS cohort
2 no follow-up data/incomplete data
2 data was duplicated from previous study
(patient overlap)
1 non-English full text
1 no abstract available
1 did not assess any outcomes of interest
9 duplicates removed
261 articles for abstract review
38 articles for full text review
12 full text included
LRT: leptin replacement therapy; LS: lipodystrophy syndromes.
Cop
yright
© ABE&M t
odos os dir
eit
os r
eser
vados
.
Table 1. Studies characteristics
Study details LS etiology
Outcome assessment
Quality score (%)
Author (reference) n Design Follow-up
(months) AGL (n) CGL (n) Partial (n) Other (n)
Beltrand and cols. (22) 7 Prospective 4 n/a 7 n/a n/a MWU test 50
Beltrand and cols. (23) 7 Prospective 28 n/a 7 n/a n/a MWU test 75
Chan and cols. (14) 55 Prospective 36 13 23 19 n/a t-test 50
Chong and cols. (24) 48 Prospective 100 12 31 n/a 4 t-test 62.5
Ebihara and cols. (25) 7 Prospective 36 2 5 n/a n/a ANOVA 37.5
Javor and cols. (26) 15 Prospective 12 4 11 n/a n/a t-test, ANOVA 50
Moran and cols. (27) 14 Prospective 12 5 7 n/a 2 t-test, ANOVA 62.5
Oral and cols. (28) 9 Prospective 12 3 5 1 n/a t-test, ANOVA 62.5
Park and cols. (29) 4 Prospective 48 n/a n/a 4 n/a t-test 62.5
Petersen and cols. (30)* 9 Case-control 3 1 2 n/a n/a t-test 25
Safar Zadeh and cols. (31) 27 Prospective 26 5 10 12 n/a t-test 62.5
Simha and cols. (16) 24 (SH) Prospective 6 n/a n/a 24 n/a ANOVA 75
24 (MH) Prospective 6 n/a n/a 24 n/a ANOVA 75
AGL: acquired generalized lipodystophy; CGL: congenital generalized lipodystrophy; MWU: Mann-Whitney U test; ANOVA: analysis of variance; n/a: not applicable. Simha and cols. (16) divided analysis into patient with severe (SH) and mild (MH) hypoleptinemia.
* The etiology of all cases was not completely reported.
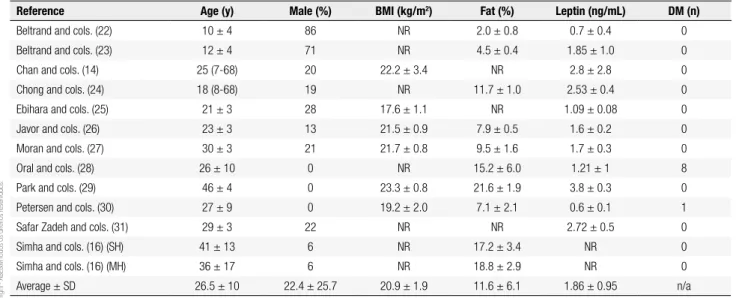
Table 2. Patients’ characteristics
Reference Age (y) Male (%) BMI (kg/m2) Fat (%) Leptin (ng/mL) DM (n)
Beltrand and cols. (22) 10 ± 4 86 NR 2.0 ± 0.8 0.7 ± 0.4 0
Beltrand and cols. (23) 12 ± 4 71 NR 4.5 ± 0.4 1.85 ± 1.0 0
Chan and cols. (14) 25 (7-68) 20 22.2 ± 3.4 NR 2.8 ± 2.8 0
Chong and cols. (24) 18 (8-68) 19 NR 11.7 ± 1.0 2.53 ± 0.4 0
Ebihara and cols. (25) 21 ± 3 28 17.6 ± 1.1 NR 1.09 ± 0.08 0
Javor and cols. (26) 23 ± 3 13 21.5 ± 0.9 7.9 ± 0.5 1.6 ± 0.2 0
Moran and cols. (27) 30 ± 3 21 21.7 ± 0.8 9.5 ± 1.6 1.7 ± 0.3 0
Oral and cols. (28) 26 ± 10 0 NR 15.2 ± 6.0 1.21 ± 1 8
Park and cols. (29) 46 ± 4 0 23.3 ± 0.8 21.6 ± 1.9 3.8 ± 0.3 0
Petersen and cols. (30) 27 ± 9 0 19.2 ± 2.0 7.1 ± 2.1 0.6 ± 0.1 1
Safar Zadeh and cols. (31) 29 ± 3 22 NR NR 2.72 ± 0.5 0
Simha and cols. (16) (SH) 41 ± 13 6 NR 17.2 ± 3.4 NR 0
Simha and cols. (16) (MH) 36 ± 17 6 NR 18.8 ± 2.9 NR 0
Average ± SD 26.5 ± 10 22.4 ± 25.7 20.9 ± 1.9 11.6 ± 6.1 1.86 ± 0.95 n/a
BMI: body mass index; DM: diabetes mellitus; NR: not reported; SH: severe hypoleptinemia; MH: mild hypoleptinemia; n/a: not applicable. Quality assessment
Quality percentage scores based on a modiied QUADAS 2 tool ranged from 25% (30) to 75% (16,23), and the overall mean score was 56.3 ± 14.6% (Table 1).
Study participants
Pooled together, the evaluated studies represented a composite population of 226 participants (45 males, 181 females). Studies had samples sizes ranging from 4 to 55, where the mean number of participants was 19.8 ± 16.8. Follow-up times ranged from 3 to 100 months, where the mean time was 26.9 ± 27.2 months.
Table 1 summarizes the characteristics of the selected studies. The average age of the participants was 26.5 ± 10.0 years. As shown in table 2, the average percentage of male participants was 22.4 ± 25.7%, and four studies did not include males in the study population (27-30). Where reported, the mean baseline BMI (body mass in-dex) of study participants was 20.9 ± 1.9 kg/m2, mean
Cop
yright
© ABE&M t
odos os dir
eit
os r
eser
vados
.
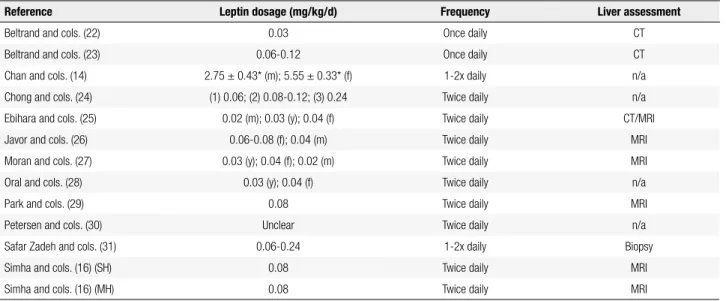
LRT details
All twelve studies included for review used r-metHu-Leptin as the form of leptin supplementation. Adminis-tration method was uniform, as all patients received r-metHuLeptin via subcutaneous injections. Most studies (n = 10) performed r-metHuLeptin administration twice daily (Table 3). Dosage of r-metHuLeptin ranged from 0.02 to 0.24 mg/kg/d for males and 0.04 to 0.24 mg/ kg/d for females. For studies that did not stratify leptin dose according to gender, dosages ranged from 0.03 to 0.24 mg/kg/d (16,22,23,28,31). Instead of reporting daily leptin dosages per body weight, Chan and cols. re-ported the mean total dose received by patients, which was 2.75 ± 0.43 mg for males and 5.55 ± 0.33 mg for fe-males (14). One study did not provide suficient data on leptin administration dosages (30). These data are sum-marized in table 3.
Comparative data analysis
Glycemic control
Seven studies reported signiicant reductions in blood glucose (24-26,28-31). The largest reduction was seen in the study by Petersen and cols. (30), where patients with LS had an initial mean baseline fasting glucose concentration of 234 ± 14 mg/dL. Following the three-month intervention, this declined to 122 ± 21 mg/dL.
Three studies reported a reduction in fasting insulin following LRT but did not report whether this was sig-niicant (16,22,30). Four studies reported a sigsig-niicant reduction in HbA1c values at follow-up (24,26,28,31), with the highest reduction being equal to 1.90% (28). One study reported an increase of 1.77% from baseli-ne mean HbA1c, but did not report whether this was signiicant (23). Supplementary table 1 illustrates the changes in fasting plasma glucose, insulin and HbA1c.
Hepatic outcomes
Three studies reported signiicant reductions in mean liver volume following leptin therapy (22,26,27). Liver fat was only reported in a single study and after stratifying results according to the participants’ degree of hypoleptinemia, either severely or mildly hypolep-tinemic, both groups of patients exhibited signiicant decreases in mean liver fat percentage (16) (Supple-mentary Table 2).
Serum albumin concentrations were evaluated by a single study, which reported no signiicant changes after LRT (27). Two studies reported signiicant decre-ases in ALT and AST (22,31). In the study by Simha and cols., neither cohort of participants showed signi-icant reductions in ALT, but severely hypoleptinemic patients showed a signiicant reduction in AST levels (16). Supplementary table 3 shows the changes in al-bumin and liver enzymes levels.
Table 3. Leptin administration and liver assessment details
Reference Leptin dosage (mg/kg/d) Frequency Liver assessment
Beltrand and cols. (22) 0.03 Once daily CT
Beltrand and cols. (23) 0.06-0.12 Once daily CT
Chan and cols. (14) 2.75 ± 0.43* (m); 5.55 ± 0.33* (f) 1-2x daily n/a
Chong and cols. (24) (1) 0.06; (2) 0.08-0.12; (3) 0.24 Twice daily n/a
Ebihara and cols. (25) 0.02 (m); 0.03 (y); 0.04 (f) Twice daily CT/MRI
Javor and cols. (26) 0.06-0.08 (f); 0.04 (m) Twice daily MRI
Moran and cols. (27) 0.03 (y); 0.04 (f); 0.02 (m) Twice daily MRI
Oral and cols. (28) 0.03 (y); 0.04 (f) Twice daily n/a
Park and cols. (29) 0.08 Twice daily MRI
Petersen and cols. (30) Unclear Twice daily n/a
Safar Zadeh and cols. (31) 0.06-0.24 1-2x daily Biopsy
Simha and cols. (16) (SH) 0.08 Twice daily MRI
Simha and cols. (16) (MH) 0.08 Twice daily MRI
m: male data; f: female data; y: youth data; SH: severe hypoleptinemia; MH: mild hypoleptinemia; n/a: not available. “1”, “2” and “3” refer to subgroups of the study. CT: computed tomography, MRI: magnetic resonance imaging.
Cop
yright
© ABE&M t
odos os dir
eit
os r
eser
vados
.
Supplementary Table 1. Comparison of fasting plasma glucose, insulin and HbA1c at baseline and follow-up
Reference Fasting plasma glucose (mg/dL) Fasting insulin (pmol/L) HbA1c (%)
B F P B F P B F P
Beltrand and cols. (22) 80 ± 7 80 ± 5 NS 135 ± 84 91 ± 78 NS NR NR NR
Beltrand and cols. (23) NR NR NR 212 ± 92 601 ± 1055 NR 5.4 ± 1.0 7.2 ± 4.0 NR
Chan and cols. (14) 184 ± 91 124 ± 13 NR NR NR NR 8.5 ± 2.1 6.3 ± 0.3 NR
Chong and cols. (24) 164 ± 13 129 ± 12 0.014 NR NR NR 8.4 ± 2.0 6.9 ± 1.7 < 0.001
Ebihara and cols. (25) 172 ± 2 113 ± 9 < 0.01 NR NR NR 9.3 ± 0.4 NR NR
Javor and cols. (26) 205 ± 19 126 ± 11 < 0.001 NR NR NR 9.0 ± 0.4 7.1 ± 0.5 < 0.001
Moran and cols. (27) NR NR NR NR NR NR 9.1 7.1 NR
Oral and cols. (28) 230 ± 74 132 ± 47 < 0.001 NR NR NR 9.1 ± 0.5 7.2 ± 0.5 0.001
Park and cols. (29) 190 ± 26 151 ± 15 0.006 NR NR NR 8.4 ± 0.6 8.0 ± 0.4 NS
Petersen and cols. (30) 234 ± 14 122 ± 21 < 0.05 181 ± 28 160 ± 28 NS 8.5 ± 1.0 8.2 ± 1.3 NS
Safar Zadeh and cols. (31) 178 ± 15 117 ± 9 0.004 NR NR NR 7.9 ± 0.4 6.3 ± 0.2 0.0009
Simha and cols. (16) (SH) 111 ± 39 106 ± 32 NS 276 ± 223 209 ± 166 NS 6.7 ± 1.7 6.3 ± 1.5 NS
Simha and cols. (16) (MH) 111 ± 4 97 ± 24 NS 432 ± 315 298 ± 366 NS 6.4 ± 1.8 6.7 ± 2.6 NS
B: baseline; F: follow-up; P: P-value; NS: not signiicant; NR: not reported; SH: severe hypoleptinemia; MH: mild hypoleptinemia.
Supplementary Table 2. Comparison of liver volume and fat liver percentage at baseline and follow-up
Reference Liver volume (L) Liver fat (%)
B F P B F P
Beltrand and cols. (22)* 4.5 ± 1.4 3.2 ± 0.9 0.002 NR NR NR
Ebihara and cols. (25) 1.9 ± 0.1 1.5 ± 0.1 NR NR NR NR
Javor and cols. (26) 3.7 ± 0.3 2.2 ± 0.1 < 0.001 NR NR NR
Moran and cols. (27) 3.0 ± 0.3 2.2 ± 0.2 < 0.001 NR NR NR
Park and cols. (29) 2.1 ± 0.2 2.0 ± 0.3 NS NR NR NR
Simha and cols. (16) (SH) NR NR NR 8.8 (5.2-11.9) 4.9 (1.6-11.6) < 0.001
Simha and cols. (16) (MH) NR NR NR 23.7 (10.2-34.2) 9.2 (7.3-35.5) < 0.01
B: baseline; F: follow-up; P: P-value; NS: not signiicant; NR: not reported; SH: severe hypoleptinemia; MH: mild hypoleptinemia. * Result provided as z-score.
Supplementary Table 3. Comparison of liver enzymes and albumin at baseline and follow-up
Reference ALT (U/L) AST (U/L) Albumin (g/L)
B F P B F P B F P
Beltrand and cols. (22) 105 ± 99 35 ± 17 0.02 47 ± 41 25 ± 7 0.04 NR NR NR
Beltrand and cols. (23) 67 ± 43 51 ± 23 NR 35.1 ± 15 40.4 ± 17 NR NR NR NR
Chan and cols. (14) 100 ± 120 29 ± 4 NR 71 ± 77 24 ± 1 NR NR NR NR
Ebihara and cols. (25) 81 ± 24 32 ± 5 NR 42 ± 11 22 ± 4 NR 18 ± 11 NR NR
Moran and cols. (27) NR NR NR NR NR NR 40 ± 1 37 ± 2 NS
Safar Zadeh and cols. (31) 99 ± 19 53 ± 12 0.002 66 ± 11 35 ± 5 0.002 NR NR NR
Simha and cols. (16) (SH) 25 ± 11 21 ± 8 NS 24 ± 9 20 ± 8 < 0.05 NR NR NR
Simha and cols. (16) (MH) 34 ± 17 35 ± 29 NS 26 ± 8 245 ± 14 NS NR NR NR
Cop
yright
© ABE&M t
odos os dir
eit
os r
eser
vados
.
Lipid proile
Seven studies reported signiicant reductions in se-rum TG (22,25,26,28-31). The largest reduction was shown by Petersen and cols., where patients had a mean baseline TG level of 5,851 ± 5,079 mg/dL, decreas-ing to 1,134 ± 523 mg/dL followdecreas-ing three months of LRT (30). When stratiied by hypoleptinemic status, signiicant reductions in TG concentration were ob-served in participants with mild and severe hypolepti-nemia (16). Two studies showed signiicant reductions in TC concentrations (24,29), and one study reported a signiicant increase in TC levels following LRT (22). Six studies recorded changes in HDL following LRT (7,22,24,26,28,30), but none of them reported signii-cant changes. One study reported a signiisignii-cant decrease in LDL from a mean of 139 ± 16 mg/dL at baseline and 85 ± 7 mg/dL following 12 months of leptin re-placement (26). Supplementary table 4 illustrates all the changes in blood lipids following LRT.
Sub-analysis of LRT on LS subtype
In order to assess whether the effects of LRT varied ac-cording to the type of LS, we compiled all available indi-vidual patient data from the included studies for each of the endpoints assessed. However, besides not being lar-ge enough, results from this data set were very heterolar-ge- heteroge-neous within groups, not allowing meaningful compa-rative analyses. For example, liver fat data were available for 8 patients with generalized LS and for zero patients with partial LS. Briely, in endpoints with available data,
median changes in glycemic parameters were larger in patients with generalized LS (n = 30), compared to pa-tients with partial LS (n = 7): fasting glucose decreased by a median 47.50 mg/dL in patients with generalized LS, and by 28.00 mg/dL in patients with partial LS; HbA1c was reduced by 1.85% in patients with genera-lized LS, compared to a reduction of 0.90% in patients with partial LS. However median reductions in TG were greater in patients with partial LS (332.5 mg/dL) com-pared to patients with generalized LS (306.3 mg/dL). When stratifying by acquired or congenital forms, where data is available, patients with acquired LS (n = 5) sho-wed greater median decreases in glucose (100.0 mg/dL
vs. 57.0 mg/dL), HbA1c (1.30% vs. 0.90%), and TG (822.0 mg/dL vs. 238.0 mg/dL) relative to patients with congenital LS (n = 24).
Meta-analysis
Leptin replacement therapy produced a reduction in fasting plasma glucose in patients with LS. The stan-dardized mean difference was 0.75, with a 95% coni-dence interval ranging from 0.36 to 1.13, representing an overall signiicant decrease (p = 0.0001). Heteroge-neity for this test was high (I2 = 84%) (Supplementary
Figure 1A). No study reported a signiicant alteration in fasting insulin following LRT, and this was relected in a change in SMD of 0.00 (-0.41, 0.41; p = 1.00) (Supple-mentary Figure 1B). As this analysis showed a heteroge-neity of 0%, meta-analysis was performed using a ixed-effects model. Patients on LRT experienced an overall
Supplementary Table 4. Comparison of blood lipids at baseline and follow-up
Reference Triglycerides (mg/dL) Total cholesterol (mg/dL) HDLc (mg/dL) LDLc (mg/dL)
B F P B F P B F P B F P
Beltrand and cols. (22) 6.8 ± 3.2* 2.5 ± 1.0* 0.017 0.5 ± 2.1* 0.9 ± 0.2* 0.009 NR NR NR NR NR NR
Beltrand and cols. (23) NR NR NR 151 ± 41 188 ± 73 NR 32 ± 5 33 ± 8 NR NR NR NR
Chan and cols. (14) 479 ± 80 164 ± 26 NR 244 ± 148 142 ± 9 NR 32 ± 9 34 ± 2 NR 118 ± 48 75 ± 10 NR
Chong and cols. (24) NR NR NR 253 ± 20 164 ± 8 < 0.001 32 ± 2 31 ± 2 NS 110 ± 12 267 ± 66 NS
Ebihara and cols. (25) 700± 272 178 ± 58 < 0.01 233 ± 18 NR NR NR NR NR NR NR NR
Javor and cols. (26) 1380 ± 500 516 ± 236 < 0.001 NR NR NR 31 ± 3 29 ± 2 NS 139 ± 16 85 ± 7 0.01
Oral and cols. (28) 1405 ± 2926 563 ± 338 < 0.001 NR NR NR NR NR NR NR NR NR
Park and cols. (29) 749 ± 331 510 ± 269 0.026 280 ± 49 231 ± 41 0.012 40 ± 3 36 ± 5 NS 135 ± 4 118 ± 8 NS
Petersen and cols. (30) 5851 ± 5079 1134 ± 523 < 0.003 360 ± 130 161 ± 12 NS 44 ± 24 20 ± 2 NS NR 65 ± 13 NR
Safar Zadeh and cols. (31) 952 ± 291 303 ± 65 0.0002 NR NR NR NR NR NR NR NR NR
Simha and cols. (16) (SH) 228 (180-506) 183 (116-220) < 0.05 185 ± 46 169 ± 28 NS 34 ± 8 35 ± 9 NS NR NR NR
Simha and cols. (16) (MH) 423 (295-813) 339 (275-359) < 0.05 237 ± 66 242 ± 134 NS 33 ± 7 33 ± 5 NS NR NR NR
Cop
yright
© ABE&M t
odos os dir
eit
os r
eser
vados
.
decrease in HbA1c, with a SMD of 0.49 (0.17-0.81). This effect was signiicant (p = 0.003) and heterogeneity was high (I2 = 75%) (Supplementary Figure 1C).
Liver volume of LS patients signiicantly decrea-sed following LRT. Three studies had signiicant
re-ductions, and the overall SMD was 1.06 (0.51, 1.61), where p = 0.0002. Heterogeneity was 64% (Supple-mentary Figure 2A). Liver transaminases were signii-cantly decreased when comparing mean data in cases and controls; however only AST showed a signiicant
Supplementary Figure 1. Forest plot analyzing the effects of leptin replacement therapy on fasting plasma glucose (A), insulin (B) and HbA1c (C).
A. Glucose
Study SMD SE Weight (%) SMD, 95% CI, I-V
Random effects
Simha (MH) 2012 (n = 24) 0.0 0.2 11.3 0.00 [-0.39, 0.39]
Simha (SH) 2012 (n = 24) 0.0 0.2 11.3 0.00 [-0.39, 0.39]
Beltrand 2007 (n = 7) 0.0 0.38 8.7 0.00 [-0.74, 0.74]
Chong 2010 (n = 48) 0.37 0.14 12.1 0.37 [0.10, 0.64]
Safar Zadeh 2013 (n = 27) 0.61 0.19 11.5 0.61 [0.24, 0.98]
Peterson 2002 (n = 9) 0.75 0.33 9.4 0.75 [0.10, 1.40]
Javor 2005 (n = 15) 1.05 0.26 10.5 1.05 [0.54, 1.56]
Ebihara 2007 (n = 7) 1.32 0.38 8.7 1.32 [0.58, 2.06]
Oral 2002 (n = 9) 1.59 0.33 9.4 1.59 [0.94, 2.24]
Park 2007 (n = 4) 2.66 0.5 7.0 2.66 [1.68, 3.64]
Total (95% CI) 100.0 0.75 [0.36, 1.13]
Heterogeneity: Tau² = 0.30; Chi² = 54.67, df = 9 (P < 0.00001); I² = 84% Test for overall effect: Z = 3.79 (P = 0.0001).
B. Insulin
Study SMD SE Weight (%) SMD, 95% CI, I-V
Random effects
Beltrand 2010 (n = 7) 0.0 0.38 30.1 0.00 [-0.74, 0.74]
Peterson 2002 (n = 9) 0.0 0.33 39.9 0.00 [-0.65, 0.65]
Beltrand 2007 (n = 7) 0.0 0.38 30.1 0.00 [-0.74, 0.74]
Total (95% CI) 100.0 0.00 [-0.41, 0.41]
Heterogeneity: Chi² = 0.00, df = 2 (P = 1.00); I² = 0% Test for overall effect: Z = 0.00 (P = 1.00).
C. HbA1c
Study SMD SE Weight (%) SMD, 95% CI, I-V
Random effects
Park 2007 (n = 4) 0.0 0.5 6.5 0.00 [-0.98, 0.98]
Peterson 2002 (n = 9) 0.0 0.33 9.8 0.00 [-0.65, 0.65]
Simha (SH) 2012 (n = 24) 0.0 0.2 13.0 0.00 [-0.39, 0.39]
Simha (MH) 2012 (n = 24) 0.0 0.2 13.0 0.00 [-0.39, 0.39]
Beltrand 2010 (n = 7) 0.5 0.38 8.7 0.50 [-0.24, 1.24]
Chong 2010 (n = 48) 0.51 0.14 14.4 0.51 [0.24, 0.78]
Safar Zadeh 2013 (n = 27) 0.72 0.19 13.3 0.72 [0.35, 1.09]
Javor 2005 (n = 15) 1.05 0.26 11.5 1.05 [0.54, 1.56]
Oral 2002 (n = 9) 1.59 0.33 9.8 1.59 [0.94, 2.24]
Total (95% CI) 100.0 0.49 [0.17, 0.81]
Heterogeneity: Tau² = 0.17; Chi² = 32.26, df = 8 (P < 0.0001); I² = 75% Test for overall effect: Z = 2.96 (P = 0.003).
Std. mean difference IV, random, 95% CI
Std. mean difference IV, random, 95% CI
Std. mean difference IV, random, 95% CI Increase
Increase
Increase
Decrease
Decrease
Decrease
-4 -2 0 2 4
-2 -1 0 1 2
-2 -1 0 1 2
Cop
yright
© ABE&M t
odos os dir
eit
os r
eser
vados
.
reduction in meta-analysis 0.41 (0.10, 0.73) where p = 0.01 and heterogeneity was 52%. For ALT, the SMD was a non-signiicant 0.36 (-0.03, 0.75), p = 0.07 and heterogeneity was 69% (Supplementary Figure 2E). Meta-analysis was not performed from results of liver fat or albumin as these data sets were based on data from single studies only.
Triglycerides and total cholesterol were signiican-tly reduced. The SMD for TG was 1.00 (0.69, 1.31), where the heterogeneity was high (I2 = 64%) and p <
0.00001 (Supplementary Figure 3A). The effect on TC was 0.62 (0.21, 1.02), where p = 0.003 and I2 =
80% (Supplementary Figure 3B). There was no signi-icant overall effect on HDL and LDL levels. The ove-rall SMD for HDL was a non-signiicant 0.00 (-0.16, 0.17) (Supplementary Figure 3C). Similarly, a single study reported a standardized mean reduction in LDL (25). However, the overall effect of leptin on LDL levels was not signiicant [0.21 units (-0.20, 0.62)] (Supplementary Figure 3D).
Supplementary Figure 2. Forest plot analyzing the effect of leptin replacement therapy on liver volume (A), ALT (B) and AST (C).
A. Liver volume
Study SMD SE Weight (%) SMD, 95% CI, I-V Random
effects
Park 2007 (n = 4) 0 0.5 17.7 0.00 [-0.98, 0.98]
Javor 2005 (n = 15) 1.05 0.26 29.9 1.05 [0.54, 1.56]
Moran 2004 (n = 14) 1.11 0.27 29.3 1.11 [0.58, 1.64]
Beltrand 2007 (n = 7) 1.81 0.38 23.1 1.81 [1.07, 2.55]
Total (95% CI) 100.0 1.06 [0.51, 1.61]
Heterogeneity: Tau² = 0.20; Chi² = 8.37, df = 3 (P = 0.04); I² = 64%. Test for overall effect: Z = 3.77 (P = 0.0002).
B. ALT
Study SMD SE Weight (%) SMD, 95% CI, I-V Random
effects
Simha (SH) 2012 (n = 24) 0.0 0.2 23.5 0.00 [-0.39, 0.39]
Simha (MH) 2012 (n = 24) 0.0 0.2 23.5 0.00 [-0.39, 0.39]
Beltrand 2010 (n = 7) 0.28 0.38 14.5 0.28 [-0.46, 1.02]
Safar Zadeh 2013 (n = 27) 0.66 0.19 24.0 0.66 [0.29, 1.03]
Beltrand 2007 (n = 7) 1.13 0.38 14.5 1.13 [0.39, 1.87]
Total (95% CI) 100.0 0.36 [-0.03, 0.75]
Heterogeneity: Tau² = 0.13; Chi² = 12.86, df = 4 (P = 0.01); I² = 69%. Test for overall effect: Z = 1.82 (P = 0.07).
C. AST
Study SMD SE Weight (%) SMD, 95% CI, Random effects
Simha (SH) 2012 (n = 24) 0.0 0.2 24.8 0.00 [-0.39, 0.39]
Beltrand 2010 (n = 7) 0.17 0.38 12.3 0.17 [-0.57, 0.91]
Simha (MH) 2012 (n = 24) 0.42 0.2 24.8 0.42 [0.03, 0.81]
Safar Zadeh 2013 (n = 27) 0.66 0.19 25.8 0.66 [0.29, 1.03]
Beltrand 2007 (n = 7) 0.95 0.38 12.3 0.95 [0.21, 1.69]
Total (95% CI) 100.0 0.41 [0.10, 0.73]
Heterogeneity: Tau² = 0.06; Chi² = 8.34, df = 4 (P = 0.08); I² = 52%. Test for overall effect: Z = 2.57 (P = 0.01).
Std. mean difference IV, random, 95% CI
Increase Decrease -2 -1 0 1 2
Std. mean difference IV, random, 95% CI
Increase Decrease -2 -1 0 1 2
Std. mean difference IV, random, 95% CI
Increase Decrease -2 -1 0 1 2
Cop
yright
© ABE&M t
odos os dir
eit
os r
eser
vados
.
A. Triglycerides
Study SMD SE Weight (%) SMD, 95% CI, I-V Random effects
Simha (SH) 2012 (n = 24) 0.42 0.2 14.3 0.42 [0.03, 0.81] Simha (MH) 2012 (n = 24) 0.42 0.2 14.3 0.42 [0.03, 0.81] Safar Zadeh 2013 (n = 27) 0.83 0.19 14.6 0.83 [0.46, 1.20] Javor 2005 (n = 15) 1.05 0.26 12.3 1.05 [0.54, 1.56] Beltrand 2007 (n = 7) 1.18 0.38 8.9 1.18 [0.44, 1.92] Ebihara 2007 (n = 7) 1.32 0.38 8.9 1.32 [0.58, 2.06] Peterson 2002 (n = 9) 1.34 0.33 10.2 1.34 [0.69, 1.99] Oral 2002 (n = 9) 1.59 0.33 10.2 1.59 [0.94, 2.24] Park 2007 (n = 4) 1.73 0.5 6.4 1.73 [0.75, 2.71] Total (95% CI) 100.0 1.00 [0.69, 1.31]
Heterogeneity: Tau² = 0.13; Chi² = 22.45, df = 8 (P = 0.004); I² = 64%. Test for overall effect: Z = 6.39 (P < 0.00001).
B. Total cholesterol
Study SMD SE Weight (%) SMD, 95% CI, I-V
Random effects Peterson 2002 (n = 9) 0.0 0.33 11.8 0.00 [-0.65, 0.65] Simha (SH) 2012 (n = 24) 0.0 0.2 14.6 0.00 [-0.39, 0.39] Simha (MH) 2012 (n = 24) 0.0 0.2 14.6 0.00 [-0.39, 0.39] Chong 2010 (n = 48) 0.51 0.14 15.7 0.51 [0.24, 0.78] Beltrand 2010 (n = 7) 0.64 0.38 10.7 0.64 [-0.10, 1.38] Javor 2005 (n = 15) 1.05 0.26 13.3 1.05 [0.54, 1.56] Beltrand 2007 (n = 7) 1.35 0.38 10.7 1.35 [0.61, 2.09] Park 2007 (n = 4) 2.18 0.5 8.5 2.18 [1.20, 3.16] Total (95% CI) 100.0 0.62 [0.21, 1.02]
Heterogeneity: Tau² = 0.25; Chi² = 35.32, df = 7 (P < 0.00001); I² = 80%. Test for overall effect: Z = 3.00 (P = 0.003).
C. HDL cholesterol
Study SMD SE Weight (%) SMD, 95% CI, I-V
Random effects Simha (MH) 2012 (n = 24) 0.0 0.2 18.4 0.00 [-0.39, 0.39]
Simha (SH) 2012 (n = 24) 0.0 0.2 18.4 0.00 [-0.39, 0.39]
Park 2007 (n = 4) 0.0 0.5 2.9 0.00 [-0.98, 0.98]
Javor 2005 (n = 15) 0.0 0.26 10.9 0.00 [-0.51, 0.51] Chong 2010 (n = 48) 0.0 0.14 37.5 0.00 [-0.27, 0.27]
Peterson 2002 (n = 9) 0.0 0.33 6.8 0.00 [-0.65, 0.65]
Beltrand 2010 (n = 7) 0.08 0.38 5.1 0.08 [-0.66, 0.82]
Total (95% CI) 100.0 0.00 [-0.16, 0.17]
Heterogeneity: Chi² = 0.04, df = 6 (P = 1.00); I² = 0%. Test for overall effect: Z = 0.05 (P = 0.96).
D. LDL cholesterol
Study SMD SE Weight (%) SMD, 95% CI, I-V
Random effects Chong 2010 (n = 48) 0.0 0.14 38.6 0.00 [-0.27, 0.27]
Peterson 2002 (n = 9) 0.0 0.33 21.6 0.00 [-0.65, 0.65]
Park 2007 (n = 4) 0.0 0.5 12.7 0.00 [-0.98, 0.98]
Javor 2005 (n = 15) 0.76 0.26 27.1 0.76 [0.25, 1.27] Total (95% CI) 100.0 0.21 [-0.20, 0.62]
Heterogeneity: Tau² = 0.09; Chi² = 6.94, df = 3 (P = 0.07); I² = 57%. Test for overall effect: Z = 0.98 (P = 0.32).
Supplementary Figure 3. Forest plot analyzing the effect of leptin replacement therapy on triglycerides (A), total cholesterol (B), HDL cholesterol (C), and LDL cholesterol (D).
Std. mean difference IV, random, 95% CI
Increase Decrease -2 -1 0 1 2
Std. mean difference IV, random, 95% CI
Increase Decrease -2 -1 0 1 2
Std. mean difference IV, ixed, 95% CI
Increase Decrease -2 -1 0 1 2
Std. mean difference IV, random, 95% CI
Increase Decrease
-2 -1 0 1 2
Cop
yright
© ABE&M t
odos os dir
eit
os r
eser
vados
.
DISCUSSION
Lipodystrophy syndromes that are not associated with the use of HAART are rare conditions, and present several metabolic and hepatic abnormalities, caused by changes in circulating adipokines levels. The decrease of plasma leptin levels plays a key role in the patho-physiology of those abnormalities. Leptin replacement therapy is currently the therapy of choice for those conditions, and it was recently approved by the FDA for the treatment of patients with generalized lipodys-trophy (13). Although several studies have investigated the safety and eficacy of LRT in patients with LS, no systematic meta-analysis of those results has been per-formed so far. This meta-analysis reports that LRT in non-HAART LS patients improves fasting plasma glu-cose and HbA1c values, reduces serum TG and TC lev-els, and reduces liver volume, and transaminases. Taken together, the results of this meta-analysis suggest that leptin is effective at ameliorating clinical and biochemi-cal endpoints of undistinguished non-HAART LS pa-tients, and at improving overall health in these patients.
Leptin is an adipokine with key roles in regulating food intake, energy balance and body weight. Leptin also plays important roles on lipid and glucose meta-bolism, the gonadal, adrenal, somatotropic and thyroid axes, sympathetic tone, biomarkers of cardiovascular di-sease, immunity, inlammation, and brain structure and function (5,6,32-34). In humans, leptin deiciency is observed in cases of hypothalamic amenorrhea, anore-xia nervosa, genetic deiciency due to mutations in the leptin gene, and LS. The metabolic abnormalities are similar in all cases of leptin deiciency: increased insu-lin resistance, hyperinsuinsu-linemia, altered fasting glucose or diabetes, hypertriglyceridemia, and hepatic steatosis (35). Leptin replacement therapy has been evaluated in those conditions, showing signiicant metabolic im-provements. In humans with genetic leptin deiciency due to mutations in the leptin gene, our group has sho-wn that LRT improves the glucose-insulin homeosta-sis, decreases serum triglycerides, reduces lipogenehomeosta-sis, and increases lipolysis (34). In another patient, it has also been shown that LRT reduces circulating levels of transaminases, total cholesterol, LDL, insulin resistan-ce, and liver fat content (36). Similarly, our previous research has shown that white adipose tissue transplan-tation from wild-type mice into genetically obese and leptin deicient ob/ob mice leads to the improvement
of several metabolic parameters, and to the reversal of nonalcoholic fatty liver disease, due to the correction of the leptin-deicient state (37).
The combined results of the studies included in this meta-analysis suggest that leptin administration is res-ponsible for similar improvements. Analogous to the re-sults in our mouse and human models of genetic leptin deiciency, the data presented here indicate that leptin inluences the outcome of glucose and lipid metabolism in humans with LS. Fasting glucose and glycated he-moglobin, two important markers of glycemic control were decreased following intervention (p = 0.0001 and p = 0.003 respectively) (Supplementary Figure 1). Lep-tin therapy resulted in signiicant reductions in blood triglycerides (p < 0.00001) and total cholesterol (p = 0.003) (Supplementary Figure 3), which are predictive markers of cardiovascular disease. Moreover, liver volu-me and AST were signiicantly decreased (p = 0.0002 and p = 0.01) (Supplementary Figure 2), suggesting that LRT is effective in the improvement of hepatic pa-thology associated with LS. Liver fat was reduced in response to leptin therapy but meta-analysis was not possible as this data was based on results from a single study that reported the outcome of liver fat. However, recent studies do suggest that leptin therapy is effective at reducing hepatic steatosis associated with lipodystro-phy (38).
Cop
yright
© ABE&M t
odos os dir
eit
os r
eser
vados
.
in patients with elevated baseline levels of these end-points. For example, in patients with the generalized form with a baseline HbA1c ≥ 6%, a mean reduction of 2.3% was achieved following the 12-month trial period. However, in patients with a baseline HbA1c ≥ 8%, this reduction was even greater, at 2.7%. Similarly, in pa-tients with partial lipodystrophy with baseline HbA1c ≥ 7%, the mean reduction in HbA1c was 0.8%, whereas mean HbA1c reduction of 1.4% was observed in pa-tients with partial LS and baseline HbA1c ≥ 8%. Similar patterns were observed in all assessed parameters, which lead the investigators to suggest that in recovering a he-althy phenotype, the effect of metreleptin is more pro-nounced in those patients with more severe underlying metabolic abnormalities. Furthermore, the investiga-tors noted that the clinical eficacy of metreleptin was more related to the severity of the underlying metabolic abnormalities, rather than to the form of lipodystrophy (generalized or partial). To assess this claim, a further sub-analysis was performed by stratifying data for the two main outcomes (HbA1c and TG), according to lipodystrophy subtype (39). This sub-analysis showed that more pronounced effects were seen in patients with the generalized form, with mean reductions in se-rum HbA1c and TG equal to 1.4% (SE = 0.2) and 121 mg/dL (SE = not reported) respectively. Interestingly, similar results were seen across patients with congeni-tal or acquired variants of each lipodystrophy subtype (39). Our analysis showed a similar pattern of results where patients with generalized LS showed greater improvements in the endpoints of glucose and HbA1c relative to patients with partial LS. Similarly relative to patients with congenital LS, patients with acquired LS had greater reductions in blood glucose, HbA1c and TG. However, the small size and high heterogeneity of our data set makes statistical comparisons between subtypes of LS underpowered and not signiicant.
Our analysis suggests that, overall, metreleptin is more effective in ameliorating the condition of pa-tients with the generalized forms of lipodystrophy, even though it has been suggested that the drug might be useful in partial lipodystrophy, who present a more he-terogeneous disease proile. Overall, improvements with metreleptin have been related to the severity of the ba-seline metabolic abnormalities of the patient, and not necessarily dependent on severity of leptin deiciency or the type of LS. Although, the use of metreleptin to treat partial lipodystrophy was not entirely discouraged, but
a thorough physical exam was advised by the authors of the NIH sponsored trials in determining further treat-ment (39).
The results of this meta-analysis were inluenced by several factors. Importantly, the sample sizes of each study varied signiicantly, from n = 4 to n = 55 (Ta-ble 1). Smaller studies represent important exploratory trials, providing data on clinical eficacy and safety, which are useful to direct regulatory bodies in develo-ping guidelines for metreleptin use. However, from a statistical perspective, small trials may be prone to lar-ge variances in results, as individual differences have a signiicant impact in inal data. To overcome this, we employed the standard error (SE) of the standardized mean difference (SMD) to be inversely proportional to the study population size. In this way, the smallest trials had the largest SE, which relected into a lower weighting of those small trials in the inal analysis. In the meta-analysis, heterogeneity was generally high, ranging from I2 = 84% for the outcome of glucose to
0% for HDL cholesterol and insulin (employed a ixed effects model in these instances). This means that a low percentage of all variability in effect size estimates was caused by sampling errors within the studies. In other words, most of the variability was caused by true hete-rogeneity between studies (19). In considering a con-sistent pattern of results seen in several parameters, lar-ge heterolar-geneity may be seen as strength, in that leptin improves these endpoints in several settings.
lep-Cop
yright
© ABE&M t
odos os dir
eit
os r
eser
vados
.
tin. However, a similar pattern of results is seen across all the studies, which would suggest that r-metHu-leptin is effective in patients with differing states of leptin-de-iciency, paralleling the indings of the NIH-sponsored trials. Therefore, it would be reasonable to assume that leptin may be applicable for clinical use in other non--lipodystrophy leptin-deicient conditions. Indeed, leptin has previously been investigated in hypothalamic ame-norrhea with positive results (40,41). Finally, age- and sex-speciic effects cannot be discounted as possible sour-ces of variation and error, and future clinical trials should investigate these aspects, as some studies assessed here in-cluded only children, and others only women (Table 2). This meta-analysis has some limitations. Most im-portantly, this analysis was restricted to clinical data from studies using leptin to treat forms of lipodystrophy that did not arise out of complications from HAART for HIV infection. This form of LS was excluded be-cause it has a unique pathophysiological basis, and the-refore may introduce an important confounding factor to the meta-analysis. As such, we have excluded a sig-niicant amount of data relating to the effect of leptin replacement in the treatment of lipodystrophy. Inde-ed, 65 articles were excludInde-ed, from the 261 abstracts eligible for inclusion from initial database searching (Figure 1). Secondly, in order to perform the meta--analysis, we pooled together data from prospective co-hort studies and clinical case series that were conducted in a similar fashion. The exclusion of case reports [e.g. (21,22,24,27-30)] may not relect adequately the rea-lity of the management of lipodystrophy, but this ap-proach was necessary in order to increase the statistical quality and power of the analyzed data, as case reports are less powerful forms of clinical experimentation and observation, and are subject to increased bias compared to larger prospective studies. Thirdly, this review obtai-ned data from publicly available literature, and as such, we did not have access to primary data. This hindered the completion of some observations and proper com-parison of baseline and follow-up results. The outcome of the meta-analysis could be strengthened by including those missing data, including the signiicance levels of baseline and follow-up data. For example, Beltrand and cols. (21) reported an increase in HbA1c, but did not provide a signiicance test, and therefore we could not include this as part of our data analysis. Those missing data also extend to other qualitative data such as repor-ting the use of other medications by the patients. The
use of medications to treat the clinical manifestation of lipodystrophy, in particular glucose and lipid lowering drugs can signiicantly impact on interpreting the true effects of leptin on these endpoints. Finally, our quality assessment suggests that the studies included for meta--analysis can be improved in several aspects (range of quality scores 25-75%), and that future studies would need to address the limitations outlined here and by the authors of the studies themselves.
To our knowledge, this paper represents the irst comprehensive meta-analysis into the effects of leptin in patients with non-HAART associated LS, focusing on several metabolic parameters as well as classic liver parameters. In patients with undistinguished forms of LS (congenital/acquired, partial/generalized), leptin replacement therapy was effective in improving para-meters of glucose-insulin and liver homeostasis, and blood lipids. Although data suggest that metreleptin may be clinically effective for patients with partial for-ms of lipodystrophy, a meta-analysis into this type of LS was not possible due to the small sample size and its heterogeneity. Our indings may guide future cli-nical research for expansion of the use of metreleptin for partial forms of LS, and for the development of leptin-based therapies for conditions such as metabo-lic syndrome, nonalcohometabo-lic fatty liver disease and other conditions where patients display similar metabolic ab-normalities.
Author contributions: Alexander J. Rodríguez helped conceive the study, performed literature searches, data extraction, statisti-cally analyzed data, wrote the manuscript and reviewed the inal draft. Teresa Neeman aided statistical data analysis. Aaron G. Gi-les performed data extraction and reviewed the inal draft. Clau-dio A. Mastronardi provided expert advice and reviewed the inal draft. Gilberto Paz-Filho conceived the study, provided expert advice and reviewed the inal draft.
Funding: this work was supported by The Australian National University.
Acknowledgements: none.
Disclosure: no potential conlict of interest relevant to this article was reported.
REFERENCES
Cop
yright
© ABE&M t
odos os dir
eit
os r
eser
vados
.
2. Ahima RS, Flier JS. Adipose tissue as an endocrine organ. Trends Endocrinol Metab. 2000;11:327-32.
3. Lima FB. Adipose tissue: a brief historical perspective and the present moment. Arq Bras Endocrinol Metabol. 2008;52:927-8. 4. Caldas D, Silva Júnior WS, Simonetti JP, Costa EV, Farias MLF.
Biochemical, hormonal and genetic evaluation of the families of two Brazilian patients with type 2 familial partial lipodystrophy. Arq Bras Endocrinol Metabol. 2013;57:583-93.
5. Paz-Filho G, Mastronardi C, Delibasi T, Wong ML, Licinio J. Con-genital leptin deiciency: diagnosis and effects of leptin replace-ment therapy. Arq Bras Endocrinol Metabol. 2010;54:690-7. 6. Paz-Filho G, Mastronardi C, Franco CB, Wang KB, Wong ML,
Li-cinio J. Leptin: molecular mechanisms, systemic pro-inlammato-ry effects, and clinical implications. Arq Bras Endocrinol Metabol. 2012;56:597-607.
7. Chan JL, Oral EA. Clinical classiication and treatment of
congeni-tal and acquired lipodystrophy. Endocr Pract. 2010;16:310-23. 8. Shimomura I, Hammer RE, Ikemoto S, Brown MS, Goldstein JL.
Leptin reverses insulin resistance and diabetes mellitus in mice with congenital lipodystrophy. Nature. 1999;401:73-6.
9. Simha V, Garg A. Inherited lipodystrophies and
hypertriglyceride-mia. Curr Opin Lipidol. 2009;20:300-8.
10. Asilmaz E, Cohen P, Miyazaki M, Dobrzyn P, Ueki K, Fayzikhod-jaeva G, et al. Site and mechanism of leptin action in a rodent form of congenital lipodystrophy. J Clin Invest. 2004;113:414-24. 11. Nagao K, Inoue N, Ujino Y, Higa K, Shirouchi B, Wang YM, et al.
Effect of leptin infusion on insulin sensitivity and lipid metabo-lism in diet-induced lipodystrophy model mice. Lipids Health Dis. 2008;7:8.
12. Simha V. Metreleptin for metabolic disorders associated with gen-eralized or partial lipodystrophy. Expert Rev Endocrinol Metab. 2014;9:205-12.
13. Chou K, Perry CM. Metreleptin: irst global approval. Drugs. 2014;73:989-97.
14. Chan JL, Lutz K, Cochran E, Huang W, Peters Y, Weyer C, et al. Clinical effects of long-term metreleptin treatment in patients with lipodystrophy. Endocr Pract. 2011;17(6):922-32.
15. Kamran F, Rother KI, Cochran E, Safar Zadeh E, Gorden P, Brown RJ. Consequences of stopping and restarting leptin in an adoles-cent with lipodystrophy. Horm Res Paediatr. 2012;78:320-5. 16. Simha V, Subramanyam L, Szczepaniak L, Quittner C,
Adams-Huet B, Snell P, et al. Comparison of eficacy and safety of leptin replacement therapy in moderately and severely hypoleptinemic patients with familial partial lipodystrophy of the Dunnigan vari-ety. J Clin Endocrinol Metab. 2012;97:785-92.
17. Moher D, Liberati A, Tetzlaff J, Altman DG. Preferred reporting items for systematic reviews and meta-analyses: the PRISMA statement. PLoS Med. 2009;6:e1000097.
18. Whiting PF, Rutjes AW, Westwood ME, Mallett S, Deeks JJ, Reits-ma JB, et al. QUADAS-2: a revised tool for the quality assessment of diagnostic accuracy studies. Ann Intern Med. 2011;155:529-36. 19. Huedo-Medina TB, Sanchez-Meca J, Marin-Martinez F, Botella J.
Assessing heterogeneity in meta-analysis: Q statistic or I2 index? Psychol Methods. 2006;11:193-206.
20. Javor ED, Cochran EK, Musso C, Young JR, Depaoli AM, Gorden P. Long-term eficacy of leptin replacement in patients with general-ized lipodystrophy. Diabetes. 2005;54:1994-2002.
21. Oral EA, Ruiz E, Andewelt A, Sebring N, Wagner AJ, Depaoli AM, et al. Effect of leptin replacement on pituitary hormone regulation in patients with severe lipodystrophy. J Clin Endocrinol Metab. 2002;87(7):3110-7.
22. Beltrand J, Beregszaszi M, Chevenne D, Sebag G, De Kerdanet M, Huet F, et al. Metabolic correction induced by leptin replacement treatment in young children with BerardinelSeip congenital li-poatrophy. Pediatrics. 2007;120:e291-6.
23. Beltrand J, Lahlou N, Le Charpentier T, Sebag G, Leka S, Polak M, et al. Resistance to leptin-replacement therapy in Berardinelli-Seip congenital lipodystrophy: an immunological origin. Eur J Endocrinol. 2010;162:1083-91.
24. Chong AY, Lupsa BC, Cochran EK, Gorden P. Eficacy of leptin ther-apy in the different forms of human lipodystrophy. Diabetologia. 2010;53:27-35.
25. Ebihara K, Kusakabe T, Hirata M, Masuzaki H, Miyanaga F, Ko-bayashi N, et al. Eficacy and safety of leptin-replacement therapy and possible mechanisms of leptin actions in patients with gener-alized lipodystrophy. J Clin Endocrinol Metab. 2007;92:532-41. 26. Javor ED, Ghany MG, Cochran EK, Oral EA, DePaoli AM,
Prem-kumar A, et al. Leptin reverses nonalcoholic steatohepatitis in patients with severe lipodystrophy. Hepatology. 2005;41:753-60. 27. Moran SA, Patten N, Young JR, Cochran E, Sebring N, Reynolds
J, et al. Changes in body composition in patients with severe lipodystrophy after leptin replacement therapy. Metabolism. 2004;53:513-9.
28. Oral EA, Simha V, Ruiz E, Andewelt A, Premkumar A, Snell P, et al. Leptin-replacement therapy for lipodystrophy. N Engl J Med. 2002;346:570-8.
29. Park JY, Javor ED, Cochran EK, DePaoli AM, Gorden P. Long-term eficacy of leptin replacement in patients with Dunnigan-type fa-milial partial lipodystrophy. Metabolism. 2007;56:508-16. 30. Petersen KF, Oral EA, Dufour S, Befroy D, Ariyan C, Yu C, et al.
Leptin reverses insulin resistance and hepatic steatosis in pa-tients with severe lipodystrophy. J Clin Invest. 2002;109:1345-50. 31. Safar Zadeh E, Lungu AO, Cochran EK, Brown RJ, Ghany MG,
Heller T, et al. The liver diseases of lipodystrophy: the long-term effect of leptin treatment. J Hepatol. 2013;59:131-7.
32. Boguszewski CL, Paz-Filho G, Velloso LA. Neuroendocrine body weight regulation: integration between fat tissue, gastrointestinal tract, and the brain. Endokrynol Pol. 2010;61(2):194-206. 33. Mantzoros CS, Magkos F, Brinkoetter M, Sienkiewicz E, Dardeno
TA, Kim SY, et al. Leptin in human physiology and pathophysiol-ogy. Am J Physiol Endocrinol Metab. 2011;301:E567-84. 34. Paz-Filho G, Wong ML, Licinio J. Ten years of leptin replacement
therapy. Obes Rev. 2011;12:e315-23.
35. Moon HS, Dalamaga M, Kim SY, Polyzos SA, Hamnvik OP, Mag-kos F, et al. Leptin’s role in lipodystrophic and nonlipodystro-phic insulin-resistant and diabetic individuals. Endocr Rev. 2013;34:377-412.
36. von Schnurbein J, Heni M, Moss A, Nagel SA, Machann J, Muehleder H, et al. Rapid improvement of hepatic steatosis after initiation of leptin substitution in a leptin-deicient girl. Horm Res Paediatr. 2013;79:310-7.
37. Paz-Filho G, Mastronardi CA, Parker BJ, Khan A, Inserra A, Mat-thaei KI, et al. Molecular pathways involved in the improve-ment of nonalcoholic fatty liver disease. J Mol Endocrinol. 2013;51:167-79.
38. Casey SP, Lokan J, Testro A, Farquharson S, Connelly A, Proietto J, et al. Post-liver transplant leptin results in resolution of severe recurrence of lipodystrophy-associated nonalcoholic steatohepa-titis. Am J Transplant. 2013;13(11):3031-4.
gov/downloads/advisorycommittees/committeesmeetingmateri-Cop
yright
© ABE&M t
odos os dir
eit
os r
eser
vados
.
als/drugs/endocrinologicandmetabolicdrugsadvisorycommittee/ ucm377929.pdf.
40. Chou SH, Chamberland JP, Liu X, Matarese G, Gao C, Stefana-kis R, et al. Leptin is an effective treatment for hypothalamic amenorrhea. Proc Natl Acad Sci U S A. 2011;108(16):6585-90.