Cop
yright
© ABE&M t
odos os dir
eit
os r
eser
vados
.
Epicardial adipose tissue thickness
and its association with adiponectin
in metabolic syndrome patients
from Mérida, Venezuela
Associação entre a espessura do tecido adiposo epicárdico e a adiponectina em pacientes com síndrome metabólica em Mérida, Venezuela
Marcos M. Lima-Martínez1, Gabriel López-Mendez2,
Rodolfo Odreman2, José H. Donis2, Mariela Paoli3
ABSTRACT
Objective: To study the relationship between epicardial adipose tissue (EAT) thickness and plas-ma levels of adiponectin in Venezuelan patients. Subjects and methods: Thirty-one patients diagnosed with metabolic syndrome (study group) and 27 controls were selected and tested for glycemia, lipids, and adiponectin. EAT thickness, ejection fraction, diastolic function, left ventricular mass (LVM), and left atrial volume (LAV) were determined by transthoracic echocar-diography. Results: EAT thickness was greater in metabolic syndrome patients (5.69 ± 1.12 vs. 3.52 ± 0.80 mm; p = 0.0001), correlating positively with body mass index (BMI) (r = 0.661; p = 0.0001); waist circumference (WC) (r = 0.664; p = 0.0001); systolic (SBP) (r = 0.607; p = 0.0001), and diastolic blood pressure (DBP) (r = 0.447; p = 0.0001); insulin (r = 0.505; p = 0.0001); Tg/HDL-C ratio (r = 0.447; p = 0.0001), non-HDL-C (r = 0.353; p = 0.007); LAV (r = 0.432; p = 0.001), and LVM (r = 0.469; p = 0.0001). EAT thickness correlated negatively with adiponectin (r = -0.499; p = 0.0001). Conclusion: A signiicant association exists between EAT thickness and both metabolic syndrome components and adiponectin concentration, a link that might be used as a biomarker for this disease. Arq Bras Endocrinol Metab. 2014;58(4):352-61
Keywords
Epicardial adipose tissue; epicardial fat; metabolic syndrome; adiponectin; Hispanics
RESUMO
Objetivo: Estudar a relação entre a espessura do tecido adiposo epicárdico (TAE) e os níveis plasmáticos de adiponectina em pacientes venezuelanos. Sujeitos e métodos: Foram sele-cionados 31 pacientes com diagnóstico de síndrome metabólica (SM) (grupo de estudo) e 27 controles. Foram medidos a glicose, os lipídios e a adiponectina. Foram determinados a es-pessura do TAE, a fração de ejeção, a função diastólica, a massa ventricular esquerda (MVE) e o volume atrial esquerdo (VAI) pela ecocardiograia transtorácica. Resultados: A espessura do TAE foi maior em pacientes com SM (5,69 ± 1,12 contra 3,52 ± 0,80 mm; p = 0,0001) com uma correlação positiva com o índice de massa corporal (IMC) (r = 0,661; p = 0,0001), circunferência da cintura (CC) (r = 0,664; p = 0,0001), pressão arterial sistólica (PAS) (r = 0,607; p = 0,0001), diastólica (PAD) (r = 0,447; p = 0,0001), insulina (r = 0,505; p = 0,0001), com a relação TG/HDL-C (r = 0,447; p = 0,0001), com o colesterol HDL (r = 0,353; p = 0,007), VAI (r = 0,432; p = 0,001) e MVI (r = 0,469; p = 0,0001). A espessura do TAE se correlacionou negativamente com a adiponectina (r = -0,499; p = 0,0001). Conclusão: Existe uma relação signiicativa entre a espessura do TAE, os componentes do SM e a concentração plasmática de adiponectina, o que poderia ser utilizado como um biomarcador para essa doença. Arq Bras Endocrinol Metab. 2014;58(4):352-61
Descritores
Tecido adiposo epicárdico; gordura epicárdica; síndrome metabólica; adiponectina; hispânicos
1 Division of Medical Physiology,
Department of Physiological Sciences, University of Oriente, Ciudad Bolívar, Venezuela
2 Cardiology Research Institute,
University Hospital of Los Andes, Mérida, Venezuela
3 Endocrinology Unit,
University Hospital of Los Andes, Mérida, Venezuela
Correspondence to:
Marcos M. Lima-Martínez Avenida Tachira,
Conjunto Residencial Monacaya, Town House 12
Ciudad Bolívar, Estado Bolívar, Venezuela [email protected]
Received on Jul/16/2013 Accepted on Jan/24/2014
Cop
yright
© ABE&M t
odos os dir
eit
os r
eser
vados
.
INTRODUCTION
T
he recognition of the adipocyte as a highly com-plex endocrine organ, capable of secreting a se-ries of bioactive molecules, collectively known as adi-pocytokines, has triggered great interest in the adipose tissue, and particularly visceral adiposity (1). Increase in visceral adiposity is associated with high cardiometabo-lic risk, a characteristic that deines the metabocardiometabo-lic syn-drome. Despite the current focus on intra-abdominal visceral adiposity, some extra-abdominal fat deposits, such as epicardial fat, are now acknowledged as markers of cardiovascular risk (2).Epicardial adipose tissue (EAT) or epicardial fat de-velops from brown adipose tissue during embryogen-esis. At adult age, it tends to settle between the atrio-ventricular or interatrio-ventricular grooves, extending to the apex (3). It has been proposed that this tissue could act as a physiolgical buffer that protects the heart against cardiolipotoxicity generated by free fatty acids (3). Adequately functioning epicardial adipocytes can secrete a number of adipocytokines, one of which is adiponec-tin, a 247-amino acid peptide with insulin-sensitizing, anti-atherogenic, and anti-inlammatory properties that offers multiple beneits in diseases such as atherosclero-sis, ischemic cardiopathy, and arterial hypertension (4). It is well known that high-sensitivity C-reactive protein (hs-CRP) is a risk marker for coronary artery disease, and during the last decade, Ouchi and cols. (5) have described a strong negative association between adipo-nectin and hs-CRP, both in plasma and in the adipose tissue of patients with atherosclerotic coronary disease.
Some authors have found metabolic syndrome patients to have a thicker layer of epicardial fat (6,7). Torres and cols. (8) demonstrated, in their unprece-dented Ciudad Bolivar study, in Venezuela, that among Hispanics, EAT thickness is greater in metabolic syn-drome patients than in control subjects. However, until this study, no other has established a relationship be-tween EAT thickness and plasma levels of adiponectin in Hispanic patients.
SUBJECTS AND METHODS
Design and subjects of the study
An observational, analytical, cross-sectional study was designed. The selection of subjects was carried out in accordance with the International Diabetes
Federa-tion (IDF) guidelines for the diagnosis of metabolic syndrome (9). A sample of 31 (19 female, 12 male) metabolic syndrome subjects aged 20 to 60 years old, with inclusion of at least three of the following criteria: 1. Waist circumference (WC): ≥ 90 cm in men; ≥ 80 cm in women; 2. Triglyceride plasma levels: ≥ 150 mg/dL; 3. HDL-C: < 40 mg/dL in men; < 50 mg/dL in wom-en; 4. Systolic blood pressure (SBP): ≥ 130 mmHg and/or diastolic blood pressure (DBP) ≥ 85 mmHg; 5. Fasting blood glucose: ≥ 100 mg/dL.
These subjects were compared with 27 age- and sex-matched controls without metabolic syndrome. According to the Helsinki Declaration, all subjects gave informed consent to participate in the study. The study did not include subjects with primary hyperlipidemia; endocrinopathies, such as diabetes mellitus,
hypothy-roidism, Cushing syndrome, or acromegaly; or any other comorbidity or drug (glucocorticoids, anticon-vulsants, or hypolipidemic agents) that would be able to affect metabolic variables.
Clinical evaluation
A brief medical history was taken to gather demogra-phic data, such as age, sex, and associated personal and family background. Weight and height were measured with subjects wearing only their underwear. BMI was calculated as weight in kilograms divided by height in meters squared. Waist circumference (WC) was mea-sured midway between the underside of the lowest rib and the iliac crests, in centimeters, with subjects stand-ing. Blood pressure was taken using the auscultation method with a conventional mercury sphygmomanom-eter on the right arm.
Biochemical variables
A blood sample was taken from the antecubital vein after subjects had fasted for no less than eight hours. Glycemia and blood lipids (total cholesterol, triglyceri-des, and HDL-C) were analyzed in a Hitachi 911®
auto-analyzer with reagents from CienVar Laboratories, us-ing enzymatic methods.
Cop
yright
© ABE&M t
odos os dir
eit
os r
eser
vados
.
Plasma levels of adiponectin were ascertained with an ELISA kit (DRG International Inc, New Jersey, USA), using the immunoenzymatic method. hs-CRP was determined by a chemoluminescence immunoassay using commercial kits from Siemens Healthcare Diag-nostics, California, USA.
Echocardiograic variables
Standard transthoracic two-dimensional echocardiog-raphy was performed with a Vivid 7 Dimension Ultra-sound scanner (GE Healthcare, Wisconsin, USA) with patients in left lateral recumbent position. Echocardio-grams were interpreted by a cardiologist-echocardiogra-pher in order to guarantee the validity of the studies. The echocardiographer was blind to the condition of the subjects.
Echocardiographically, EAT was observed as the echolucent space between the outer wall of the myo-cardium and the visceral perimyo-cardium. This thickness was measured perpendicularly on the free wall of the right ventricle at end-systole in three cardiac cycles, using both long and short-axis parasternal views (10).
Left ventricular mass (LVM) was determined simi-larly in the parasternal long-axis view, using the ana-tomically validated formula of Devereux and cols. (11), and subsequently indexed to the patient’s body surface area (BSA). Left atrial volume (LAV) was measured u sing both apical two- and four-chamber echo views, subsequently averaged to the patient’s BSA.
The left ventricle diastolic function (LVDF) was determined using transmitral low and tissue Doppler echocardiography. The left ventricle ejection fraction (LVEF) was obtained by subtracting the end systolic volume from the end diastolic volume, and dividing the result by the end diastolic volume (x 100).
Statistical analysis
All continuous variables are presented as means ± stan-dard deviations, and categorical variables, as numbers and percentages. The chi-square test was used to deter-mine any signiicant sex-related differences between the groups. Student’s t-test for independent data assessed the mean difference of normally-distributed continuous variables between subjects with and without metabolic syndrome, while Mann-Whitney U test was used for non-normally distributed variables (SBP, DBP, insulin, hs-CRP, and LVEF). To measure variable dependency in metabolic syndrome, and to determine which
vari-able was the most inluential, Pearson or Spearman cor-relation, according the distribution of the variable, and both uni- and multi-variate linear regression analyses were conducted using EAT as the dependent variable. In addition, uni- and multivariate logistic regression analyses with metabolic syndrome as the dependent vari-able were done in order to determine the varivari-able that best deined the disorder. Finally, univariate and multi-variate linear regression analyses were undertaken with SBP, Tg/HDL-C ratio, non-HDL-C, and adiponectin plasma concentrations as dependent variables, and body mass index and EAT thickness as independent variables to determine if epicardial fat was related to these meta-bolic variables independent of the degree of obesity. SPSS 15.0 for Windows was used in the statistical analy-sis, with p value ≤ 0.05 considered statistically signiicant.
RESULTS
Table 1 presents the anthropometric and clinical data of the participants. The control group comprised 27 subjects – 19 females and 8 males – with an average age of 38.67 ± 9.80 years, and a mean BMI of 24.32 ± 3.48 kg/m2. The study group comprised 31 patients – 19
females and 12 males – with an average age of 39.06 ± 10.00 years, and mean BMI of 34.26 ± 6.31 kg/m2.
There were no statistically signiicant differences in age, sex, height, or pathological familial histories be-tween the two groups. Weight, BMI, WC, SBP, and DBP were signiicantly higher (p = 0.0001) in the study group, which had a greater incidence (p = 0.0001) of personal diseases – obesity, dyslipidemia, high blood pressure, and tobacco use (67.7% vs. 3.7; 48.4% vs.
11.1%; 41.9% vs. 0%; and 6.5% vs. 0%, respectively)
be-ing the most frequent. Ten of the 13 patients with a history of high blood pressure were on monotherapy (six on angiotensin-converting enzyme inhibitors, and four on angiotensin II receptor blockers) and three on combined therapy (two on angiotensin II receptor blockers and calcium blockers; and one on angiotensin-converting enzyme inhibitor plus a diuretic).
Cop
yright
© ABE&M t
odos os dir
eit
os r
eser
vados
.
group. No statistically signiicant differences between the groups were observed in the plasma concentrations of total cholesterol (p = 0.051) and LDL-C (p = 0.110). Table 3 presents the echocardiographic data of the participants. The thickness of epicardial fat (p = 0.0001)
and LVM (p = 0.019), as well as LAV (p = 0.021) were signiicantly greater in the study group. No signiicant differences were observed in either LVEF (p = 0.503) or the left ventricle diastolic dysfunction (LVDD) (p = 0.068) between the groups.
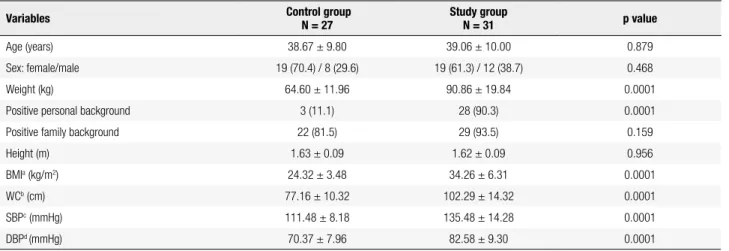
Table 1. Anthropometric and clinical data of the participants
Variables Control groupN = 27 Study groupN = 31 p value
Age (years) 38.67 ± 9.80 39.06 ± 10.00 0.879
Sex: female/male 19 (70.4) / 8 (29.6) 19 (61.3) / 12 (38.7) 0.468
Weight (kg) 64.60 ± 11.96 90.86 ± 19.84 0.0001
Positive personal background 3 (11.1) 28 (90.3) 0.0001
Positive family background 22 (81.5) 29 (93.5) 0.159
Height (m) 1.63 ± 0.09 1.62 ± 0.09 0.956
BMIa (kg/m2) 24.32 ± 3.48 34.26 ± 6.31 0.0001
WCb (cm) 77.16 ± 10.32 102.29 ± 14.32 0.0001
SBPc (mmHg) 111.48 ± 8.18 135.48 ± 14.28 0.0001
DBPd (mmHg) 70.37 ± 7.96 82.58 ± 9.30 0.0001
Continuous variables are presented as X ± SD, and the categorical variables as N (%).
a BMI: body mass index, b WC: waist circumference, c SBP: systolic blood pressure, d DBP: diastolic blood pressure.
Table 2. Biochemical variables of the participants
Variables Control groupn = 27 Study groupn = 31 p value
Glycemia (mg/dL) 90.11 ± 8.82 98.16 ± 12.03 0.005
Insulin (mU/mL) 2.10 ± 0.54 6.08 ± 5.22 0.0001
Total cholesterol (mg/dL) 172.67 ± 22.51 190.52 ± 43.29 0.051
HDL-Ca (mg/dL) 56.11 ± 10.78 46.68 ± 8.73 0.001
LDL-Cb (mg/dL) 93.68 ± 17.98 105.77 ± 36.55 0.110
Non-HDL-C (mg/dL) 116.55 ± 21.57 143.84 ± 41.07 0.002
Triglycerides (mg/dL) 112.15 ± 52.16 204.26 ± 94.43 0.0001
Tg/HDL-C ratio 2.10 ± 1.15 4.52 ± 2.37 0.0001
Adiponectin (ng/mL) 14.95 ± 3.87 11.20 ± 2.65 0.0001
hs-CRPc (mg/L) 2.20 ± 2.54 6.59 ± 6.26 0.0001
Continuous variables are presented as X ± SD.
a HDL-C: high-density lipoprotein cholesterol; b LDL-C: low-density lipoprotein cholesterol; c hs-CRP: high-sensitivity C-reactive protein.
Table 3. Echocardiographic data of the participants
Variables Control group
n = 27
Study group
n = 31 p value
Epicardial fat (mm) 3.52 ± 0.80 5.69 ± 1.12 0.0001
Left ventricular mass (g/m2) 53.01 ± 8.40 60.28 ± 14.00 0.019
Ejection fraction (%) 65.15 ± 3.17 64.55 ± 3.60 0.503
Left atrial volume (mL/m2) 19.26 ± 4.03 22.15 ± 5.19 0.021
Left ventricle diastolic dysfunction 6 (19.4) 1 (3.7) 0.068
Cop
yright
© ABE&M t
odos os dir
eit
os r
eser
vados
.
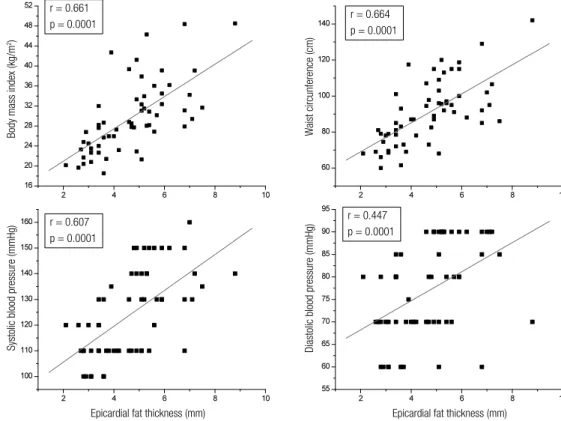
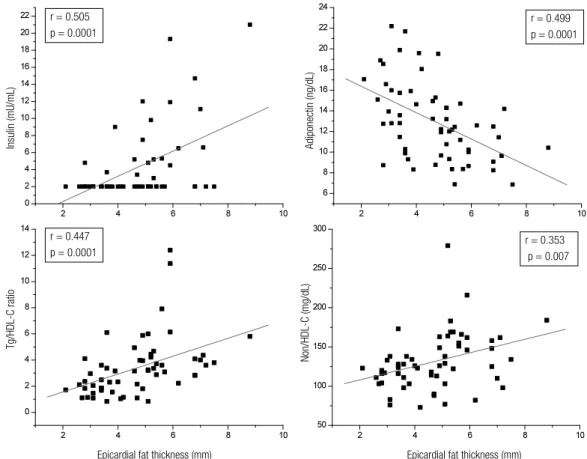
The correlation analysis revealed that epicardial fat thickness (measured in mm) showed a statistically signiicant positive correlation with BMI (r = 0.661; p = 0.0001); WC (r = 0.664; p = 0.0001), SBP (r = 0.607; p = 0.0001), and DBP (r = 0.447; p = 0.0001) (Figure 1). Also, as illustrated by Figure 2, epicardial fat thickness showed a statistically signiicant positive correlation with insulin plasma levels (r = 0.505; p = 0.0001), Tg/HDL-C ratio (r = 0.447; p = 0.0001), and non-HDL-C (r = 0.353; p = 0.007); and a statistically signiicant negative correlation with plasma concentra-tions of adiponectin (r = 0.499; p = 0.0001). There was no correlation between hs-CRP and EAT thickness. Fi gure 3 also demonstrates that EAT thickness showed a statistically signiicant correlation with both LVM (r = 0.469; p = 0.0001) and LAV (r = 0.432; p = 0.001).
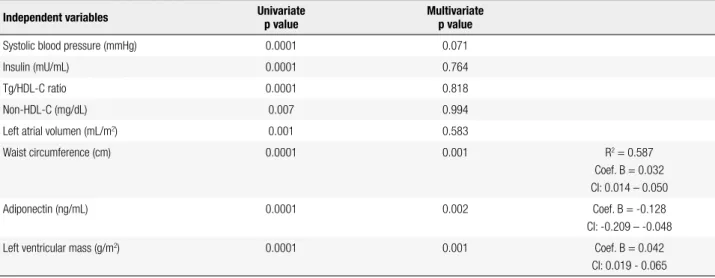
A linear regression analysis was conducted to deter-mine the variables that exerted the most inluence on EAT thickness as a dependent variable. The univariate linear regression analysis yielded signiicance for SBP, insulin, Tg/HDL-C, non-HDL-C, LAV, WC, adipo-nectin, and LVM (Table 4). The multivariate linear re-gression analysis excluded BMI and DBP because of collinearity with WC and SBP, respectively, and showed that SBP, insulin, Tg/HDL-C ratio, non-HDL-C, and
r = 0.661
p = 0.0001 r = 0.664
p = 0.0001
r = 0.607 p = 0.0001
r = 0.447
p = 0.0001
W
aist circunference (cm)
Body mass index (kg/m
2)
Systolic blood pressure (mmHg) Diastolic blood pressure (mmHg)
Epicardial fat thickness (mm) Epicardial fat thickness (mm)
LAV lost their statistical signiicance, whereas WC (p = 0.001), adiponectin plasma concentration (p = 0.002), and LVM (p = 0.001) kept theirs. All three remained as the variables that exerted the greatest effect on epicar-dial fat thickness, with R squared of 0.587.
Logistic regression analyses were conducted using the presence of metabolic syndrome as the dependent, binary variable, and epicardial fat and adiponectin as in-dependent variables in order to establish which of them best itted the metabolic syndrome model in the study. The univariate analysis found that both adiponectin and epicardial fat thickness were signiicant (p = 0.0001). The multivariate analysis revealed that adiponectin lost its statistical signiicance, whereas epicardial fat kept it (p = 0.0001), the latter remaining as the rationale for metabolic syndrome, with R squared of 0.760 and odds ratio of 10.203 (Table 5).
Univariate and multivariate regression analyses with SBP, Tg/HDL-C ratio, non-HDL-C, and adiponectin plasma concentration as dependent variables, and BMI and EAT thickness as independent ones (Table 6) were conducted in order to assess if the relation between epi-cardial fat and these variables was independent of BMI. The table shows that both BMI and epicardial fat thick-ness bear independently on SBP; however, epicardial fat
Cop
yright
© ABE&M t
odos os dir
eit
os r
eser
vados
.
Figure 3. Epicardial fat thickness correlation with left ventricular mass, and left atrial volume.
r = 0.505 p = 0.0001
r = 0.499 p = 0.0001
Insulin (mU/mL) Adiponectin (ng/dL)
Tg/HDL-C ratio
Non/HDL-C (mg/dL)
r = 0.447 p = 0.0001
r = 0.353
p = 0.007
Epicardial fat thickness (mm) Epicardial fat thickness (mm)
Figure 2. Epicardial fat thickness correlation with insulin, adiponectin, TG/HDL-C ratio, and non-HDL-C. thickness does not correlate independently with either
Tg/HDL-C ratio or non-HDL-C. It is worth noting that when the plasma concentration of adiponectin was evaluated as a dependent variable, the univariate
analy-sis yielded a signiicant inverse relation for both BMI and EAT, but BMI lost its statistical signiicance in the multivariate analysis, whereas epicardial fat thickness continued to maintain it (p = 0.025).
Epicardial fat thickness (mm)
Left ventricular mass (g/m
2)
Left atrial volume (mL/m
2) r = 0.469
p = 0.0001
Cop
yright
© ABE&M t
odos os dir
eit
os r
eser
vados
.
Table 4. Univariate and multivariate linear regression analysis with epicardial fat thickness as the dependent variable
Independent variables Univariate
p value
Multivariate p value
Systolic blood pressure (mmHg) 0.0001 0.071
Insulin (mU/mL) 0.0001 0.764
Tg/HDL-C ratio 0.0001 0.818
Non-HDL-C (mg/dL) 0.007 0.994
Left atrial volumen (mL/m2) 0.001 0.583
Waist circumference (cm) 0.0001 0.001 R2 = 0.587
Coef. B = 0.032 CI: 0.014 – 0.050
Adiponectin (ng/mL) 0.0001 0.002 Coef. B = -0.128
CI: -0.209 – -0.048
Left ventricular mass (g/m2) 0.0001 0.001 Coef. B = 0.042
CI: 0.019 - 0.065
Table 5. Logistic regression analysis using metabolic syndrome as the dependent variable, and epicardial fat thickness and adiponectin as independent variables
Independent variables Univariate
p value
Multivariate p value
Adiponectin (ng/mL) 0.0001 0.202
Epicardial fat (mm) 0.0001 0.0001 R2 = 0.760
Odds ratio = 10.203 CI: 2.971 - 35.042
Table 6. Univariate and multivariate linear regression analysis with systolic blood pressure, Tg/HDL-C ratio, non-HDL-C, and adiponectin as dependent variables, and body mass index, and epicardial fat thickness as independent variables
Univariate p value
Multivariate p value
Variable dependent: Systolic blood pressure
Independent variables:
Body mass index (kg/m2) 0.0001 0.007 (IC: 0.256-1.511)
R2 = 0.448
Coef. B: 0.884
Epicardial fat thickness (mm) 0.0001 0.010 (IC: 1.044-7.181) Coef. B: 4.113
Variable dependent: Tg/HDL-C ratio
Independent variables:
Body mass index (kg/m2) 0.001 0.107 (IC: -0.018-0.179)
R2: 0.237
Coef. B: 0.080
Epicardial fat thickness (mm) 0.0001 0.082 (IC: -0.056-0.905) Coef. B: 0.425
Variable dependent: Non-HDL-C
Independent variables:
Body mass index (kg/m2) 0.012 0.318 (IC: -0.831-2.509)
R2: 0.140
Coef. B: 0.839
Epicardial fat thickness (mm) 0.007 0.152 (IC: -2.250-14.075) Coef. B: 5.913
Variable dependent: Adiponectin
Independent variables:
Body mass index (kg/m2) 0.0001 0.151 (IC: -0.277-0.044)
R2: 0.277
Coef. B: -0.116
Cop
yright
© ABE&M t
odos os dir
eit
os r
eser
vados
.
DISCUSSION
Our results correspond to those of other studies, which show echocardiographically-measured EAT values linked to anthropometric and clinical metabolic syn-drome components (6,8). In fact, some EAT thickness values were found to have a greater signiicance in the metabolic syndrome group than in the control group (5.69 ± 1.12 vs. 3.52 ± 0.80; p = 0.0001) as well as a
signiicant correlation with BMI and WC, suggestive of obesity as a predisposing factor for epicardial fat. In fact, a recent meta-analysis evaluating the relationship between epicardial fat, indices of obesity and metabolic syndrome demonstrated that EAT thickness signii-cantly correlated independently with each of the com-ponents of metabolic syndrome (SBP, HDL-C, fasting glucose), but the magnitude of this relationship was considerably and signiicantly lower than that between epicardial fat and BMI (12).
This study showed that EAT thickness exerts an inluence on systolic blood pressure independently of BMI. This inding might be explained in terms of the physiopathological mechanism of insulin resistance. It has been reported, in animal models, that the release rate of fatty acids by the epicardial adipocyte is twice that of perirenal fat. This suggests a high lipolytic ac-tivity due, perhaps, to both the reduced antilipolytic effect of insulin on this tissue and the increased expres-sion of β-adrenergic receptors, especially β-3 recep-tors. The β-3 receptors stimulation activates lipolysis and increases the release of free fatty acids capable of promoting arterial hypertension by means of differ-ent pathways, such as adrenergic stimulation, increase in oxidative stress, endothelial dysfunction, or vascular cell growth (13,14). This theory is supported in our study by the signiicant correlation between epicardial fat thickness and insulin plasma concentration in the individuals studied. Furthermore, the epicardial adi-pocyte produces angiotensinogen, which is converted into angiotensin I and subsequently into angiotensin II, a potent vasoconstrictor and hydro-saline retention promoter (15). Interestingly, Dicker and cols. (16) demonstrated, in a sample of 127 non-obese subjects, that EAT thickness ≥ 2.4 mm is associated with an in-creased risk of high blood pressure (odds ratio 1.39; 95% CI: 1.033-1.992).
The Tg/HDL-C ratio, frequently elevated in meta-bolic syndrome patients, is linked to a predominance of small and dense lipoprotein particles (β LDL) that
result from insulin resistance, high triglyceride concen-tration, and low levels of HDL-C. This is the reason why this index has been proposed as a useful instru-ment to predict endothelial dysfunction and adverse cardiovascular events, especially in patients with a Tg/ HDL-C ratio ≥ 3.5 (17). In our study, the Tg/HDL-C ratio showed elevated values in the metabolic syndrome group (4.52 ± 2.37 vs. 2.10 ± 1.15; p = 0.0001) and
a positive correlation with epicardial fat (r = 0.447; p = 0.0001). Aydin and cols. (7) found EAT thickness to be an independent factor exerting an effect on the endo thelial function of metabolic syndrome patients. Our study, however, evinced no independent relation-ship between EAT thickness and Tg/HDL-C ratio.
Several studies have established the clinical impor-tance of Non-HDL-C as a predictor of coronary ar-tery disease and cardiovascular morbidity and mortality in patients with metabolic syndrome (18). This study found plasma concentrations of non-HDL-C signii-cantly higher than those of the control group (143.84 ± 41.07 vs. 116.55 ± 21.57; p = 0.002), and a signiicant
correlation between EAT thickness and Non-HDL-C (r = 0.353; p = 0.007). Rego and cols. (19) demon-strated a signiicant increase of the ApoB/ApoA1 ratio in subjects with an EAT thickness ≥ 5.2 mm compared with subjects with thickness < 5.2 mm (50.9 vs. 23.1%;
p = 0.002). Nonetheless, similar to the Tg/HDL-C ra-tio, our study did not evince any independent relation-ship between EAT thickness and Non-HDL-C.
As for the hs-CRP, signiicantly higher concentra-tions (6.59 ± 6.26 vs. 2.20 ± 2.54; p = 0.0001) were
observed in the MS group. This study did not ind a correlation between hs-CRP and epicardial fat thick-ness (r = 0.252; p = 0.056), akin to values reported in a previous study (6); on the contrary, Aydin and cols. (7) showed a strong correlation between these variables (r = 0.62; p < 0.0001) in MS patients. The reason for these differences might involve the fact that the subject group studied by Aydin and cols. was older (52.00 ± 7.00 years) compared with the control and metabolic subjects assessed in our study (38.67 ± 9.80 and 39.06 ± 10.00 years old, respectively), which affects the de-gree of vascular dysfunction and possibly the relation-ship between the variables.
Cop
yright
© ABE&M t
odos os dir
eit
os r
eser
vados
.
left ventricle, an increase in EAT might mechanically affect the diastolic illing of the latter, and thus induce left atrial distension, a potential risk factor for atrial i-brillation (20,21).
The strong correlation between LVM and EAT thickness has been characterized by other authors (8,22,23). Several mechanisms might explain this re-lationship: a) EAT augmentation is associated with hi gher intramyocardial lipid content, and hence, with myocardial steatosis and lipotoxicity, which might duce adverse structural and functional adaptations, in-cluding cardiomyopathy (24); b) EAT may affect car-diac morphology by means of the effect, both local and systemic, of the adipocytokines it synthesizes, as some of them are capable of inducing cardiac remodeling (25); c) EAT could induce systemic insulin resistance, which in turn can promote left ventricular hyperthro-phy via direct mitogenic action of insulin post-receptor pathway in myocardial cells (2,26).
Our study found an inversely proportional relation-ship between EAT thickness and adiponectin plasma concentration, independent of BMI. Bambace and cols. (27) demonstrated that the increase in diameter of the epicardial adipocyte is associated with a decreased EAT adiponectin expression in subjects with metabolic syn-drome compared with subjects without it. Interesting-ly, intracoronary adiponectin levels relect the systemic concentration of this hormone, and EAT contributes, in part, to such plasma levels (28). Indeed, reduced EAT adiponectin expression in patients with ischemic cardiopathy, coupled with a signiicant inverse associa-tion between epicardial adiponectin expression and the extent of coronary disease, suggests that a lower pro-duction of epicardial fat adiponectin might play a rel-evant role in the development and severity of coronary artery disease (29,30).
Furthermore, the logistic regression analysis with metabolic syndrome as a dependent variable showed that EAT thickness, rather than adiponectin, correlated better with it, a correlation that underscores the strong association between the echocardiographic evaluation of this tissue and the clinical and anthropometric com-ponents of this syndrome. Moreover, a meta-analysis using 2,027 subjects (1,030 affected) revealed that EAT mass of these patients is signiicantly thicker than that of controls (standardized difference in means 1.15, 95% CI: 0.78 – 1.53; p = 0.0001) (31). It is worth not-ing that while this difference is independent of both the criteria used to deine metabolic syndrome and the cardiac cycle time period when EAT was measured
(end-systole or end-diastole), it does vary according to ethnicity (31). In fact, this study shows that the great-est difference in EAT thickness between subjects with metabolic syndrome and those without it is observed among Caucasians, followed by Hispanics, Turks, and Asians (31). It is not clear if these differences result from racial variations in the amount of visceral adipose tissue, as has been reported in some ethnic groups (32). In our experience, signiicant differences have been ob-served in Venezuela. EAT thickness reported in the city of Ciudad Bolívar (8) was signiicantly greater than that found during the course of this study in Mérida, which leads us to hypothesize that sociocultural, climatic, and dietary factors exert an inluence on EAT thickness and its relationship with metabolic syndrome.
CONCLUSION
A thicker epicardial adipose tissue was conirmed in metabolic syndrome patients when compared with con-trol subjects, as well as a direct relationship between EAT and WC, blood pressure, Tg/HDL-C ratio, and plasma insulin levels. A signiicant inverse correlation between EAT thickness and adiponectin plasma con-centration was also observed, a link which might be useful as a biomarker for this disease.
Acknowledgments: We would like to thank Professor Carlos Mota, Dr. Gianluca Iacobellis, and Dr. Joselyn Rojas for their su-pport and their valuable comments on the manuscript. This study was supported by a grant from the Consejo de Desarrollo Cien-tíico, Humanístico, Tecnológico y del Arte de la Universidad de Los Andes, Mérida, Venezuela, code ADG M-10.
Disclosure: no potential conlict of interest relevant to this article was reported.
REFERENCES
1. Kershaw EE, Flier J. Adipose tissue as an endocrine organ. J Clin Endocrinol Metab. 2004;89(6):2548-56.
2. Lima-Martínez MM, Blandenier C, Iacobellis G. Epicardial adi-pose tissue: more than a simple fat deposit?. Endocrinol Nutr. 2013;60(6):320-8.
3. Iacobellis G, Corradi D, Sharma AM. Epicardial adipose tissue: anatomical, biomolecular and clinical relation to the heart. Nat Cardiovasc Clin Pract Med. 2005;2(10):536-43.
4. Chandran M, Phillips SA, Ciaraldi T, Henry RR. Adiponec-tin: more than just another fat cell hormone?. Diabetes Care. 2003;26(8):2442-50.
Cop
yright
© ABE&M t
odos os dir
eit
os r
eser
vados
.
6. Iacobellis G, Ribaudo MC, Assael F, Vecci E, Tiberti C, Zappaterre-no A, et al. Echocardiographic epicardial adipose tissue is related to anthropometric and clinical parameters of metabolic syndro-me: a new indicator of cardiovascular risk. J Clin Endocrinol Me-tab. 2003;88(11):5163-8.
7. Aydin H, Toprak A, Deyneli O, Yacizi D, Tarçin O, Sancak S, et al. Epicardial fat tissue thickness correlates with endothelial dys-function and other cardiovascular risk factors in patients with metabolic syndrome. Metab Syndr Relat Disord. 2010;8(3):229-34. 8. Torres C, Lima-Martínez MM, Rosa FJ, Guerra E, Paoli M, Iaco-bellis G, et al. Epicardial adipose tissue and its association to plasma adrenomedullin levels in patients with metabolic syndro-me. Endocrinol Nutr. 2011;58(8):401-8.
9. Alberti KG, Eckel RH, Grundy SM, Zimmet PZ, Cleeman JI, Donato KA, et al. Harmonizing the metabolic syndrome: a Joint Interim Statement of the International Diabetes Federation Task Force on Epidemiology and Prevention; National Heart, Lung, and Blood Institute; American Heart Association; World Heart Federation; In-ternational Atherosclerosis Society; and InIn-ternational Association for the Study of Obesity. Circulation. 2009;120(16):1640-5. 10. Iacobellis G, Willens HJ. Echocardiographic epicardial fat: a
re-view of research and clinical applications. J Am Soc Echocardiogr. 2009;22(12):1311-9.
11. Devereux RB, Alonso DR, Lutas EM, Gottlieb GJ, Campo E, Sa-chs I, et al. Echocardiographic assessment of left ventricular hypertrophy: comparison to necropsy indings. Am J Cardiol. 1986;57(6):450-8.
12. Rabkin SW. The relationship between epicardial fat and indices of obesity and the metabolic syndrome: a systematic review and meta-analysis. Metab Syndr Relat Disord. 2014;12(1):31-42. 13. Marchington JM, Pond CM. Site-speciic properties of pericardial
and epicardial adipose tissue: the effects of insulin and high-fat feeding on lipogenesis and the incorporation of fatty acids in vi-tro. Int J Obesity. 1990;14(12):1013-22.
14. Zhou J, Qin G. Adipocyte dysfunction and hypertension. Am J Cardiovasc Dis. 2012;2(2):143-9.
15. Roubícek T, Dolinková M, Bláha J, Haluzíková D, Bosanská L, Mráz M, et al. Increased angiotensinogen production in epicardial adi-pose tissue during cardiac surgery: possible role in a postopera-tive insulin resistance. Physiol Res. 2008;57(6):911-7.
16. Dicker D, Atar E, Kornowski R, Bachar GN. Increased epicardial adipose tissue thickness as a predictor for hypertension: a cross--sectional observational study. J Clin Hypertens (Greenwich). 2013;15(12):893-8.
17. Cordero A, Andrés E, Ordoñez B, León M, Laclaustra M, Grima A, et al. Usefulness of triglycerides-to-high-density lipoprotein cho-lesterol ratio for predicting the irst coronary event in men. Am J Cardiol. 2009;104(10):1393-7.
18. Contreras F, Lares M, Castro J, Velasco M, Rojas J, Guerra X, et al. Determination of non-HDL cholesterol in diabetic and hypertensi-ve patients. Am J Ther. 2010;17(3):337-40.
19. Rego JO, Iacobellis G, Sarmientos JC, Mustelier JV, Aquiles EW, Rodríguez VM, et al. Epicardial fat thickness correlates with ApoB/
ApoA1 ratio, coronary calcium and carotid intima media thick-ness in asymptomatic subjects. Int J Cardiol. 2011;151(2):234-6. 20. Iacobellis G, Leonetti F, Singh N, Sharma AM. Relationship of
epi-cardial adipose tissue with atrial dimensions and diastolic func-tion in morbidly obese subjects. Int J Cardiol. 2007;115(2):272-3. 21. Iacobellis G. Is obesity a risk factor for atrial ibrillation?. Nat
Car-diovasc Clin Pract Med. 2005;2(3):134-5.
22. Corradi D, Maestri R, Callegari S, Pastori P, Goldoni M, Luong TV, et al. The ventricular epicardial fat is related to the myocardial mass in normal, ischemic and hypertrophic hearts. Cardiovasc Pathol. 2004;13(6):313-6.
23. Iacobellis G, Ribaudo MC, Zappaterreno A, Iannucci CV, Leonetti F. Relation between epicardial adipose tissue and left ventricular mass. Am J Cardiol. 2004;94(8):1084-7.
24. Kankaanpaa M, Lehto HR, Parkka JP, Komu M, Viljanen A, Fer-rannini E, et al. Myocardial triglyceride content and epicardial fat mass in human obesity: relationship to left ventricular func-tion and serum free fatty acid levels. J Clin Endocrinol Metab. 2006;91(11):4689-95.
25. Iacobellis G, Bianco AC. Epicardial adipose tissue: emerging phy-siological, pathophysiological and clinical features. Trends Endo-crinol Metab. 2011;22(11):450-7.
26. Lima-Martínez MM, Aguirre M, Rojas J, Paoli M, Iacobellis G. Car-diac adiposity: epicardial and pericardial fat, atherosclerosis, in-sulin resistance, and other partners in crime. In: Lopez Garcia CM, Perez Gonzalez PA, editors. Handbook on metabolic syndrome: classiication, risk factors and health impact. 1st ed. New York: Nova Science Publishers; 2012. p. 145-67.
27. Bambace C, Telesca M, Zoico E, Sepe A, Olioso D, Rossi A, et al. Adiponectin gene expression and adipocyte diameter: a compari-son between epicardial and subcutaneous adipose tissue in men. Cardiovasc Pathol. 2011;20(5):e153-6.
28. Iacobellis G, di Gioia CR, Cotesta D, Petramala L, Travaglini C, De Santis V, et al. Epicardial adipose tissue adiponectin expression is related to intracoronary adiponectin levels. Horm Metab Res. 2009;41(3):227-31.
29. Eiras S, Teijeira-Fernández E, Shamagian LG, Fernández AL, Va-zquez-Boquete A, Gonzalez-Juanatey JR. Extension of coronary artery disease is associated with increased IL-6 and decreased adiponectin gene expression in epicardial adipose tissue. Cytoki-ne. 2008;43(2):174-80.
30. Teijeira-Fernández E, Eiras S, Salgado Somoza A, Gonzalez-Jua-natey JR. Baseline epicardial adipose tissue adiponectin levels predict cardiovascular outcomes: a long-term follow-up study. Cytokine. 2012;60(3):674-80.
31. Pierdomenico SD, Pierdomenico AM, Cuccurullo F, Iacobellis G. Metaanalysis of the relation of echocardiographic epicardial adi-pose tissue thickness and the metabolic syndrome. Am J Cardiol. 2013;111(1):73-8.