Follow the Leaders:
Competition in the Brazilian
Auto Financing Sector
Rodrigo M. S. Moita
Professor - Insper Instituto de Ensino e Pesquisa Endereço: Rua Quatá, 300 - São Paulo/SP - Brazil CEP: 04546-042 - E-mail: [email protected]
Daniel B. M. Silva
Mestrando - Insper Instituto de Ensino e Pesquisa
Endereço: Endereço: Rua Quatá, 300 - São Paulo/SP - Brazil CEP: 04546-042 - E-mail: [email protected]
Recebido em 24 de outubro de 2013. Aceito em 07 de maio de 2014.
Abstract
This study seeks to understand the competitive pattern and strategy of the firms in the Brazilian automobile financing market. First, we analyzed the strong segmentation observed in this market, determining market niches. We then estimated reaction func-tions to price changes. The results indicated that the three largest companies in the sector have a strong influence on interest rate setting within the entire segment. This phenomenon characterizes the competition of this sector as the leader-follower type, rather than Bertrand competition, the latter of which is often expected in the banking sector and it demonstrates the existence of the leading firms’ market power.
Keywords
reaction functions, auto financing, leader-follower game, market power
Resumo
Este estudo busca compreender o padrão competitivo e estratégia das empresas no mercado de financiamento de automóveis brasileiro. Primeiramente, analisamos a forte segmentação observada neste mercado, determinando nichos de mercado. Em seguida, estimamos funções de reação às mudanças de preços dos concorrentes. Os resultados indicam que as três maiores empresas do setor têm uma forte influência sobre a definição da taxa de juros dentro de todo o segmento. Esse fenômeno caracteriza a competição do setor como do tipo líder-seguidor, ao invés de competição a la Bertrand, o último dos quais é frequentemente esperado no setor bancário e demonstra a existência de poder de mercado das empresas líderes.
Palavras-Chave
funções de reação, financiamento de automóveis, competição líder-seguidor, poder de mercado
JEL Classiication
1. Introduction
Credit markets are important for many of reasons. At a macro level, it channels savings to consumption and investment. At a micro level, it relaxes personal financial constraints and finances the investment of firms. They are also very important to the proper functioning of some markets, such as real state, automobiles etc. It is straightfor-ward to claim that the efficiency of the credit markets affects the efficiency of other sectors in the economy, if not the economy as a whole. Market failures, such as the exercise of market power or missing markets, can be very detrimental to efficiency and welfare.
At the same time, banking systems of many countries are characteri-zed by being concentrated. For example, using a list of 25 countries
of the European Union, Allen et al. (2006) find that the average
share of the five largest credit institutions in terms of total assets is 59%, with countries such as Belgium, Netherlands and Finland being well over 80%.
Although concentration does not mean market power, economic theory usually predicts a positive relationship between the two concepts. Concentration in the banking system may lead to market power, and be a source of concerns to antitrust authorities. The Brazilian banking system is characterized as a large and concentra-ted market, and has been the subject of much debate about market power exercise by the leading banks.
This paper analyzes competition and market power in the Brazilian
automobile financing loan market. We use average weekly loan rates
per institution to analyze the loan market. The study is divided in
two parts. First, we performed a descriptive data and market analy-sis. We showed that it is possible to observe groups of firms with similar market positions and thus identify market niches. Second, once we define the market segmentation, we derive and estimate price reaction functions for the firms in each market niche (intra-niche) and between different niches.
rates in serving customers with high credit risk. Automakers are fi-nancial institutions that are owned by the automaker companies and are characterized by lower rate offerings. Financers are firms that do not fit into any of the categories described above.
The reaction function estimates show evidence that the three largest firms – Bradesco, Itaú-Unibanco and BV Financeira – have a strong influence on interest rates within the entire market. Among the large firms, Bradesco exerts price leadership. This result has two important implications. The first is evidence of a leader-follower competitive structure within a strong market segmentation. This finding stands in sharp contrast to the Bertrand-type competition with homogeneous goods expected to be found in the banking
indus-try. A market competing a la Bertrand converges to an equilibrium
similar to that of perfect competition. It does not appear to be the case in this sector. Segmentation reduces the number of firms that are actually close competing, and the existence of leading firms may further reduce competition.
The second implication is evidence that market power exists in this sector. The results show that most financial institutions react to rate changes made by the leading banks, representing evidence of the market power of these banks. This study is not suited for the analysis of the existence of collusion in this sector. However, the results indicate that there is potential for this type of action, which justifies the need for special attention from antitrust authorities in this segment.
The Brazilian automotive market has grown 42% between 2007 and
2011.1 This growth was largely driven by a significant increase in the
credit supply for auto financing, which has grown from 19 billion dollars in 2004 to 93 billion dollars in 2010. This growth represents
an increase of over 400%.2 The strong expansion in the credit supply
occurred through a system of over 70 institutions that finance this type of credit.
1 Source: Central Bank of Brazil (Banco Central do Brasil) – www.bcb.gov.br. 2
The automotive sector is constantly targeted by economic stimulus policies from the government. This focus is at least partly due to the size of the auto industry and the high multiplier impact that the industry has in other sectors of the Brazilian economy. The success of these policies and the growth of the automotive sector largely depend on the functioning of the credit system. Therefore, the effi-ciency of this market and the competitive pattern of its firms have a central role in the success of these policies as well as in the
perfor-mance of the automotive sector as a whole.
Despite the significant number of institutions granting this type of credit line, the market is actually highly concentrated. Moreover, the competitive environment of the banking and credit sector in Brazil is constantly questioned. There are several papers that attempt to measure the degree of competition in the sector. Nakane (2002)
and Belaisch (2003), among others, have analyzed competition in
the banking credit sector.3 In addition, high banking spreads have
recently been strongly questioned by the federal government. The finding that drops in the basic interest rate (SELIC) do not translate to drops in the interest rates charged by the banks has also drawn questioning.
In this context of questioning of the competition level of the Brazilian credit market, the present study attempts to analyze the pattern of competition in the segment of car purchase loans.
We note that none of the studies about market power in the Brazilian banking system use reaction-function to identify mar-ket power. In fact, few studies apply this methodology, with Liang (1989) being the only exception we are aware of. Liang uses reaction function to recover a conjectural variation parameter. We take a different approach: we estimate the reaction-functions and analyze the firm’s behavior based influence one firm’s strategy has on the other firms.
This study is divided into six parts. The next section provides a brief review of the literature, focusing on models of price competition, bank competition and reaction function models. Next is the data analysis, which features an exploration of the Brazilian banking mar-ket and a preliminary analysis of the interest rates charged by banks
in auto financing. In the following section, a proposal is developed to formulate reactions to competitors. Following a deeper data analy-sis, a market segmentation is suggested, and the reactions to pricing variations in each segment are discussed. The sixth and last section concludes the paper.
2. Literature
There is a large literature that analyzes market power in the ban-king system. Claessens and Laeven (2004) measure market power in 50 countries’ banking systems. Their main finding is that banking system concentration does not explain market power. On the other hand, the threat of entry and market contestability improves market competition.
Allen et al. (2006) analyze the financial system of 25 countries of
the EU. They find substantial concentration, with higher concentra-tion among non-OECD countries.
A study by Osawa (2008) analyzes the behavior of several customers when financing a vehicle. The study assumes that consumers do not care about the interest rates charged as long as the installment amount fits into the family budget. If the premise is validated, pro-duct pricing (interest rate) will be less important than the financing term (which, when lengthened, decreases the installment amount). The study finds a demand elasticity of -0.45. Therefore, against popular belief, when seeking auto financing, customers evaluate the interest rate that is being offered to them.
Nakane (2002) tests the market power of Brazilian banks, using the methodology developed by Bresnaham (1982) and Lau (1982). He applies this methodology to the loan market. The result indicates the existence of a competitive market, with the cartel hypothesis being discarded.
Belaisch (2003) developed another study on competition in the Brazilian banking market. The author concludes that the Brazilian banking market behaves as an oligopoly, especially due to the lack of
incentive toward market efficiency. Therefore, the banking spread
(the difference between the credit-granting interest rate and the capital cost) increases, discouraging increases in lending and capi-talization. A further study conducted by Petterini and Jorge Neto (2003) concludes that the Bertrand oligopoly model is the market solution that most closely resembles the banking market in Brazil.
According to Ferreira (2005), locations with several bank branches and high economic activity have a relatively higher volume of credit and pay lower interest rates. In contrast, regions served by fewer banks, where competition is weaker, feature higher rates. Ferreira (2005) also finds that regions where the demand is lower do not in-volve a large number of banks, as the potential profits are not enough to cover the costs. In this competitive market, profit evidently arises from differentiation strategies.
Several papers use reaction functions estimates to analyze market power and firm’s strategies. Liang (1989) estimates price conjectural variations in the ready-to-eat breakfast cereal market to measure the degree of price competition in a differentiated product oligopoly. The empirical concludes that there is collusive behavior.
In the marketing literature, Lazzarini et al. (2007) study
competi-tion among insurance companies. They estimate reaccompeti-tion funccompeti-tions and conclude that pricing strategies are very different across firms.
Dhar et al. (2005) study the strategic pricing of Coca Cola and Pepsico leading brands products. The paper adopts a structural approach with estimation of demand and pricing equations. No su-pport is found for Bertrand or Stackelberg type of competition.
Vickner & Davies (1999) makes an empirical investigation about the market power and the pricing conduct in a representative product differentiated oligopoly: the spaghetti sauce market. It makes use of panel data to understand the price conduct and market power of firms. It concludes that a portion of the market power of the firms is derived from tacit price collusion.
Cotteril (2000) tries to understand the competitive interaction bet-ween private labels and national brands in the retail food industry. According to the authors before trying to understanding the nature of the competitive interaction between these two types of brands, it is necessary to understand both demand and strategic price setting behavior by the firms. This paper expands previous work by using a structural system of equations allowing both demand parameters and simultaneous estimation of competitive interaction.
3. Data
Data from the Central Bank of Brazil show that as of October 2011, over 130 financial institutions were approved to conduct bank clea-ring operations in the country. The magnitude of the banking seg-ment is routinely measured by the sum of assets of all financial institutions. We note in Table 1 the evolution of banking assets in Brazil: in December 2007, assets totaled R$2,519 billion, reaching R$4,271 billion in December 2010. An increase of approximately 70% is observed in this period.
Table 1 - Evolution of banking assets in Brazil
R$ Billion 2007 2008 2009 2010
Dec Dec Dec Dec
Assets 2,519.16 3,353.63 3,571.16 4,271.03
Annual Var. 33% 6% 20%
Among 2.1 trillion dollars of assets in loans in 2010, R$185 billion (approximately 4% of the total) represent loans for auto financing for individuals, the focus of this work. As observed in Table 2, this mar-ket shows steady growth from net financed assets of R$111 billion in 2007 to R$185 billion in 2010, representing growth of over 66%.
Table 2 - Evolution of the net assets of auto financing for individuals
2007 2008 2009 2010
Net assets (R$ billion) 111 139 157 185
Annual change 25% 13% 18%
Share of total assets 4% 4% 4% 4%
Source: ANEF.
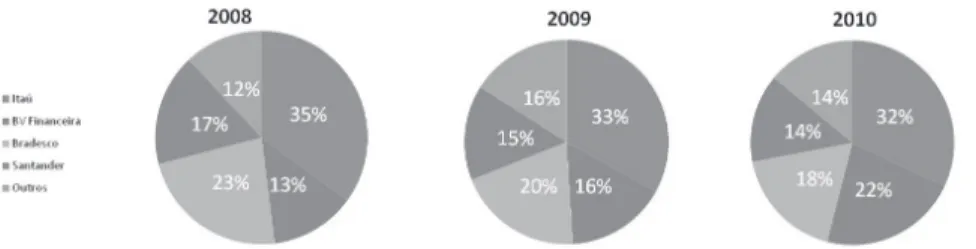
On the whole, the auto financing market has the same structure as the banking sector: a high number of competitors but high mar-ket concentration. Figure 1 shows that between 2008 and 2010, four institutions alone accounted for approximately 85% of all fi-nanced assets. Specifically, in 2010, Itaú Bank accounted for 32% of all loans destined for individuals for the acquisition of automobiles, BV Financeira (auto financing branch of Votorantim Bank) had a 22% share, and Bradesco and Santander had shares of 18% and 14%, respectively.
Figure 1 - Evolution of bank shares in assets of auto financing
Source: Central Bank of Brazil and bank websites.
each institution. As clarified by the Central Bank, “interest rates disclosed represent the total operation cost for the customer, also including fiscal and operational taxes. These rates correspond to the average charged rates in the period indicated in the tables”; that is, each institution operating in this segment reports the arithmetic rate average from all transactions performed on that day. The Special
Clearance and Escrow System (Sistema Especial de Liquidação e
Custódia; SELIC) rate was also collected from this website for the
period in question.
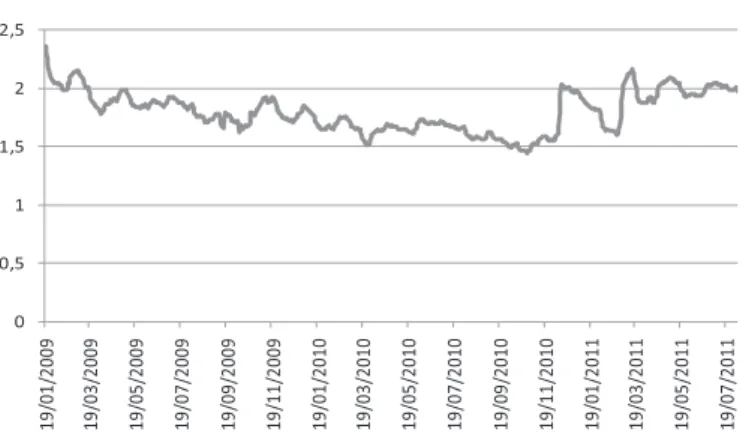
In Figure 2, it is possible to evaluate the average behavior of all con-solidated institutions. As we can see, for the period under review, the average rates fluctuate primarily between 1.5% and 2.5% per month. 0 0,5 1 1,5 2 2,5 19/ 01/ 200 9 19/ 03/ 200 9 19 /0 5/ 200 9 19/ 07/ 200 9 19 /0 9/ 200 9 19/ 11/ 200 9 19 /0 1/ 201 0 19 /0 3/ 201 0 19/ 05/ 201 0 19 /0 7/ 201 0 19 /0 9/ 201 0 19/ 11/ 201 0 19 /0 1/ 201 1 19/ 03/ 2011 19 /0 5/ 2011 19 /0 7/ 2011
Mean Monthly Rate (%)
Figure 2- Evolution of the average market rate (per month %)
Source: Central Bank of Brazil.
4. Model
The following analysis is similar to the one developed by Lazzarini
et al. (2007), who use a market model of differentiated goods
fea-turing price competition. The demand for firm i’s product is given
by the following equation:
Therefore, the quantity demanded for firm i’s product is negatively
related to its price (p i ) and directly related to the competitor’s
pri-ce (p j ). Assuming a cost structure with constant marginal cost and
fixed cost, we have the following profit equation:
(
(
(2)where:
ci= variable cost of firm i
Fi= fixed cost of firm i
Because the firm seeks to maximize profits, the best answer is given by the first-order condition—namely,
(3)
where
(4)
Therefore, the reaction function of firm i tells us that its price is a
function of its marginal cost and competitor prices. In the specific case of auto financing, we approximate the marginal cost by the basic interest rate (SELIC), which is the main cost of funding for a bank (see Koyama and Nakane, 2002). Therefore, of the equation is separated in two parts as follows:
and , where (5)
Note that we are only able to determine the values in our
estima-tion and that, without more assumpestima-tions, it is not possible to
To solve the general problem, it is necessary to develop a system of
equations for n market competitors, in which each company seeks to
optimize its price as a function of the competitors’ prices. However, in practical terms, we rarely know the competitors’ prices
simulta-neously. According to Fudenberg and Levini (1999) and Lazzarini et
al. (2007), one way to obtain this equilibrium is to observe previous
prices set by the competitor.
With this information, the following dynamic reaction curve is found:
(6)
where denotes the price of firm i in time t, is the lagged
price of firm i, denotes competitors’ lagged prices, and
de-notes the SELIC rate prevailing in the period. The betas () are the
coefficients of each variable to be estimated. So, the question now is: what can we say about the market competition with the reaction function estimates? Simply put, the model can identify between a perfect competitive environment, oligopolistic competition – price leadership and non-leadership - and other competitive environments. It is all based on the solely observation of price reactions and mar-ginal cost.
In a perfect competitive environment, the coefficients of the compe-titors’ prices should be zero, since the pricing strategies of the other firms should have no influence, and a firm’s own pricing should depend solely on marginal cost (SELIC).
There is market power when the competitors’ coefficients matter. In this case, firms are indeed pricing strategically in an oligopolistic type of competition, and we can distinguish between two situations:
price leadership versus no leadership. No leadership means that
fir-ms have a similar degree of market power. For any two banks, iand
j, it implies that the coefficient of bank j is statistically different
from zero in bank’s i equation and vice versa. We consider this case
as a competitive oligopoly a la Bertrand. For the price leadership
case, suppose institution i is the leader and jis the follower. Then,
the price coefficient of firm iis relevant for firm j pricing strategy,
interpretations, which we cannot distinguish between them. It can be a competitive oligopoly with a price leader, or it can be a cartel following a pricing rule based on some institution pricing decision. Since we cannot rule out between these two situations, price leader-ship means that some institution is setting the market price, but it can happen in a very distinct competitive environment.
5. Market Segmentation
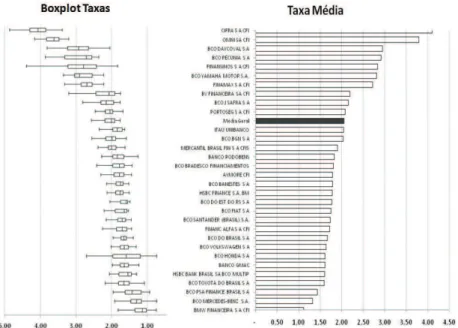
Once the modeling is defined, the data are analyzed in greater depth. Examining the average prices for each institution in the pe-riod of analysis and classifying them from the highest rate to the lowest, we have the results shown in Figure 3.
Figure 3 - Average rate and Boxplot of financial institution rates
Source: Central Bank of Brazil and analyzes.
The right side of Figure 3 shows the average rate per month prac-ticed by each institution, whereas the left side of the figure shows
the boxplot of the rates charged by the institution. The average rate
charged the highest rate (4.11%), and BMW Financeira S.A. charged the lowest average rate (1.11%). These extremes illustrate the wide range of market prices. The automakers’ banks, which are institu-tions that are part of the same financial group as the company that manufactures the vehicles, work with average rates that are lower than the market averages. Examples include BMW, Mercedes-Benz, Toyota, PSA Finance (Peugeot), Honda and GMAC (Chevrolet). At the top of the chart, we note the presence of high-risk financers: (Cifra, Omni, Daycoval, Pecunia), companies that finance vehicles for borrowers who present a higher probability of default and that thus charge rates higher than the market average (for more details, see Koyana, 2002).
The left side of Figure 3 shows the boxplot of the institution rates.
We observe that some banks have higher rates of dispersion. These banks showed greater rate variance in the period under review. It is interesting to note that the high deviation concentration is found in the extremes of the graph, that is, in the companies charging avera-ge rates that are lower than the market averaavera-ge (automaker banks) and those that are charging average rates above the market average (high-risk financers).
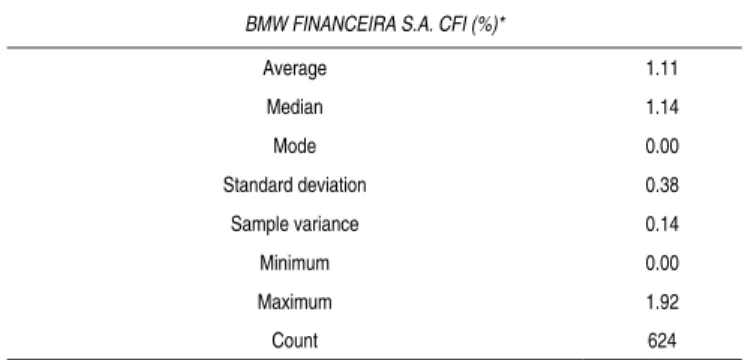
Table 3 - Descriptive analysis of the BMW Financeira data
BMW FINANCEIRA S.A. CFI (%)*
Average 1.11
Median 1.14
Mode 0.00
Standard deviation 0.38 Sample variance 0.14
Minimum 0.00
Maximum 1.92
Count 624
Source: Central Bank of Brazil * Data in % except for count.
With regard to companies that charge high average rates, the high rate variance is attributable to the profile of the customer buying the product. The probability of default is an important variable in the definition of the interest rate (AFANASIEFF, 2001). Assuming that companies should be sustainable and profitable, the interest rate charged should be compatible with the customer’s credit risk. Table 4 presents a descriptive analysis of Omni Financeira. The company has a monthly average rate of 3.79% (well over the value observed in Table 3 for BMW Financeira), its minimum observed rate is 3.21% (in another parallel, this rate is well over the maximum rate charged by BMW of 1.92%), and its maximum rate is 5.66%.
Table 4 - Descriptive analysis of Omni Financeira
OMNI S.A. CFI (%)
Average 3.79
Median 3.62
Mode 3.62
Standard deviation 0.51 Sample variance 0.26
Minimum 3.21
Maximum 5.66
Count 624
If we compare the data from automaker banks and high-risk finan-cers, we can see that there is strong market segmentation, with customers of distinct risk profiles buying from specific segments. According to Kotler (2000), the division of the market into homo-geneous groups allows for greater precision in defining market ni-ches. We define high-risk companies as the financial institutions that charge interest rates above one standard deviation of the average rate (i.e., companies whose average rates offered for the period was above 2.24% per month).
Thus far we have analyzed only the upper and lower sections of Figure 5: high risk and automakers. However, as shown in Figure 2 (data section), the majority of the sales (85% of the loans) were made by four firms: BV Financeira, Bradesco, Itaú and Santander. Their high market share renders it reasonable to classify these com-panies as the largest in the segment. This group is crucial to unders-tand whether they exert some type of influence on other companies
in the sector, such as a leader-follower game a la Stackelberg.
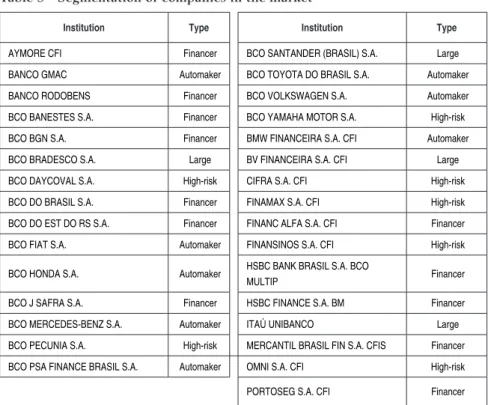
Table 5 - Segmentation of companies in the market
Institution Type Institution Type
AYMORE CFI Financer BCO SANTANDER (BRASIL) S.A. Large
BANCO GMAC Automaker BCO TOYOTA DO BRASIL S.A. Automaker
BANCO RODOBENS Financer BCO VOLKSWAGEN S.A. Automaker
BCO BANESTES S.A. Financer BCO YAMAHA MOTOR S.A. High-risk
BCO BGN S.A. Financer BMW FINANCEIRA S.A. CFI Automaker
BCO BRADESCO S.A. Large BV FINANCEIRA S.A. CFI Large
BCO DAYCOVAL S.A. High-risk CIFRA S.A. CFI High-risk
BCO DO BRASIL S.A. Financer FINAMAX S.A. CFI High-risk
BCO DO EST DO RS S.A. Financer FINANC ALFA S.A. CFI Financer
BCO FIAT S.A. Automaker FINANSINOS S.A. CFI High-risk
BCO HONDA S.A. Automaker HSBC BANK BRASIL S.A. BCO
MULTIP Financer
BCO J SAFRA S.A. Financer HSBC FINANCE S.A. BM Financer
BCO MERCEDES-BENZ S.A. Automaker ITAÚ UNIBANCO Large
BCO PECUNIA S.A. High-risk MERCANTIL BRASIL FIN S.A. CFIS Financer
BCO PSA FINANCE BRASIL S.A. Automaker OMNI S.A. CFI High-risk
PORTOSEG S.A. CFI Financer
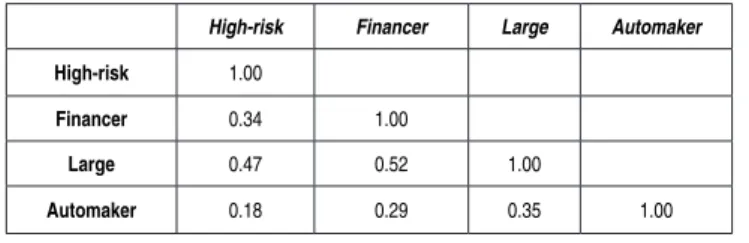
Table 6 - Correlation of variations in interest rates
High-risk Financer Large Automaker
High-risk 1.00
Financer 0.34 1.00
Large 0.47 0.52 1.00
Automaker 0.18 0.29 0.35 1.00
Due to their high sales volume, the four companies classified as large are analyzed individually to understand the relationship between them and previously defined groups. Once the segmentation is de-fined, the modeling part of the problem begins: reactions to pricing changes between the large companies and the other market niches are sought. A series of average prices practiced in the period for each one of the groups is used (in the case of automaker banks, for instance, for each available observation day, the average rate between all banks classified as “automaker” is presented in Table 5).
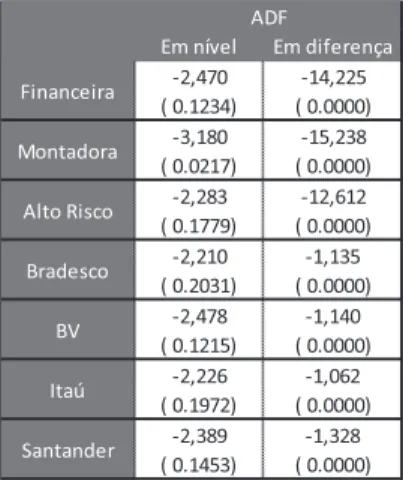
Before applying the model specified in Section 4, it is necessary to ensure that the equation to be tested does not have a unit root. To that end, the ADF test, which detects the existence of this problem, is applied.
As observed in the first column of Table 7, analyzing the data in le-vels, it is not possible to rule out the presence of unit roots. Hence, we estimate the model in differences, which eliminates the problem, as observed in the second column of Table 7. The model is fit to the following specification:
(7)
Therefore, the variation of the competitor i price change occurs as
Table 7 - Statistics of the unit root tests – market segmentation (p-values in parentheses)
Em nível Em diferença
-2,470 -14,225 ( 0.1234) ( 0.0000) -3,180 -15,238 ( 0.0217) ( 0.0000) -2,283 -12,612 ( 0.1779) ( 0.0000) -2,210 -1,135 ( 0.2031) ( 0.0000)
-2,478 -1,140 ( 0.1215) ( 0.0000)
-2,226 -1,062 ( 0.1972) ( 0.0000)
-2,389 -1,328 ( 0.1453) ( 0.0000)
ADF
Financeira
Montadora
Alto Risco
Bradesco
BV
Itaú
Santander
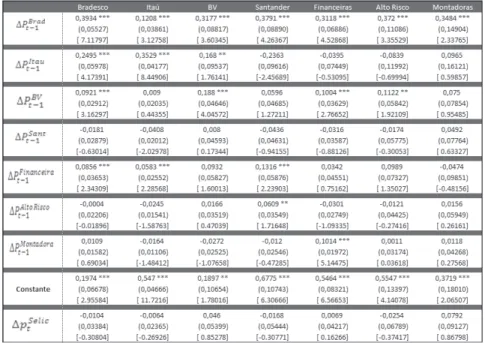
We estimate a VAR (Vector Autoregressive) model in our problem. The VAR is commonly used in systems of equations of intercon-nected time series to analyze random shocks in a dynamic setting. It allows for contemporaneous correlation among the disturbances, and therefore is preferable to estimating the equations independently. The results are shown in Table 8.
We observe in Table 8 the reaction curve estimates for the large companies and segments. The columns indicate the segment or com-pany under analysis, and the rows display the explanatory variables for each segment or company.
We note from the second column of the table that Bradesco Bank responds with price changes to the institution’s own past movement. The bank also responds with high intensity to price changes by Itaú and with lower – but statistically significant – intensity to price changes by BV Financeira and the group of financers. Also notewor-thy is the lack of response by Bradesco with regard to the interest rate movement of the high risk and automaker segments.
We observe that if the coefficient of company j( ) is significant in
the model of company i, then the price of competitor j affects the
demand of firm i. Therefore, the demand for Bradesco’s auto
Table 8 - Estimate of model parameters – Response functions
Standard deviation in parentheses ( ) and t-statistic in brackets [ ].
Obs.: ***, **, * indicate that the parameter is statistically significant at a confidence level of 1%, 5% and 10%, respectively.
The largest bank – Itaú, third column -responds positively to its own lagged moves, to the price variation of Bradesco and to price changes made by financers. These companies, when reducing their rates, also reduce the demand for the financing of Itaú, leading the bank to optimally reduce its rate. It is interesting to note that Itaú does not respond to BV Financeira’s price changes, although the latter company is the second-largest institution in financing volume (see Figure 2).
also responds to price changes among financers and, surprisingly, high-risk financers. Interestingly, there is no evidence that the bank significantly responds to price changes by Itaú or BV Financeira or to its own historical price changes. Therefore, the Santander demand is apparently not directly affected by the price fluctuations of the two largest companies of the segment.
Next, the results referring to the average behavior of the segments are analyzed – columns 6 to 8. Financers respond to price changes by Bradesco and BV Financeira and do not react to their own histo-rical price changes. This group is the only group among those under analysis that responds to the price changes among automaker banks, indicating that the automaker banks’ pricing impacts the demand of the financers. There is no evidence that the group responds to its own outdated price changes, which goes against the initial percep-tion that these firms are price followers—that is, that they observe price changes by leaders and adjust their rates.
While analyzing high-risk companies, we observed that they res-pond to price changes by Bradesco and BV Financeira, especially to those by Bradesco (coefficients of 0.372 and 0.1122, respectively). Considering that they serve high-risk customers, firms in this niche position their prices at a level higher than those of large companies and, as the large ones move, change their prices in response (either by increase/cost reduction or through short-term changes). The seg-ment bases its prices solely on price changes by the large companies, not caring about their own prices in previous periods.
Finally, automaker banks respond solely to interest rate changes by Bradesco Bank. It is possible that the financing demand of this seg-ment is linked to other factors, stronger than the price offered by the competitors; that is, the automaker banks apparently have inten-se strategic interactions with the other market inten-segments.
de-fine their price and followers, realizing this movement, adjust their offerings. Bradesco exerts a significant effect on the reaction curves of all groups and companies, evidencing the strong leadership of this institution. In contrast, Santander Bank does not present significant coefficients in the reaction curve of any company or bank, revealing the company to be a price follower in this market.
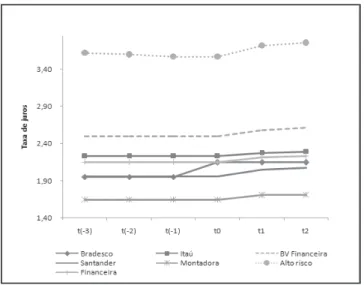
To better illustrate the results, the graphs below show some simula-tions of price changes and the consequences in the market. Figure 4 shows the effects in the market of an increase in Bradesco’s rate. In the simulation, the price of the institution in question is increased by 10%, with its rate shifted from 1.95% per month to 2.15% per month. As observed, immediately after the price change, all insti-tutions and groups begin to reflect this increase in their rates. In simulations, we note that an increase of 10% in Bradesco’s price leads to a 2.6% increase for Itaú Bank, a 4.5% increase for BV Financeira, a 5.6% increase for Santander, a 4.2% increase for automakers, a 5.2% increase for the high-risk group and a 3.9% increase for the financers.
Figure 4 - Simulation: Bradesco’s price increases by 10%
Figure 5 - Simulation: Itaú’s price increases by 10%.
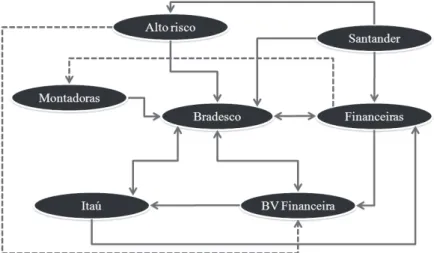
bidirectio-nal (Wassernan; Faust, 1994). Figure 6 illustrates this relationship between the four large companies and groups in the auto financing market (visually, when there is an overlap between arrows, one of them is dotted).
The high-risk group reacts only to movements by Bradesco and BV Financeira. The automakers react exclusively to Bradesco’s price changes. Itaú reacts to price changes by Bradesco and financers. BV Financeira adjusts its pricing based on price changes by Bradesco and Itaú. Financers respond to rate adjustments by Bradesco, BV Financeira and automaker banks. Finally, Santander changes its pri-ces when Bradesco, financers and high-risk financers adjust their rates. In addition, according to Figure 10, no group reacts to pri-ce changes by Santander, and all groups react to Bradesco’s pripri-ce changes.
Figure 6 - Reactions to price changes
the remaining firms. In markets with sequential movement, whose prices are primarily set by leaders, the industry reaps greater pro-fits compared with games with simultaneous moves, such as the Bertrand model (see Tirole (1988), for example).
7. Conclusions
The current study aims to quantitatively evaluate responses to price changes in the auto-financing segment with a focus on the short term.
Simple data analysis reveals two important facts. First, despite the presence of a large number of financial institutions financing auto purchase, there exists a strong concentration of sales among four institutions: Bradesco, BV Financeira, Itaú and Santander. Second, there is substantial heterogeneity in this market related to the rates charged and the market share of the firms. These characteristics na-turally separate firms in four niches: leaders, high-risk, automakers and financers.
We then estimate reaction functions for the market players. The objective was to learn how different firms and segments change their interest rates in response to price changes made by other firms, and to make inference about the competitive environment of this market. In conclusion, the majority of the market price changes are due to the three largest companies in this sector – Bradesco, BV Financeira and Itaú – highlighting the strong influence of Bradesco’s pricing policy on the other banks and market segments. This finding indicates that the large market shares of these companies enables them to substantially influence the market equilibrium, or the inte-rest rates offered in the market in the short term.
There is evidence that the auto financing market is potentially cha-racterized as a oligopoly playing a leader-follower sequential move pricing game. The leading companies set their prices and the others adjust their own rates as a function of these changes. This market organization results in higher profits for the industry as a whole, and enables the leading companies to maintain greater stability and assertiveness in their profits.
Therefore, in the retail auto financing industry companies that have a larger market share also have more market power and are able to influence rates offered to the final consumer. This finding shows that actions taken by the leading banks to increase the average rate are possible, and thus presents a reason for antitrust policy attention.
References
AFANASIEFF, T. S., LHACER, P. M. V., & NAKANE, M. (2001). Determinants of Bank Interest Spreads in Brazil. 2001. Available at: <www.bcb.gov.br>. Accessed on 14/10/2011.
ALLEN, F., BARTIROLO, L., & KOWALESWSKI, O. (2006). The Financial System of the EU 25.
Wharton Working Paper.
BAYE, M., & MORGAN, J (2002). Winner-take-all price competition. Economic Theory, 19.
BELAISCH, A. (2003). Do Brazilian Banks Compete?IMF Working Paper.
CLAESSENS, S., & LAEVEN L. (2008). What Drives Bank Competition? Some International Evidence.
Journal of Money, Credit and Banking, v. 36, no. 3.
COTTERILL, R. W., & PUTSIS, W. R. (2000). Market Share and Price Setting Behavior for Private
Labels and National Brands. Review of Industrial Organization, 17(1): 17-39.
COUGHLAN, A. T., & MANTRALA, M. K. (1994). Dynamic Competitive Retail Pricing Behavior
with Uncertainty and Learning. Managerial and Decision Economics, 15:3-20.
DHAR, T., CHAVAS, J., COTTERILL, R. W., & GOULD, B. W. (2005). An Econometric Analysis of
Brand-Level Strategic Pricing between Coca-Cola Company and PepsiCo. Journal of Economics
and Management Strategy, 14(4): 905-931.
FERREIRA, C. F. (2005).Estrutura, concorrência e performance do setor bancário em um mercado
heterogêneo. Thesis (Ph.D. in Economics) presented to the College of Economics, Administration
and Accounting of the University of São Paulo. São Paulo.
FUDENBERG, D., & LEVINE, D. K. (1999). The Theory of Learning in Games. Cambridge: MIT Press.
GREENE, W. H. (2008). Econometric Analysis. 6. Ed. New Jersey. Prentice Hall.
HO, Teck-Hua, CAMERER, C., & WAIGELT, K. (1998). Iterated Dominance and Iterated Best Response
in Experimental “p-beauty contests”. The American Economic Review, 88: 947-969.
KOTLER, P. (2000). Administração do Marketing. 10. ed. São Paulo: Prentice Hall.
LAZZARINI, S. G., ARTES, R., MOURA, M. L., & FUKUDA, F. R. (2006). Inteligência Competitiva na Prática: Métodos para Estimar e Analisar Reações de Competidores. In: Delane Botelho; Deborah
Moraes Zouain. (Org.). Pesquisa Quantitativa em Administração. Volume 1, Atlas, São Paulo.
LIANG, J. (1989). Price Reaction Functions and Conjectural Variations. Review of Industrial
Organiza-tion, 4(2): 31-58.
MADDALA, G.S., & WUS. A. (1999). A Comparative Study of Unit Root Test with Panel Data Simple
New Test. Oxford Bulletin of Economics and Statistics, 61: 631-652.
MÁLAGA, T., MAZIERO, P., & WERLANG, S. R. da C. (2011). Estudo de Rentabilidade Bancária.
Banco Itaú. Consultoria Econômica. Available at <http://www.febraban.org.br>. Acessed on 27/08/2011.
MARCO, S. A. (1999). Inteligência competitiva: deinições e contextualização. Revista Transinformação
do Departamento de Pós-graduação de Biblioteconomia, PUC de Campinas, 11: 95-102.
MESAK, H. I., & CLELLAND, R. (1979). A Competitive Pricing Model. Management Science, 25:
1057-1068.
MONTGOMERY, D. B., MOORE, M. C., & URBANY, J. E. (2005). Reasoning about Competitive
Reactions: Evidence from Executives. Marketing Science, 24: 138-149.
MOURA, M. L., ARTES, R., LAZZARINI, S. G., Caetano, Marco Antonio Leonel, & Goldberg, Marcelo
B. (2008). Does it Pay to Anticipate Competitor Reactions? International Journal of Business
and Economics, 7: 192-204.
MURRAY, I. W., & RICKARD, J. A. (1978). The Dynamics of Some Discrete Time Duopoly Price
Games Involving Cournot and Related best-response Strategies. Economica, 45: 297-303.
NAGLE, T. (1984). Economics Foundations for Pricing.The Journal of Business, 57: S3-S26.
NAKANE, M. I. A Test of Competition in Brazilian Banking. n. 12, mar. 2001. Central Bank of Brazil Working Paper. Acesso em: 24/12/2011.
OZAWA, C. Y. (2008). Estudos empíricos sobre a microeconomia bancária no Brasil. Thesis (Ph.D. in Economics) presented to the College of Economics, Administration and Accounting of the University of São Paulo, São Paulo.
PETTERINI, F. C., & JORGE NETO, P. M. (2003). Competição Bancária no Brasil após o Plano Real, CAEN Working Papers.
VICKNER, S. S., & DAVIES, S. P. (1999). Estimating Market Power and Pricing Conduct in a
Product-Differentiated Oligopoly: The Case of the Domestic Spaghetti Sauce Industry. Journal of