www.atmos-chem-phys.net/12/1229/2012/ doi:10.5194/acp-12-1229-2012
© Author(s) 2012. CC Attribution 3.0 License.
Chemistry
and Physics
A simple relationship between cloud drop number concentration
and precursor aerosol concentration for the regions of Earth’s large
marine stratocumulus decks
D. A. Hegg1, D. S. Covert1, H. H. Jonsson2, and R. K. Woods2
1Department of Atmospheric Sciences, University of Washington, Seattle, WA, USA 2Meteorology Department, Naval Post Graduate School, Monterey, CA, USA
Correspondence to:D. A. Hegg ([email protected])
Received: 12 October 2011 – Published in Atmos. Chem. Phys. Discuss.: 25 October 2011 Revised: 11 January 2012 – Accepted: 19 January 2012 – Published: 1 February 2012
Abstract. Aircraft–based measurements of cloud conden-sation nuclei (CCN), accumulation mode and Aitken mode number concentrations, cloud drop number concentration (CDNC), and selected ancillary measurements are presented for the three large, semi-permanent marine stratocumulus decks of the earth (in the Pacific offshore of California and Chile and in the Atlantic offshore of Namibia). Based on these data, a simple linear relationship between CDNC and the accumulation mode number concentration (AMNC) is derived via regression. The slope of the regression is 0.72±0.04 with anR2of 0.90, higher than those found for CDNC-CCN linear regressions. Explanations of the rela-tively favorable CDNC-AMNC relationship and its utility for climate studies are discussed.
1 Introduction
A key linkage in the concatenation of physical relationships that constitute the indirect radiative forcing of climate by aerosols is the dependence of cloud drop number concen-tration (CDNC) on the properties of the aerosol on which the drops form (IPCC, 2001, 2007). Hence, much effort has been expended on delineating the aerosol properties that render the particles effective as cloud condensation nuclei (CCN). Of course, the CCN activity of aerosols has been directly measured for many years (e.g., Hudson, 1983; Roberts et al., 2006) but such measurements are quite difficult and sub-ject to large errors (Chuang et al., 2000; McFiggans et al., 2006). Consequently, even now such measurements are rela-tively sparse and lack the global coverage necessary to effec-tively address global climate issues (Bellouin et al., 2009). Furthermore, CCN activity in itself does not offer informa-tion on the sources of the aerosol (for example whether nat-ural or anthropogenic), which is a key question for climate
change analysis. It is for this reason that numerous studies, commonly called “CCN closure studies”, have tried to link CCN activity to such aerosol properties as size and compo-sition (e.g., Juranyi et al., 2010; Dusek et al., 2010). Per-haps still more importantly, even if the CCN activation spec-trum of the aerosol is fully defined, there is not, in princi-ple, sufficient information in this alone to predict CDNC. Accompanying information on the supersaturations to which the aerosol will be exposed is equally necessary and this is a complex function of cloud dynamics and the CCN activ-ity itself (Twomey, 1959; Pringle et al., 2009; Hudson et al., 2010). Indeed, within global climate models CCN activity or even the aerosol size distribution is not commonly carried as a prognostic variable and the supersaturation is rarely if ever carried (Pringle et al., 2009).
Nevertheless, the value of such a simplified relationship as that proposed by Dusek et al. (2006), with its implied simple relationship between aerosols and CDNC, is tantalizing, not only from the standpoint of model usage but from that of re-mote sensing. Such parameters as, for example, the accumu-lation mode number concentration, are readily available from existing remote retrieval algorithms such as that for MODIS (Remer et al., 2005) and have a substantial validation history. In contrast, algorithms to retrieve CCN activity, while avail-able, have been little used and then with very modest success (e.g., Gasso and Hegg, 2003). Indeed, a recent assessment by Kapustin et al. (2006) suggests that effective remote retrieval of CCN activity will be very challenging. It therefore seems worthwhile to pursue a simple empirical CDNC-aerosol re-lationship, such as that implied by the Dusek et al. (2006) study, a bit further. In this study, we examine data on cloud microphysics and aerosol properties for selected venues of most importance to indirect aerosol forcing of climate, seek-ing such a relationship.
2 Venues
To avoid the problem of trying to fit a single simple CDNC-aerosol relationship to widely diverse environments, as dis-cussed by Pringle et al. (2009), the possibility of selecting a particular cloud regime that would be highly significant from the standpoint of global indirect aerosol radiative forc-ing should be explored. Fortunately, such a regime comes readily to mind. It is now widely accepted that anthropogenic aerosols can have a significant impact on the albedo of the ex-tensive subtropical marine stratocumulus decks that occur off the west coasts of Africa, and South and North America (e.g., Platnick and Twomey, 1994; Durkee et al., 2000; Huneuus et al., 2006; Keil and Haywood, 2003; Allen et al., 2011). Indeed, they are influenced by a variety of aerosol sources including industrial pollution, biomass burning, and marine emissions (cf., Hegg et al., 2010; Chand et al., 2010; Hay-wood et al., 2003).These decks are a major factor in the radia-tive balance of the atmosphere (Klein and Hartmann, 1993) and, due to a combination of cloud extent, frequency, and the cloud-type dependent sensitivity of cloud albedo to aerosol modulation, the climatic impact of aerosols on cloud micro-physics (the indirect effect) is largely determined by these decks (Warren et al., 1988; Platnick and Twomey, 1994; Allen et al., 2011). For example, Kogan et al. (1996) esti-mate the contribution of low stratiform clouds to the indirect forcing by aerosol as∼60 %. Hence, quantifying the CDNC-aerosol relationship in simple terms for these stratocumulus decks alone would have great benefit for understanding indi-rect aerosol radiative forcing globally.
The data examined here are derived primarily from the multi-year CARMA experiments, conducted off the Califor-nia coast of North America from 2004 to 2007 (cf., Hegg et al., 2007) and the VOCALS-Rex study conducted off
the Chilean coast of South America in 2008 (cf., Allen et al., 2011). Additionally, a small amount of data from the stratocumulus deck off the Namibian coast of Africa has been distilled from both the literature (e.g., Keil and Haywood, 2003) and from a data archive of the SAFARI 2000 study (University of Washington CARG archive at http://carg.atmos.washington.edu).
3 Methodology
All of the in situ data for the CARMA and VOCALS stud-ies were obtained with the CIRPAS Twin Otter research air-craft (www.cirpas.org). Most of the instrumentation package available on this aircraft has been described in a number of previous publications (e.g., Hegg et al., 2007; Wang et al., 2002, 2007). The key instruments for this study, used to mea-sure aerosol concentrations in the 0.1 to 3.0 µm size range and cloud drop number concentrations respectively, were the PCASP-100 (PMS/DMT, Boulder, CO) aerosol spectrome-ter, and either the PMS/DMT FSSP-100 spectrometer , used for CARMA (size range of 2–40 µm), or the DMT CAPS probe, used for VOCALS (size range of 0.5–45 µm). Dead-time errors in the FSSP were eliminated by use of a DMT SPP100 pulse height analyzer and coincidence errors were corrected using the procedure of Baumgardner et al. (1985). Additionally, two different CCN spectrometers were used to obtain CCN activation spectra. For the CARMA study, both the DMT model CCN-100 CCN spectrometer and the Uni-versity of Wyoming model MA-100 static diffusion chamber were utilized. For VOCALS, only the former instrument was used. All instruments were calibrated against (NH4)2SO4
and NaCl test aerosols generated by a TSI model 3076 Col-lison atomizer (TSI , St. Paul, MN) and size classified by a differential mobility analyzer (TSI model 3071). The laser scattering probes were also calibrated against silica and PSL spheres from Duke Scientific. Finally, Aitken particle con-centrations were determined as the difference between total particle concentrations as measured by a condensation par-ticle counter with a lower size limit of 0.01 µm diameter (TSI model 3010 CPC) and the PCASP number concentra-tion. Hence, the size range covered is 0.01 to 0.1 µm. For the Namibian data, in the case of both the Keil and Haywood study and the CARG archive, the CDNC data were acquired with a FSSP-100 and the AMNC data with a PCASP-100.
Fig. 1. Vertical profile of the accumulation mode number concen-tration (AMNC) and the cloud drop number concenconcen-tration (CDNC) through the stratocumulus deck sampled during CARMA IV on 27 August 2005.
closest possible juxtaposition of aerosol and CDNC. Numer-ous studies in the stratocumulus regions have demonstrated that the CDNC is almost exclusively connected to the below cloud and not the above cloud aerosol (cf., Hudson et al., 2010; Keil and Haywood, 2003; Martin et al., 1994). This is also evident in Fig. 1. Note that all available data from the CARMA and VOCALS studies have been employed, ir-respective of aerosol composition or source.
4 Results and discussion
Data from the vertical profiles used in the analysis are shown in Table 1. Note that the CDNC values used are the peak values measured in the profiles. This choice has been made as the most sensitive to below cloud aerosol properties (e.g., not distorted due to mixing). However, the profile data were also averaged over 5 s to reduce spikes due to noise so the peak value is representative. Corresponding peak cloud liq-uid water contents ranged from 0.15 to 0.65 g m−3 with a mean value of 0.38±0.15 g m−3.
The first CDNC-aerosol relationship examined is the de-pendence of the CDNC on the CCN number concentration. A linear regression of the CDNC onto the CCN concentra-tion active at a supersaturaconcentra-tion of 0.3 % is shown in Fig. 2. The supersaturation value of 0.3 % was selected as most char-acteristic of the stratocumulus examined here based on nu-merous past assessments (e.g., Hudson, 1983; Roberts et al., 2006; Hegg et al., 2009). Recent work by Hudson et al. (2010) has suggested that appreciably higher supersatura-tions can occur when aerosol concentrasupersatura-tions are low but for the accumulation mode aerosol concentration range for our CCN data set (180 to 675 cm−3, mean of 361 cm−3), 0.3 % is still the most appropriate value to use. The correlation shown
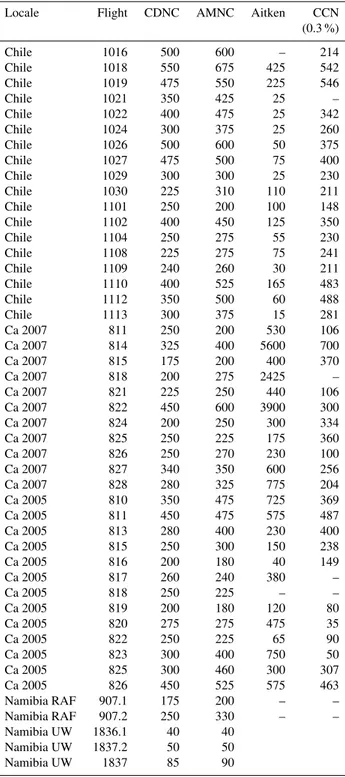
Table 1. Values of the variables used in the analysis derived from the vertical profiles through the cloud decks in the three regions ex-amined. Note that UW denotes data from the University of Wash-ington archive (see text) while RAF denotes data from Kiel and Haywood (2003).
Locale Flight CDNC AMNC Aitken CCN (0.3 %)
Chile 1016 500 600 – 214
Chile 1018 550 675 425 542 Chile 1019 475 550 225 546
Chile 1021 350 425 25 –
Chile 1022 400 475 25 342 Chile 1024 300 375 25 260 Chile 1026 500 600 50 375 Chile 1027 475 500 75 400 Chile 1029 300 300 25 230 Chile 1030 225 310 110 211 Chile 1101 250 200 100 148 Chile 1102 400 450 125 350 Chile 1104 250 275 55 230 Chile 1108 225 275 75 241 Chile 1109 240 260 30 211 Chile 1110 400 525 165 483 Chile 1112 350 500 60 488 Chile 1113 300 375 15 281 Ca 2007 811 250 200 530 106 Ca 2007 814 325 400 5600 700 Ca 2007 815 175 200 400 370 Ca 2007 818 200 275 2425 – Ca 2007 821 225 250 440 106 Ca 2007 822 450 600 3900 300 Ca 2007 824 200 250 300 334 Ca 2007 825 250 225 175 360 Ca 2007 826 250 270 230 100 Ca 2007 827 340 350 600 256 Ca 2007 828 280 325 775 204 Ca 2005 810 350 475 725 369 Ca 2005 811 450 475 575 487 Ca 2005 813 280 400 230 400 Ca 2005 815 250 300 150 238 Ca 2005 816 200 180 40 149 Ca 2005 817 260 240 380 –
Ca 2005 818 250 225 – –
Ca 2005 819 200 180 120 80 Ca 2005 820 275 275 475 35 Ca 2005 822 250 225 65 90 Ca 2005 823 300 400 750 50 Ca 2005 825 300 460 300 307 Ca 2005 826 450 525 575 463 Namibia RAF 907.1 175 200 – – Namibia RAF 907.2 250 330 – – Namibia UW 1836.1 40 40
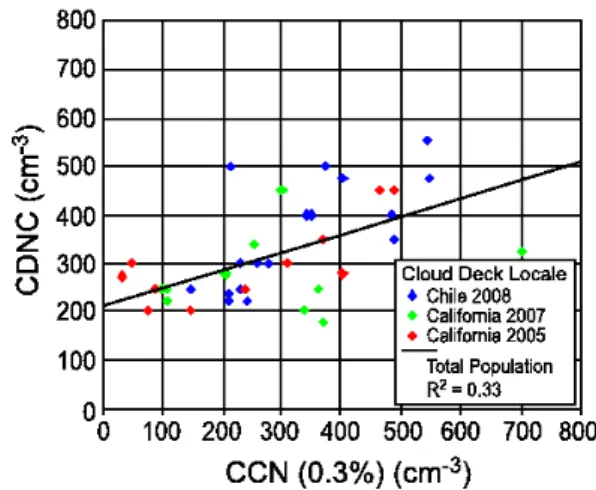
Fig. 2. Linear regression of the cloud drop number concentration (CDNC) onto the concentration of CCN active at 0.3 % supersatu-ration (CCN (0.3 %)) from three separate studies in two of the three major stratocumulus decks on earth.
in the Figure (R2=0.33), while certainly highly significant, is not particularly good, suggesting that in fact most of the variance in CDNC is not explained by the variance in CCN (0.3 %). Regressions of CDNC onto CCN active at other su-persaturations (0.2 to 1.0 %) were still less impressive. As discussed above, this is expected and likely simply reflects the variability in supersaturations achieved in the cloud decks as well as the uncertainties in the CCN measurements.
As an alternative to selecting the CCN concentration at any particular supersaturation, a regression is next examined of the CDNC onto the total accumulation mode number con-centration (AMNC). Numerous studies have pointed out that the AMNC is often a useful surrogate for effective CCN (i.e., the number of CCN actually activated). For example, Martin et al. (1994) found it to be a useful indicator of CDNC for the region around and to the north of the Azores in the North At-lantic, a region of mixed stratocumulus and cumulus clouds. Similarly, Leaitch et al. (1986) found a close relationship be-tween AMNC and CDNC for mostly stratiform clouds (with some moderate convection) over Ontario, Canada and New York state. It has been used extensively in modeling stud-ies (Pringle et al., 2009) and, indeed, has proven a useful surrogate for CCN in the venues selected here for analysis (e.g., Hegg et al., 2010; Twohy et al., 2005). Figure 3 shows this regression for data from all three stratocumulus venues (though for the Namibian deck only a few points are avail-able: two profiles form Keil and Haywood and three from the CARG archive). The regression relationship is surpris-ingly strong with a slope of 0.72±0.04 and anR2of 0.90, i.e., 90 % of the variance in the CDNC is explained by the AMNC. This compares very favorably with regression rela-tionships between CDNC and CCN at any supersaturation (e.g., Hudson et al., 2010), even those that try to take into ac-count variability in the cloud supersaturation (e.g., Hudson
Fig. 3. Linear regression of cloud drop number concentration (CDNC) onto accumulation mode number concentration (AMNC). Data are primarily from the California and Chilean cloud decks but a few points from the Namibian deck are included as well.
and Noble, 2009). It is also noteworthy that this relation-ship is consistent with data from the earlier study by Twohy et al. (2005). The Twohy et al. (2005) study was conducted at a location several hundred km south of the CARMA op-erational area but was nevertheless within the region of the California Sc deck. The authors measured sub-cloud AMNC with a PCASP-100 and CDNC with a FSSP-100, i.e., the same instruments used to acquire most of the data in our analysis. Twohy et al. (2005) chose to fit their data to a non-linear relationship (quadratic polynomial) between CDNC and AMNC, deriving a curve with an R2=0.90. How-ever, the data also appear able to support a good linear re-lationship. To explore this, we extracted values of AMNC and CDNC from Fig. 3 of Twohy et al. (2005), validating the extraction by reproducing the non-linear fit of the au-thors within the uncertainty of the regression coefficients and with anR2=0.89. We then derived a linear fit of CDNC to AMNC with a slope of 0.66±0.7, intercept of 27±15, andR2=0.87, i.e., a relationship that does not differ sig-nificantly from ours and which in fact provides a fit equally as good as the non-linear, three parameter fit of Twohy et al. Hence, we feel that this study supports our relation-ship. Similarly, a very recent study by Kleinman et al. (2012) in the VOCALS operational area found a strong correlation between AMNC and CDNC. As with Twohy et al. (2005), the authors chose a non-linear regression to characterize the AMNC-CDNC relationship but, as with Twohy et al. (2005), we estimate that a good linear fit is feasible with a slope of
Several years ago, Stevens and Feingold (2009) pointed out that understanding the effects of aerosols on clouds and precipitation was a particularly difficult problem due to the large number of negative feedbacks in the system. The au-thors label such feedbacks buffers since they consist of pro-cesses within a system that act in the opposite sense of any perturbation in system input, thus attenuating the impact of such changed input, much like a chemical buffer in solution chemistry. Such buffers tend to obscure functional depen-dencies. As a specific example, they pointed to the cloud drop activation process in which a reduction in the pre-cloud aerosol size distribution or composition would tend to re-duce CCN concentrations at the lower supersaturations. This would reduce initial CDNC and would lead to locally higher supersaturations, and thus to the activation of smaller parti-cles (e.g., Aitken mode) than would otherwise be activated. This would reduce the variation in CDNC compared to vari-ance in the pre-cloud particle properties.
Looking more closely at this buffer, it is clear that sev-eral different particle-supersaturation linkages are possi-ble, depending on the number size distribution and hygro-scopicity of the aerosols present. This can be visualized most clearly by considering the issue as first formulated by Twomey (1959). The supersaturation achieved in-cloud is the difference between a source term for water vapor mix-ing ratio (essentially either adiabatic coolmix-ing due to vertical velocity or radiative cooling) and a sink term that is conden-sation onto activated particles. In these terms, three differ-ent CDNC-AMNC linkages seem feasible. (1) The first and simplest linkage is when the particles present are sufficiently large and hygroscopic relative to, say, the cloud updraft and consequent cooling rate that all of the aerosol particles ac-tivate ab initio. Increases in the updraft will then have no impact on the CDNC. The activated cloud drops will simply grow faster as they ascend faster in the cloud. (2) A second possible linkage between CDNC, precursor aerosol and in-cloud supersaturation is the one most often discussed in the literature. If one reduces the number of large particles (e.g., accumulation mode) compared to the first scenario, and all of the particles have more or less the same hygroscopicity, then as supersaturation increases because of the relatively small water vapor sink term, smaller particles (e.g., Aitken mode) are activated until the sink term grows sufficiently to halt increase in the supersaturation. These additional smaller particles act as a buffer to compensate for the relatively low number of larger particles present, i.e., the CDNC could be the same for both the first and second scenarios even though the size distributions are quite different between them. (3) Fi-nally, if the precursor aerosol particles within, say, the accu-mulation mode have sufficiently different composition and resulting hygroscopicity, only the most hygroscopic may ini-tially activate, the less hygroscopic particles only activat-ing as the cloud supersaturation builds to values equal to or greater than their critical supersaturation. This variable hy-groscopicity thus leads to a reservoir of buffer particles as in
the second scenario except that in this case the buffer consists of less hygroscopic accumulation mode particles rather than smaller (Aitken) particles.
For the data presented here, it is the third scenario that ap-pears to be the most likely explanation for the highR2value for the CDNC-AMNC regression for the following reasons. First, it is noteworthy that the slope of the regression line is 0.72±0.04 (intercept of 47±13) and that, on average, only
∼80 % of the AMNC are activated .There is thus a reservoir of unactivated AMNC to act as a buffer for higher cloud su-persaturations. Second, in the few cases (8 of 47) for which the CDNC actually exceeded the AMNC, it was not by much, on average less that 14 % of the AMNC even though plenty of Aitken particles were present. The excess CDNC consti-tutes on average only 14 % of the Aitken particle concen-tration. In agreement with this, a multiple linear regression of CDNC onto both AMNC and Aitken particle concentra-tions yields anR2 of 0.87, i.e., essentially unchanged from the value for AMNC alone. The AMNC term coefficient or regression slope (0.66±0.04) and the intercept (67±17) do not differ from the AMNC-only regression while the Aitken term coefficient is −0.006±0.005, all suggesting a negli-gible impact by the Aitken mode. Indeed, even if one re-stricts the regression to only those cases with excess CDNC (i.e., CDNC>AMNC), a similar multiple regression yields anR2of 0.77, AMNC term coefficient of 0.84±0.3, Aitken term coefficient of 0.036±0.035 and intercept of 56±55. These values indicate that, even for cases in which activation of Aitken particles must be invoked to explain CDNC, only
∼4 % of the CDNC form on these particles. On the other hand, it is important to remember that, as with all such em-pirical relationships, its limiting behavior outside of the data domain from which it derives may be unphysical. For exam-ple, as AMNC decreases to zero the CDNC are predicted to limit to the intercept value of 47 cm−3 whereas one would expect on physical principles that the number of Aitken par-ticles activated would increase quite plausibly beyond this number and certainly to a variable degree. Nevertheless, taken together, the regression analyses suggest a negligible role for Aitken particles in our venues and that the larger buffer leading to stability in the CDNC-AMNC relationship is less-hygroscopic accumulation mode particles. Observa-tions of other properties (e.g., hygroscopicity) of the accu-mulation mode in the stratocumulus venues support this (to be discussed below).
Fig. 4. Variability in the hygroscopicity (quantified byκ, see text) of aerosols as a function of size observed during CARMA-III in the region of the California cloud deck. Data were from a H-TDMA. The error bars and red boxes denote the 95 % and quartile ranges, respectively, of the measurement population. (Derived from Kaku et al., 2006.)
the individual composition of even similarly sized particles can vary substantially. Such variance leads to variance in the hygroscopicity of atmospheric particles (Pratt and Prather, 2010). Indeed, numerous studies in marine air have demon-strated such variability with size (e.g., Hegg et al., 2008) and even for similarly sized particles (e.g., Swietlicki et al., 2000). Figure 4 illustrates variability in hygroscopicity with size for aerosols in the CARMA operational area (Kaku et al., 2006). The widely used kappa (κ) parameter of Petters and Kreidenweis (2007, 2008) is employed to quantify the hygroscopicity. Note that the mean and quartile values of hygroscopicity tend to decrease with decreasing size, a re-lationship that extends well up into the accumulation mode (Hegg et al., 2008). Given that the effective CCN concen-tration is the sum of all particles activated above a threshold that is commonly at the lower end of the accumulation mode, the observed hygroscopicity variation with size would of it-self lead to substantial variability inκ and subsequent CCN activity, thus leading to a substantial CCN buffer within the accumulation mode. However, other marine data sets have additionally shown variability in the hygroscopicity of parti-cles of precisely the same size as well. An example of this is shown in Fig. 5.
The lower aerosol hygroscopicity at smaller sizes just dis-cussed has important consequences. It likely is due to an en-hanced organic presence at the smaller sizes (e.g., Neususs et al., 2000; Pratt and Prather, 2010; Guazzotti et al., 2001) possibly due to the primary particle production process in marine air (e.g., Oppo et al., 1999), offshore advection of pollution (Hawkins et al., 2011), or organic secondary pro-duction processes (e.g., Dusek et al., 2010). Another, alter-native secondary production possibility that could contribute to the observed hygroscopicity distribution is in-cloud sulfate production. This process can preferentially enhance the
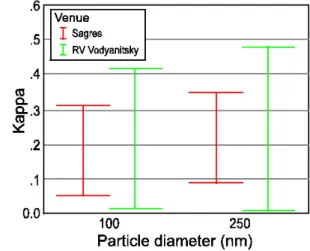
Fig. 5.Variability in aerosol hygroscopicity for particles of the same size. Observations are in marine air in the Eastern Atlantic and are from Swietliki et al. (2000). The error bars represent the range of the measured values.
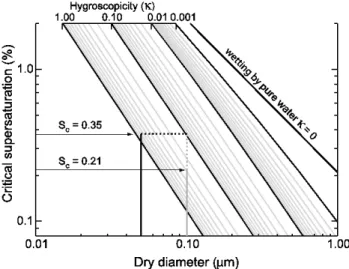
Fig. 6.Diagram illustrating the relationship between size and criti-cal supersaturation (Sc)as a function of aerosol hygroscopicity (κ)
for two different particle sizes: one at the low end of the accumula-tion mode (0.1 µm) and one in the Aitken range (0.05 µm). (Based on Petters and Kreidenweis, 2007.)
Aitken particles, in accord with the excellent CDNC-AMNC relationship observed. While our analysis has been confined to the three main semi-permanent stratocumulus decks of the earth, The results we present are in general accord with an earlier study (Martin et al., 1994) based partly on data from one of these regions (that of the California deck) but also from stratocumulus from several additional regions (i.e., the mid-Atlantic based on data from the ASTEX experiment as well as from FATE – South Atlantic other than Namibia – and in the general region of the British Isles). These authors do not present quantitative regression analysis for their compar-isons of CDNC with AMNC but in their Fig. 8, it is clear that the data for marine air masses would have well fit a linear re-gression with a slope of∼0.75 and a small positive intercept, essentially the same result we see for our data.
It is equally noteworthy that data that come from air masses that Martin et al. (1994) characterize as continental would not fit the same relationship and, indeed, show sub-stantially more variance than do the marine data. Never-theless, they would likely achieve a good linear fit to a dif-ferent linear function, one with a significantly lower slope. This lower slope may well be associated with drier, warmer continental air rather than with higher aerosol concentra-tions alone (cf., Brenguier et al., 2003). The latter hypoth-esis (lower slope due to higher aerosol concentration alone) has been suggested by some earlier studies in which a sub-linear relationship between CDMC and AMNC has been ad-vocated due to assumed vapor depletion at higher AMNC (e.g., Chuang et al., 2000). Certainly, all variables other than aerosol concentration being held constant, such a vapor de-pletion effect must eventually occur, leading to a “role off” in CDNC compared to AMNC. However, the precise location
will be a complex function of numerous variables such as the temperature at the lifting condensation level, updraft veloc-ity, the shape and composition of the aerosol size spectrum, etc (cf., Chuang et al., 2000; Leaitch et al., 1996). For ex-ample, we note that Bowers et al. (2000) found no evidence of a “role off” for aerosol concentrations until the concentra-tions (which encompassed both clean marine and continental pollution cases) exceeded 4000 cm−3. On the other hand, Lu et al. (2008), looking at the CDNC-AMNC relationship in polluted air in the Gulf of Mexico, reported a decrease in ac-tivation efficiency in the 400–800 cm−3AMNC range, about the same as the “role-off” point in Martin et al. Similarly, Leaitch et al. (1986) found a “role-off” point for continental clouds of∼700–800 cm−3with a slope below this point quite similar to that derived from our data. Raga and Jones (1993) found still lower activation efficiencies and “role-off” in Cu near Great Britain, though here the finding is likely due in part to sampling near cloud top with consequent entrainment effects.
For our venues, we see neither the decrease in aerosol acti-vation efficiency with size suggested by some earlier studies nor the dichotomy between the efficiency for marine and con-tinental air masses evident in the Martin et al. (1994) data. Though some earlier work done in the California stratocu-mulus region (Lu et al., 2007) does suggest the possibility of a non-linear relationship, the variable used for sub-cloud aerosol is essentially the CN concentration rather than the AMNC and a lower slope than we see, particularly at high CN concentration, is to be expected. On the other hand, the study by Twohy et al. (2005), which did examine the CDNC – AMNC relationship, is entirely consistent with our data, as noted earlier. The Kleinman et al. (2012) study, with somewhat less certainty, also appears consistent. Given this support for our simple relationship, it is important to note that our Sc deck venues experience a wide range of aerosol size distributions and compositions, reflecting the variety of sources that impact them (e.g., Roberts et al., 2006; Hegg et al., 2010; Chand et al., 2010; Hawkins et al., 2010; Hay-wood et al., 2003), and yet have the relatively uniform activa-tion efficiency illustrated in Fig. 3 of the text. We speculate that a favorable combination of the MBL thermodynamics and dynamics characteristic of Sc decks in our venues likely provides sufficient water vapor for the available AMNC to avoid the depletion phenomenon. However, a quantitative as-sessment of this issue is beyond the scope of this study. We simply caution, once again, that our results are applicable in principle only to our venues.
5 Conclusions
simple linear relationship between the peak cloud drop con-centration in the stratocumulus decks and the correspond-ing concentration of accumulation mode particles just below cloud base. The explanation for this relationship is likely the broad range of aerosol hygroscopicity within the accumula-tion mode, due to the variety of aerosol sources impacting the decks. This results in a buffer of less hygroscopic particles to stabilize the CDNC as per the paradigm noted by Stevens and Feingold (2009). While it is likely that the validity of the derived regression relationship is limited to the regions from which it derives, those regions are the most significant for the indirect forcing of climate by aerosols (e.g., Kogan et al., 1996). Hence, the relationship could be of considerable value in both modeling exercises and remote sensing pertain-ing to the climate change issue.
Acknowledgements. This study was supported by ONR grant
N00014-07-1-0277. We thank Rob Wood for useful comments and discussion. We also thank Richard Leaitch and two other anonymous reviewers for helpful comments.
Edited by: L. M. Russell
References
Allen, G., Coe, H., Clarke, A., Bretherton, C., Wood, R., Abel, S. J., Barrett, P., Brown, P., George, R., Freitag, S., McNaughton, C., Howell, S., Shank, L., Kapustin, V., Brekhovskikh, V., Klein-man, L., Lee, Y.-N., Springston, S., Toniazzo, T., Krejci, R., Fochesatto, J., Shaw, G., Krecl, P., Brooks, B., McMeeking, G., Bower, K. N., Williams, P. I., Crosier, J., Crawford, I., Connolly, P., Allan, J. D., Covert, D., Bandy, A. R., Russell, L. M., Trem-bath, J., Bart, M., McQuaid, J. B., Wang, J., and Chand, D.: South East Pacific atmospheric composition and variability sam-pled along 20◦S during VOCALS-REx, Atmos. Chem. Phys., 11, 5237–5262, doi:10.5194/acp-11-5237-2011, 2011.
Baumgardner, D., Strapp, W., and Dye, J. E.: Evaluation of the for-ward scattering aerosol spectrometer probe, Part II: Corrections for coincidence and dead-time losses, J. Atmos. Oceanic Tech-nol., 2, 626–632, 1985.
Bellouin, N., Jones, A., Haywood, J., and Christopher, S. A.: Updated estimate of aerosol direct radiative forcing from satellite observations and comparison against the Hadley Centre climate model, J. Geophys. Res., 113, D10205, doi:10.1029/2007JD009385, 2008.
Bi, X. H., Zhang, G. H., Li, L., Wang, X. M., Li, M., Sheng, G. Y., Fu, J. M., and Zhou, Z.: Mixing state of biomass burning par-ticles by single particle aerosol mass spectrometer in the urban area of PRD, China, Atmos. Environ., 45, 3447–3453, 2011. Bowers, K. N., Choularton, T. W., Gallagher, M. W., Beswick, K.
M., Flynn, M. J., Allen, A. G., Davison, B. M., James, J. D., Robertson, J. L., Harrison, R. M., Hewitt, C. N., Cape, J. N., McFadyen, G. G., Milford, C., Sutton, M. A., Martinsson, B. G., Frank, G., Swietlicki, E., Zhou, J., Berg, O. H., Mentes, B., Pa-papiropoulos, G., Hansson, H.-C., Leck, C., Kulmala, M., Aalto, P., Vakeva, M., Berner, A., Bizjak, M., Fuzzi, S., Laj, P., Fac-chini, M.-C., Orsi, G., Ricci, L., Nielsen, M., Allan, B. J., Coe, H., McFiggans, G., Plane, J. M. C., Collett Jr., J. L., Moore, K. F.,
and Sherman, D. E.: ACE-2 HILLCLOUD, An overview of the ACE-2 ground-based cloud experiment, Tellus B, 52, 750–778, 2000.
Brenguier, J.-L., Pawlowska, H., and Schuller, L.: Cloud micro-physical and radiative properties for parameterization and satel-lite monitoring of the indirect effect of aerosol on climate, J. Geo-phys. Res., 108, 8632, doi:10.1029/2002JD002682, 2003. Chand, D., Anderson, T. L., Wood, R., Charlson, R. J., Hu, Y.,
Liu, Z., and Vaughan, M.: Quantifying above-cloud aerosol using spaceborne lidar for improved understanding of cloudy-sky direct climate forcing, J. Geophys. Res.,113, D13206, doi:10:10.1029/2007JD009433, 2008.
Chand, D., Hegg, D. A., Wood, R., Shaw, G. E., Wallace, D., and Covert, D. S.: Source attribution of climatically important aerosol properties measured at Paposo (Chile) during VOCALS, Atmos. Chem. Phys., 10, 10789–10801, doi:10.5194/acp-10-10789-2010, 2010.
Chuang, P. Y., Collins, D. R., Pawlowska, H., Snider, J. R., Jonsson, H. H., Brenguier, J.-L., Flagan, R. C., and Seinfeld, J. H.: CCN measurements during ACE-2 and their relationship to cloud mi-crophysical properties, Tellus, 52B, 843–867, 2000.
Durkee, P. A., Noone, K. J., Ferek, R. J., Johnson, D. W., Tay-lor, J. P., Garrett, T. J., Hobbs, P. V., Hudson, J. G., Bretherton, C. S., Innis, G., Frick, G. M., Hoppel, W. A., O’Dowd, C. D., Russell, L. M., Gasparovic, R., Nielsen, K. E., Tessmer, S. A., Ostrom, E., Osborne, S. R., Flagan, R. C., Seinfeld, J. H., and Rand, H.: The Impact of Ship-Produced Aerosols on the Mi-crostructure and Albedo of Warm Marine Stratocumulus Clouds, A Test of the MAST Hypothesis Li and Lii, J. Atmos. Sci., 57, 2554–2569, 2000.
Dusek, U., Frank, G. P., Hildebrandt, L., Curtius, J., Schneider, J., Walter, S., Chand, D., Drewnick, F., Hings, S., Jung, D., Bor-rmann, S., and Andreae, M. O.: Size matters more than chem-istry for cloud-nucleating ability of aerosol particles, Science, 312, 1375–1378, 2006.
Dusek, U., Frank, G. P., Curtius, J., Drewnick, F., Schneider, J., Kurten, A., Rose, D., Andreae, M. O., Borrmann, S., and P¨oschl, U.: Enhanced organic mass fraction and decreased hy-groscopicity of cloud condensation nuclei (CCN) during new particle formation events, Geophys. Res. Lett., 37, L03804, doi:10.1029/2009GL040930, 2010.
Furutani, H., Dall’osto, M., Roberts, G., and Prather, K. A.: Assess-ment of the relative importance of atmospheric aging on CCN activity derived from field measurements, Atmos. Environ. , 42, 3130–3142, 2008.
Gasso, S. and Hegg, D. A.: On the retrieval of columnar aerosol mass and CCN concentration by MODIS, J. Geophys. Res., 108, 4010, doi:10.1029/2002JD002382, 2003.
Guazzotti, S. A., Coffee, K. R., and Prather, K. A.: Continuous mea-surements of size-resolved particle chemistry during INDOX-Intensive Field Phase 99, J. Geophys. Res., 106, 28607–28627, 2001.
Hawkins, L. N., Russell, L. M., Covert, D. S., Quinn, P. K., and Bates, T. S.: Carboxylic acids, sulfates, and organosulfates in processed continental organic aerosol over the southeast Pa-cific Ocean during VOCALS-Rex 2008, J. Geophys. Res., 115, D13201, doi:10.1029/2009JD013276, 2010.
optical properties of regional haze dominated by biomass burning aerosol measured from the C-130 aircraft during SAFARI 2000, J. Geophys. Res., 108, D138473, doi:10.1029/2002JD002226, 2003.
Hegg, D. A., Nielsen, K., Covert, D. S., Jonsson, H. H., and Dur-kee, P. A.: Factors influencing the mesoscale variations in marine stratocumulus albedo, Tellus B, 59, 66–76, 2007.
Hegg, D. A., Covert, D. S., and Jonsson, H. H.: Measurements of size-resolved hygroscopicity in the California coastal zone, At-mos. Chem. Phys., 8, 7193–7203, doi:10.5194/acp-8-7193-2008, 2008.
Hegg, D. A., Covert, D. S., Jonsson, H. H., and Woods, R.: Differ-entiating natural and anthropogenic cloud condensation nuclei in the California coastal zone, Tellus B, 61, 669–676, 2009. Hegg, D. A., Covert, D. S., Jonsson, H. H., and Woods, R. K.: The
contribution of anthropogenic aerosols to aerosol light-scattering and CCN activity in the California coastal zone, Atmos. Chem. Phys., 10, 7341–7351, doi:10.5194/acp-10-7341-2010, 2010. Henning, S., Wex, H., Henning, T., Kislev, A., Snider, J. R., Rose,
D., Dusek, U., Frank, G. P., Poschl, U., Kristensson, A., Bilde, M., Tillman, R., Kiendler-Schnarr, A., Mentel, T. F., Walter, S., Schneider, J., Wennrich, C., and Stratmann, F.: Soluble mass, hy-groscopic growth, and droplet activation of coated soot particles during LACIS Experiment in November (LexNo), J. Geophys. Res., 115, D11206, doi:10.1029/2009JD012626, 2010.
Hudson, J. G.: Effects of CCN concentration on stratus clouds, J. Atmos. Sci., 40, 480–486, 1983.
Hoppel, W., Fitzgerald, J., Frick, G., Larson, R., and Mack, E: Aerosol size distributions and optical properties found in the ma-rine boundary layer over the Atlantic Ocean, J. Geophys. Res., 95, 3659–3686, doi:10.1029/JD095iD04p03659, 1990.
Hudson, J. G.: Variability of the relationship between particle size and cloud-nucleating ability, Geophy. Res. Lett., 34, L08801, doi:10.1029/2006GL028850, 2007.
Hudson, J. G. and Noble, S.: CCN and cloud droplet concentra-tions at a remote ocean site, Geophys. Res. Lett., 36, L13812, doi:10.1029/2009GL038465, 2009.
Hudson, J. G., Noble, S., and Jha, V.: Stratus cloud supersaturations, Geophys. Res. Lett., 37, L21813, doi:10.1029/2010GL045197, 2010.
Huneeus, N., Gallardo, L., and Rutllant, J. A.: Offshore transport episodes of anthropogenic sulfur in Northern Chile: potential im-pact on the stratocumulus cloud deck, Geophys. Res. Lett., 33, L19819, doi:10.1029/2006GL026921, 2006.
IPCC, Climate Change: The Scientific Basis: contributions of Working Group I to the Third Assessment Report of the IPCC, edited by: Houghton, J. T., Ding, Y., Griggs, D. J., Noguer, M., van der Linden, P. J., Dai, X., Maskell, K., and Johnson, C. A., Cambridge University Press, New York, 881 pp., 2001. IPCC, Climate Change: The Physical Science Basis: contribution of
Working Group 1 to the Fourth Assessment Report of the IPCC, edited by: Solomon, S., Qin, D., Manning, M., Chen, Z., Mar-quis, M., Averyt, K. B., Tignor, M., and Miller, H. L., Cambridge University Press, New York, 996 pp., 2007
Jur´anyi, Z., Gysel, M., Weingartner, E., DeCarlo, P. F., Kam-mermann, L., and Baltensperger, U.: Measured and modelled cloud condensation nuclei number concentration at the high alpine site Jungfraujoch, Atmos. Chem. Phys., 10, 7891–7906, doi:10.5194/acp-10-7891-2010, 2010.
Kaku, K. C., Hegg, D. A., Covert, D. S., Santarpia, J. L., Jonsson, H., Buzorius, G., and Collins, D. R.: Organics in the Northeast-ern Pacific and their impacts on aerosol hygroscopicity in the subsaturated and supersaturated regimes, Atmos. Chem. Phys., 6, 4101–4115, doi:10.5194/acp-6-4101-2006, 2006.
Kapustin, V. N., Clarke, A. D., Shinozuka, Y., Howell, S., Brekhovskikh, Nakajima, T., and Higurashi, A.: On the de-termination of cloud condensation nuclei from satellites: chal-lenges and possibilities, J. Geophys. Res., 111, D04202, doi:10.1029/2004JD005527, 2006.
Keil, A. and Haywood, J. M.: Solar radiative forcing by biomass burning aerosol particles during SAFARI 2000: a case study based on measured aerosol and cloud properties, J. Geophys. Res., 108, 8467, doi:10.1029/2002JD002315, 2003.
Klein, S. A. and Hartmann, D. L.: The seasonal cycle of low strati-form clouds, J. Climate, 6, 1587–1606, 1993.
Kleinman, L. I., Daum, P. H., Lee, Y.-N., Lewis, E. R., Sedlacek III, A. J., Senum, G. I., Springston, S. R., Wang, J., Hubbe, J., Jayne, J., Min, Q., Yum, S. S., and Allen, G.: Aerosol concentration and size distribution measured below, in, and above cloud from the DOE G-1 during VOCALS-REx, Atmos. Chem. Phys., 12, 207–223, doi:10.5194/acp-12-207-2012, 2012.
Kogan, Z. N., Kogan, Y. L., and Lilly, D. K.: Evaluation of sul-fate aerosols indirect effect in marine stratocumulus clouds using observation-derived cloud climatology, Geophys. Res. Lett., 23, 1937–1940, 1996.
Leaitch, W. R., Banic, C. M., Isaac, G. A., Couture, M. D., Liu, P. S. K., Gultepe, I., and Li, S.-M.: Physical and chemical observa-tions in marine stratus during the 1993 North Atlantic Regional Experiment: Factors controlling cloud drop number concentra-tions, J. Geophys. Res., 101, 29123–29135, 1996.
Li, W. J. and Shao, L. Y.: Mixing and water-soluble char-acteristics of particulate organic compounds in individual urban aerosol particles, J. Geophys. Res., 115, D02301, doi:10.1029/2009JD012575, 2010.
Lu, M.-L., Conant, W. C., Jonsson, H. H., Varutbangkul, V., Flagan, R. C., and Seinfeld, J. H.: The Marine Stra-tus/Stratocumulus Experiment (MASE): Aerosol-cloud relation-ships in marine stratocumulus, J. Geophys. Res., 112, D10209, doi:10.1029/2006JD007985, 2007.
Lu, M.-L., Feingold, G., Jonsson, H. H., Chuang, P. Y., Gates, H., Flagan, R. C., and Seinfeld, J. H.: Aerosol-cloud relationship in continental shallow cumulus, J. Geophys. Res., 113, D15201, doi:10.1029/2007JD009254, 2008.
Martin, G. M., Johnson, D. W., and Spice, A.: The measurement and parameterization of effective radius of droplets in warm stra-tocumulus clouds, J. Atmos. Sci., 51, 1823–1842, 1994. McFiggans, G., Artaxo, P., Baltensperger, U., Coe, H., Facchini, M.
C., Feingold, G., Fuzzi, S., Gysel, M., Laaksonen, A., Lohmann, U., Mentel, T. F., Murphy, D. M., O’Dowd, C. D., Snider, J. R., and Weingartner, E.: The effect of physical and chem-ical aerosol properties on warm cloud droplet activation, At-mos. Chem. Phys., 6, 2593–2649, doi:10.5194/acp-6-2593-2006, 2006.
Middlebrook, A. M., Murphy, D. M., and Thomson, D. S.: Ob-servations of organic material in individual marine particles at Cape Grim during the First Aerosol Characterization Experiment (ACE-1), J. Geophys. Res., 103, 16475–16483, 1998.
new analytical approach for size-resolved speciation of or-ganic compounds in atmospheric aerosol particles: Meth-ods and first results, J. Geophys. Res., 105, 4513–4527, doi:10.1029/1999JD901038, 2000.
Oppo, C., Bellandi, S., Innocenti, N. D., Stortini, A. M., Loglio, G., Schiavuta, E., and Cini, R.: Surfactant components of marine organic matter as agents for biogeochemical fractionation and pollutant transport via marine aerosols, Mar. Chem., 63, 235– 253, 1999.
Petters, M. D. and Kreidenweis, S. M.: A single parameter repre-sentation of hygroscopic growth and cloud condensation nucleus activity, Atmos. Chem. Phys., 7, 1961–1971, doi:10.5194/acp-7-1961-2007, 2007.
Petters, M. D. and Kreidenweis, S. M.: A single parameter repre-sentation of hygroscopic growth and cloud condensation nucleus activity – Part 2: Including solubility, Atmos. Chem. Phys., 8, 6273–6279, doi:10.5194/acp-8-6273-2008, 2008.
Platnick, S. and Twomey, S.: Determining the susceptibility of cloud albedo to changes in droplet concentration with the Ad-vanced Very High Resolution Radiometer, J. Appl. Meteor., 33, 334–347, 1994
Pratt, K. A. and Prather, K. A.: Aircraft measurements of vertical profiles of aerosol mixing states, J. Geophys. Res., 115, D11305, doi:10.1029/2009JD013150, 2010.
Pringle, K. J., Carslaw, K. S., Spracklen, D. V., Mann, G. M., and Chipperfield, M. P.: The relationship between aerosol and cloud drop number concentrations in a global aerosol microphysics model, Atmos. Chem. Phys., 9, 4131–4144, doi:10.5194/acp-9-4131-2009, 2009.
Remer, L. A., Kaufman, Y. J., Tanre, D., Mattoo, S., Chu, D. A., Martins, J. V., Li, R.-R., Ichoku, C., Levy, R. C., Kleidman, R. G., Eck, T. F., Vermote, E., and Holben, B. N.: The MODIS aerosol algorithm, products, and validation, J. Atmos. Sci., 62, 947–973, 2005.
Roberts, G., Mauger, G., Hadley, O., and Ramanathan, V.: North American and Asian aerosols over the eastern Pacific Ocean and their role in regulating cloud condensation nuclei, J. Geophys. Res., 111, D13205, doi:10.1029/2005JD006661, 2006.
Stevens, B. and Feingold, G.: Untangling aerosol effects on clouds and precipitation in a buffered system, Nature, 461, 607–613, 2009.
Swietlicki, E., Zhou, J., Covert, D. S., Hameri, K., Busch, B., Vakeva, M., Dusek, U., Berg, O. H., Widensohler, A., Aalto, P., Makela, P., Martinsson, B. G., Papaspiropoulos, G., Mentes, B., Frank, G., and Stratmann, F.: Hygroscopic properties of aerosol particles in the northeastern Atlantic during ACE-2, Tellus B, 52, 201–227, 2000.
Twohy, C. H., Petters, M. D., Snider, J. R., Stevens, B., Tahnk, W., Wetzel, M., Russell, L., and Burnet, F.: Evaluation of the aerosol indirect effect in marine stratocumulus clouds: droplet number, size, liquid water path, and direct radiative impact, J. Geophys. Res., 110, D08203, doi:10.1029/2004JD005116, 2005.
Twomey, S.: The nuclei of natural cloud formation, II: The super-saturation in natural clouds and the variation of cloud droplet concentration, Pure Appl. Geophys., 43, 243–249, 1959. Wang, J., Flagan, R. C., Seinfeld, J. H., Jonsson, H. H., Collins,
D. R., Russell, P. B., Schmid, B., Redemann, J., Livingston, J. M., Gao, S., Hegg, D. A., Welton, E. J., and Bates, D.: Clear-column radiative closure during ACE-Asia: Comparison of mul-tiwavelength extinction derived from particle size and composi-tion with results from Sun photometry, J. Geophys. Res., 107, 4688, doi:10.1029/2002JD002465, 2002.
Wang, J., Daum, P. H., Kleinman, L. I., Lee, Y. N., Schwartz, S. E., Springston, S. R., Jonsson, H., Covert, D., and Elleman, R.: Ob-servation of ambient aerosol particle growth due to in-cloud pro-cesses within boundary layers, J. Geophys. Res., 112, D14207, doi:10.1029/2006JD007989, 2007.