Rheological behavior of functional sugar-free guava preserves: Effect of the
addition of salts
Patrícia Aparecida Pimenta Pereira*, Vanessa Rios de Souza, Taísa Rezende Teixeira, Fabiana Queiroz,
Soraia Vilela Borges, João de Deus Souza Carneiro
Department of Food Science, Federal University of Lavras, 37200-000 Lavras, MG, Brazil
a r t i c l e
i n f o
Article history: Received 18 June 2012 Accepted 15 November 2012
Keywords: Texture profile Stress relaxation Uniaxial compression Principal components analysis Pearson correlation
a b s t r a c t
The addition of salts to carrageenan and locust bean gum gels functions to improve the characteristics of texture, thereby increasing gel strength. This effect is widely studied in gels of model systems but is studied to a lesser extent in complex systems, such as fruit preserves. The objective of this study was to evaluate the effect of adding salts on the rheological behavior of functional sugar-free guava preserves, as well as to correlate the rheological parameters. To this end, three types of texture properties were analyzed (texture profile, stress relaxation and uniaxial compression) in functional sugar-free guava preserves prepared with different concentrations of KCl and CaCl2salt. The analyses were performed
with a texturometer (Stable Micro Systems, Model TA - XT2i), and the parameters were analyzed using a Scott-Knott test at 5% probability, principal components analysis and Pearson correlation. CaCl2was
more effective for improving the characteristics of texture, especially gel strength (concentration near the F3: 0.33%), whereas KCl addition degraded gel strength. In the analysis of test relaxation, the Maxwell model parameters provided better discrimination between samples than the Peleg model parameters. Positive and negative correlations were observed, and the parameters of hardness, adhesiveness and elastic modulus ideal (E1) were the most correlated with other rheological parameters.
Ó2012 Elsevier Ltd. All rights reserved.
1. Introduction
All materials exhibit a response to an external force between the two extremities of ideal behavior: elastic solid and viscous liquid. An elastic solid is described by Hooke’s law, and an ideal viscous liquid obeys the Newton’s law (Guillet, 2010;Gunasekaran & Ak, 2000; Rychlewski, 1984). However, most food behaves as viscoelastic material; depending on the stress applied and the time scale, a solid body may have liquid phase properties and a liquid material can show solid body properties. The viscoelastic behavior of food has been widely studied in rheometers of sheared samples (tangential force), whereas the rheological parameters of tension or compres-sion (normal force) are being increasingly used to characterize the texture of food products. Furthermore, it is possible to characterize the product to low or high deformations irrespective of the type force applied (Ishihara, Nakauma, Funami, Odake, & Nishinari, 2011;
Karaman, Yilmaz, Dogan, Yetim, & Kayacier, 2011;Kumagai, Tashiro, Hasegawa, Kohyama, & Kumagai, 2009;Lu & Abbott, 1996). There-fore, the rheology is extremely important for the food industry, mainly in the development of product formulations in which there is total or partial replacement of sugar (Acosta, Víquez, & Cubero, 2008; Hracek, Gliemmo, & Campos, 2010), as is the case with preserves and jellies with low soluble solids content. An effective approach to the technological problems due to this substitution, such as the loss of sweet taste, desired viscous texture and increased water activity (Sandrou & Arvanitoyannis, 2000), requires a deep understanding of the functionality of ingredients in product development, quality control studies of shelf-life and determination of the texture of the food (Steffe, 1996, pp. 1e93).
In the preparation of jams and jellies with low soluble solids, low methoxyl pectin (LMP) is used, which forms gel in the presence of divalent metal ions (usually calcium) and does not necessarily require the presence of sugars (Ngouémazong et al., 2012). However, this type of pectin does not contribute the same rheo-logical characteristics of the conventional product. Therefore, it is necessary to use other gelling agents, such as carrageenan and locust bean gums (Moreira, Chenlo, & Torres, 2011;Williams, 2007), as well as sweeteners and bulking agents.
*Corresponding author. Tel.:þ55 35 3929 1391; fax:þ55 35 3829 1401. E-mail addresses:[email protected](P.A.P. Pereira), [email protected](V.R. de Souza),[email protected](T.R. Teixeira), [email protected]fla.br(F. Queiroz), [email protected]fla.br (S.V. Borges),joaodedeus@ dca.ufla.br(J.deD.S. Carneiro).
Contents lists available atSciVerse ScienceDirect
Food Hydrocolloids
j o u r n a l h o m e p a g e : w w w . e l s e v i e r . c o m / l o c a t e / f o o d h y d
0268-005X/$esee front matterÓ2012 Elsevier Ltd. All rights reserved.
http://dx.doi.org/10.1016/j.foodhyd.2012.11.014
AccordingGarcía-García and Totosaus (2008), the combination of carrageenan and locust bean gums are generally used in food production. Arda, Kara, and Pekcan (2009) demonstrated that synergistic peaks occur at the carrageenan/LBG ratio of 8/1 (maximum concentration of the mixture carrageenan/LBG gels in which introduces its best features) because locust bean gum modifies the texture characteristics of carrageenan gels, and these characteristics improve with the addition of salts, in particular KCl and CaCl2(García-García & Totosaus, 2008). The fractions
i
- andk
-carrageenan form thermoreversible gels by cooling in the presence of calcium ions or potassium (Huang, Kennedy, Li, Xu, & Xie, 2007), whereas, according toMichel, Mestdagh, and Axelos (1997), the addition of small potassium ion concentrations results in a greater improvement in carrageenan gels than do calcium ions.Montero and Pérez-Mateos (2002)report that cations (Caþ2>Kþ>Naþ)bind to the double helices of carrageenans, neutralizing the sulfated groups and affecting the balance of the attractive and repulsive forces between the molecules, which increases gel rigidity. These authors also report that optimum gel strength will occur at certain levels of each cation and, depending on the amount of salt added, gel formation can become strong enough to promote syneresis.
The bulking agents must have characteristics similar to those of sucrose, which include replacement of solid stability at different pH and temperature conditions, no aftertaste, contribution to color and interaction with starch and protein in a manner similar to that of sugar (Vissoto, Gomes, & Batista, 2005). Additionally, sweeteners should have no aftertaste and should be chemically stable with a low calorie sweetening power equal to or greater than that of sucrose, as well as being soluble, non-toxic or non-carcinogenic and economically feasible (Hanger, Lotz, & Lepeniotis, 1996).
Among the agents commonly used, we highlight polydextrose and FOS (fructooligosaccharides). Polydextrose actively improves food texture and operates as a thickener, stabilizer and humectant (Martínez-Cervera, Sanz, Salvador, & Fiszman, 2012;Ribeiro, Zimeri, Yildiz, & Kokini, 2003).Menezes (2011, p. 155) used low methoxyl pectin content (0%e1.008%), mixtures of xanthan gum, locust bean gum (1:1) (0%e0.4032%) and polydextrose (20.0%40.16%) in guava preserves with no added sugar and with prebiotics (FOS) and found that concentrations above 20 g polidextrose/100 g pulp decreased the hardness of guava preserves. The author attributed thisfinding to the contribution of polydextrose to soluble solids of the product, which is a determining factor for the end of cooking process (when the preserves reached 60 Brix). FOS, besides
serving as a bulking agent, is also considered as a functional ingredient because it is not absorbed in the small intestine and exerts a prebiotic effect on the intestinal habitat, which causes an increase in stool and normalization of stool frequency (increases the number of bacteria and/or activity of the number of bifidobacteria and lactic acid bacteria in the human gut) (Cherbut, 2002; Lobo, Colli, & Filisetti, 2006; Nyman, 2002; Roberfroid, 2007;Rodrigues et al., 2011;Rodríguez-Cabezas et al., 2010).
There are numerous sweeteners on the market, among which sucralose and thaumatin stand out. Sucralose is characterized by a lack of unpleasant aftertaste and a taste similar to but approxi-mately 600 times sweeter than sucrose. Sucralose has the advan-tage of remarkable stability, both at high temperatures and over a wide pH range (Rahn e Yaylayan, 2010). Because thaumatin is an intensely sweet protein (300 to 3000 times sweeter than sucrose) produced by plants (Menu-Bouaouiche et al., 2003), it is used in chewing gum, dairy products and pharmaceuticals (Daniell, Mellits, Faus, & Connerton, 2000). According toBayarri, Durán, and Costell (2004), high intensity sweeteners have no effect on product texture. In the literature, there are a large number of studies that examine the effects of added salts on gel characteristics in model systems (Chen, Liao, & Dunstan, 2002;Iglauer, Wu, Shuler, Tang, &
Goddard, 2011; Montero & Pérez-Mateos, 2002), but similar research on fruit preserves and jellies is scarce.
As such, the objective of this study was to evaluate the effect of adding salts on the rheological behavior of functional sugar-free guava preserves, as well as to correlate the rheological parameters.
2. Material and methods
2.1. Material
We used ripe guava Pedro Sato cultivars from a local market. They were processed in the Pilot Plant Processing Plant Products, Department of Food Science, Federal University of Lavras/MG.
The ingredients used were as follows: fructooligosaccharides (Beneo P95), thaumatin (Nutramax), sucralose (Nutramax), gum LBG (Danisco), carrageenan (Danisco), low methoxyl pectin (LMP) (Danisco), polydextrose (Litesse), citric acid monohydrate (Nuclear) and potassium sorbate (Vetec).
According National Agency of Sanitary Vigilance, for a food to be considered functional, the portion of the product ready for consumption must provide at least 3 g of FOS and/or polydextrose if the food is solid or 1.5 g of FOS and/or polydextrose if the food is liquid (Brasil, 2008). For functional sugar-free guava preserves, which has a solid portion equivalent to 40 g (DRC 359; December 23, 2003eBrasil, 2003), the minimum concentration of FOS and/or polydextrose required is 7.5%.Mesquita, Borges, Carneiro, Menezes, and Marques (2012), in studies on the degradation of FOS in sugar-free guava jam with added prebiotics found that in processing the product was a loss of 36.0% FOS.
2.2. Preparation of guava preserves and experimental design
The different formulations of guava preserves were processed in open stainless steel pots, according to the methodology proposed byMenezes (2011, p. 155). The mixture of pulp and polydextrose was heated to 45Brix, and then added gums (LBGþcarrageenan),
pectin LMP and salts previously homogenized under high stirring in water at 80C, and remained cooking to achieve a soluble solids
content of 50Brix. FOS (fructooligosaccharide) diluted 1:1 in water
at room temperature was added in this step. The process of cooking continued until a total soluble solids of 65Brix was obtained. Citric
acid, potassium sorbate and sweeteners were added at the end of the cooking process (diluted 1:1 in water at room temperature) to prevent degradation at the high temperature. Guava preserves were placed in packaging polypropylene transparent (volume: 402.0 cm3, height: 50.50 mm, diameter: 100.70 mm), with the filling per-formed at a high temperature (85C) and were then closed, poured,
and cooled to room temperature and stored in a chamber at 20C
for later analysis.
For all guava preserves prepared, the following percentages of ingredients were established: 60.0% pulp guava, 2.0% pectin LMP (35% degree of methoxylation), 0.23% locust bean gum (0.44% (w/ w) potassium, 0.1% (w/w) of calcium and 5.99 mg/kg of iron), 1.84% carrageenan (2.27% (w/w) potassium, 0.32% (w/w) calcium and 76.77 mg/kg of iron), 0.012% sucralose, 0.099% thaumatin, 17.71% FOS, 19.08% polydextrose, 0.2% citric acid and 0.05% potassium sorbate (all levels were determined in accordance with preliminary tests). The carrageenan used was composed of the mixture of kappa, iota and lambda carrageenan (food grade Danisco: Grinds-ted Carrageenan CL 350 H).
Was used a completely randomized design with three replica-tions for this study.
Table 1presents the percentages of salt added to the formula-tions of the functional sugar-free guava preserves.
2.3. Texture profile analysis
The characteristics of food surface texture are one of thefirst quality parameters that consumers evaluate, and therefore become critical to product acceptance even before it is put in the mouth. Texture is composed of a set of sensory attributes that are highly important, considering that they determine or influence the acceptance/rejection of the food (Funami, Ishihara, Nakauma, Kohyama, & Nishinari, 2012; Kotwaliwale, Bakane, & Verma, 2007;Mojet & Köster, 2005;Taniwaki, Hanada, & Sakurai, 2006).
Texture profile analysis (TPA) is a method to evaluate the sensory properties. The test consists of compressing the food (study sample) twice in a reciprocating motion to mimick the action of the mandible. Therefore, afirst compression and relaxation followed by a second compression are performed during testing. This test yields a graph of force versus time, from which the texture parameters are calculated (Bourne, 2002;Herrero et al., 2007;Honikel, 1998;Lau, Tang, & Paulson, 2000).
The texture profile analyses (TPA) were performed in penetra-tion mode under the following condipenetra-tions: pre-test speed of 1.0 mm/s, test speed of 1.0 mm/s, post-test speed of 1.0 mm/s, time interval between penetration cycles of 5.0 s, a distance of 20.0 mm and compression with a cylindrical probe of 6.0 mm diameter of the aluminum using the Stable Micro Systems Model TA-XT2i textur-ometer (Goldaming, England). The parameters analyzed were hardness, adhesiveness, cohesiveness and gumminess. The test was performed in triplicate. The analyses were conducted in the pack-aging containing the guava preserves (height: 50.50 mm, diameter: 100.70 mm).
2.4. Stress relaxation test
There are several mathematical models that can explain the behavior of viscoelastic food products, but the Maxwell and Peleg models are used most frequently to describe the behavior of gels and alimentary systems (Andrés, Zaritzky, & Califano, 2008;Bellido & Hatcher, 2009; Kampf & Nussinovitch, 1997; Khazaei & Mohammadi, 2009;Morales, Guerrero, Serra, & Gou, 2007).
The Maxwell model involves two simple elements combined in a series to represent different behaviors. These two elements are the ideal elastic element, which can be represented as a spring and has a behavior defined by elastic constantE, and the ideal viscous element, which is represented by a dashpot and has a behavior defined by its viscosity
h
(Campus et al., 2010).In the Maxwell model with a constant strain (ε0),
s
describes the tension applied froms
0 fors
(t) after a time t (Nobile, Chillo, Mentana, & Baiano, 2007), given as follows:sð
tÞ ¼ ε0E$exp
t
l
þEe
(1)
whereEis the elastic modulus of the material,Eeis the equilibrium elastic modulus and
l
is the relaxation time given byh
/E. Somefoods do not follow the Maxwell simplified viscoelastic model, and therefore the description of their behavior requires more complex models. An example of this case is the generalized Maxwell model, which consists of an infinite number of Maxwell models in parallel over a spring.
The stress relaxation curves (stress versus time) can be adjusted by means of Equation(2), which provides the viscoelastic param-eters of the generalized Maxwell model.
sð
tÞ ¼ ε0E1exp
t
l
1þE2exp t
l
2þ.þEe
(2)
whereE1,E2,.are the elastic modulus of the elastic body ideal,Eeis the equilibrium elastic modulus and
l
1,l
2,. are the relaxation times.The viscosity of element i can be calculated according to Equation(3):
h
i ¼ Eil
i (3)In the Peleg model, stress relaxation data can be interpreted in accordance with the stress normalized, according to Equation(4) (Peleg & Normand, 1983):
s
0ts
0sð
tÞ ¼ k1þk2t (4)where
s
(t) is the stress at any time during the test,s
0 is initial relaxation stress,k1andk2are constants. The reciprocalk1 repre-sents the initial decay rate, whereas 1/k2is the hypothetical value of the asymptotic normalized force that remains without relaxing (Rodríguez-Sandoval, Fernández-Quintero, & Cuvelier, 2009;Tang, Tung, & Zeng, 1998).The stress relaxation test was performed in a texturometer (Stable Micro Systems Model TA-XT2i). The samples were cut into cylindrical shapes of 2.0 cm in height and 2.0 cm in diameter and compressed to 5.0% original height with a speed of 1.0 mm/s. The deformation was kept constant for 10.0 min, which allowed the stress to reach equilibrium. During that time, the relaxation of tension was measured at a rate of 1.0 per second. A 7.0 cm diameter probe cylinder, which had been lubricated to eliminate the infl u-ence of friction between the sample and the equipment, was used. Three measurements were performed for each formulation. The nonlinear regression program R(2011)was used.
Determination of the Peleg model constants was also performed using the nonlinear regression program R(2011).
2.5. Measurement of the resistance to compression
Compression tests were performed in a texturometer (Stable Micro Systems Model TA-XT2i) using a 7.0 cm diameter probe cylinder. The samples were cut into cylindrical shapes of 2.0 cm in height and 2.0 cm in diameter and compressed to 80.0% original height with a speed of 1.0 mm/s.
From the force versus time/deformation curve, the following parameters were calculated: true rupture stress (
s
) and true rupture strain (ε) according to Equations (5) And (6) (Bayarri, Durán, & Costell, 2003;Bayarri, Rivas, Izquierdo, & Costell, 2007; Hamann, 1983;Hernández, Durán, & Costell, 1999):s
¼ Fh 0
D
hA0h0
(5)
ε¼ ln
h 0 h0
D
h
(6) Table 1
Percentages of salt added of the formulation of the functional sugar-free guava preserves.
Formulations CaCl2 KCl
F1 e e
F2 0.165% e
F3 0.33% e
F4 0.66% e
F5 e 0.165%
F6 e 0.33%
F7 e 0.66%
whereFis the rupture force,h0andA0are the initial height and cross-section area of the sample, respectively, and
D
his the change in height during compression.From the stress versus strain curves, the true rupture stress (
s
rup), the true rupture strain (deformation Hencky e εrup) and work of rupture (Wrup) were obtained. The true rupture stress is the point at which gel fracture occurs (yaxis) (maximum stress in the graphic tension versus deformation), and true rupture strain is the strain at the break of the sample (xaxis). The modulus of elasticity (Young’s moduluseE) was obtained from the slope of the linear part of the initial stressestrain curve using 2.0% deformation and the work of fracture (Wrup) was given by the area under the curve strength versus the distance from the rupture point.2.6. Data analysis
To compare formulations with different levels of salts, the ScotteKnott test at 5% probability was used. A better understanding of the differentiation between the samples became the purpose of the principal component analysis. Furthermore, Pearson’s correla-tion was used to correlate the rheological parameters. Data analysis was performed in softwareR (2011) (R Development Core Team) and Matlab (Matlab, version 7.5).
3. Results and discussion
3.1. Texture profile analysis
Table 2presents the mean texture profile analysis of functional sugar-free guava preserves with CaCl2or KCl. It was observed that all texture profile parameters were able to discriminate between samples, indicating a significant difference in all these parameters. Regarding the hardness parameter, the formulation with the addition of 0.165% CaCl2 (F2) had the highest value, and as the concentration of salt increased, hardness decreased. For KCl, the formulations with the salt had values of greater hardness than the formulation with 0% (F1), with the exception of F7. In the levels evaluated, it was observed that with an increasing KCl concentra-tion, hardness decreased. In their studies with solutions of pectin in various pHs and various concentrations of salts (sodium caseinate), Ambjerg-Pedersen and Jorgensen (1991)reported that the effect of cations depends on the concentration because the saturation of anionic groups at high concentrations destabilizes gel structure. Thrimawithana, Young, Dunstan, and Alany (2010), in a study on iota and kappa carrageenan in the presence of calcium chloride and potassium chloride, reported that this decline in hardness may be due to the inability of cations to form connections with the oxygen group and anhydrous sulfates groups of the adjacent disaccharide units of carrageenan, which reduces intermolecular association. These authors suggest that at certain concentrations of cations, partial gelatinization of the carrageenan gel makes the product less
hard. In studies on the use of banana peel in the preparation of banana preserves, Oliveira et al. (2009) found that consumers prefer a morefirm preserve.
Regarding adhesiveness, increasing the concentration of both KCl and CaCl2 decreased the value of this parameter (Table 2). Adhesiveness is a surface feature (Adhikari, Howes, Bhandari, & Truong, 2001; Besbes, Drira, Blecker, Deroanne, & Attia, 2009; Huang et al., 2007), and according toPons and Fiszman (1996), large deformation (as in the case of the TPA) is not recommended for the calculation of adhesiveness.
The cohesiveness of the rheological parameters is correlated with the properties of a food as it is swallowed, especially if it is in solid state (Ishihara et al., 2011; Lucas, Prinz, Agrawal, & Bruce, 2002). This measurement is calculated from the ratio between the area under the curve for strength versus time in the second compression cycle and the curve’s area in thefirst compression cycle (Bourne, 1982;Gujral, Kaur, Singh, & Sodhi, 2002), i.e., the lower the cohesiveness, the greater the disintegration of material in thefirst compression cycle (Extralab, 2010). In the present study, it was observed that increasing the concentration of CaCl2 decreases the cohesiveness, i.e., the product disintegrates more easily because the concentration of salt can cause partial gelatinization (Thrimawithana et al., 2010). Regarding formulations containing KCl, there were no differences from those with a CaCl2concentration of 0.33%. At a concentration of 0.66% KCl, the product had a higher average value of cohesiveness. This finding was not expected because this formulation, with lower hardness, disintegrated quickly. This event may have occurred because F7 contained more fluid, and when introduced into the container, the material tended to return to its initial state, making the area of the second compression cycle closest to the area of thefirst compression cycle. The areas of thefirst and second compression cycles of the formu-lation F7 areas were lower than those of the other formuformu-lations.
According toOliveira et al. (2009), gumminess determines the force required to chew a semi-solid food. The parameter of gumminess presented a higher value for the formulation with 0.165% CaCl2(F2), which indicates that this formulation was more rigid. At higher levels of CaCl2(F3 and F4), there was a decrease in gumminess. For formulations with KCl, at all concentrations added, gumminess was higher than in F1 (without added salts), except for formulation F7, in which a reduction in gumminess with increasing concentration of KCl was observed.Thrimawithana et al. (2010), in research on
k
- andi
-carrageenan gels in the presence of ions, found that depending on the concentration and type of salt used, the conditions can become insufficient to form a uniform gel matrix, which may explain the decrease in the parameters of cohesiveness and gumminess with increasing salt concentration.3.2. Stress relaxation test
When a constant load is applied to the materials, different relaxation behaviors can be observed in materials with different viscoelastic properties; ideal elastic materials do not relax, ideal viscous materials relax instantly, and viscoelastic solids gradually relax and reach an equilibrium (Li, Li, Wang, Özkan, & Mao, 2010; Steffe, 1992, pp. 300e384).
Fig. 1shows the stress versus time curves of the experimental data of different formulations of functional sugar-free guava preserves with different levels of KCl or CaCl2. The graphic was made with thefirst 40 points of the stress relaxation test only to show the behavior of the stress of each formulation.
Fig. 1illustrated that addition of 0.33% CaCl2(F3) increased the stress values. However, higher concentrations of salt decreased the stress, but values are greater for the stress of the formulation without added salt (F1). The addition of 0.165% KCl (F5) to guava
Table 2
Texture profile analysis of functional sugar-free guava preserves with CaCl2or KCl.
Formulations Hardness (N)
Adhesiveness (N s)
Cohesiveness Gumminess (N) F1 (no added salts) 2.870.4d 68.480.4b 0.390.01b 1.170.2b F2 (0.165% CaCl2) 6.930.4a 116.050.3c 0.390.01b 2.780.1a F3 (0.33% CaCl2) 6.230.2b 97.520.2c 0.370.02c 2.320.1b F4 (0.66% CaCl2) 5.860.3b 80.300.3b 0.370.02c 2.140.4b F5 (0.165% KCl) 4.600.5c 67.430.2b 0.360.01c 1.640.1c F6 (0.33% KCl) 4.040.2c 42.590.2a 0.350.01c 1.630.2c F7 (0.66% KCl) 1.720.2e 49.520.1a 0.450.01a 0.850.2d
Means followed by same letter in columns do not differ statistically among them-selves by ScotteKnott test at 5% probability.
preserves caused a stress increase, but after that, the concentration stress decreased to values lower than F1.
Fig. 2shows the linearized relaxation curves of Peleg’s model (Equation (4)) for different formulations of functional sugar-free guava preserves with different levels of KCl or CaCl2. The graphic was made with thefirst 30 points of the linearized relaxation curves of Peleg’s model only to observe the behavior of each formulation. According Tang et al. (1998), Bhattacharya, Narasimha, and Bhattacharya (2006), Sozer and Dalgic (2007), Sozer, Kaya, and Dalgic (2008)andRodríguez-Sandoval et al. (2009), application of Peleg’s model to describe the relaxation data is a simple way to describe and compare the stress relaxation with the literature data on rheology because it uses only two parameters: the initial decay rate (1/k1) and the normalized stress (1/k2). Thek1parameter is a measure of the ease with which the material deforms, i.e., higher values ofk1suggest a harder material, which dissipates less energy, and therefore requires more force to be compressed (Guo, Castell-Perez, & Moreira, 1999; Rodríguez-Sandoval et al., 2009). The parameterk2 represents the degree of relaxation of the material (Bellido & Hatcher, 2009; Guo et al., 1999; Rodríguez-Sandoval et al., 2009). AccordingPeleg (1980), 1/k2represents the equilib-rium conditions of the material, i.e., the portion of the material that remains without relaxing at equilibrium.Fig. 2clearly shows that the linearized relaxation curves of guava preserves are too close to discriminate between them (ScotteKnott test at 5% probability was performed (data not shown), and no significant difference was found), which means that Peleg’s model is not suitable for formu-lation discrimination.
Table 3presents the average values of viscoelastic parameters of Maxwell model for functional sugar-free guava preserves with different levels of KCl or CaCl2. This model was chosen because there was no considerable improvement (upR2) when generalized model of Maxwell’s model of two elements and spring in parallel were tested.
It was observed that, contrary to Peleg’s model, Maxwell’s model was able to discriminate between the formulations because there was significant difference between formulations (Table 3) in all parameters of model.
The parameters of elasticity (EeandE1) quantify the rigidity of the material (Peleg, 1987; Rodríguez-Sandoval et al., 2009). The formulation F3 (0.33% CaCl2) had a larger average Ee and E1 (Table 3), which indicates that functional sugar-free guava preserves with 0.33% CaCl2 are more rigid. Additionally, the formulations with added KCl showed lower values for these parameters, which indicates that these are less rigid.
The use of 0.165% KCl does not significantly alter the relaxation time (
l
) of functional sugar-free guava preserves in relation formulation without salt (F1). However, the increase of salt concentration caused the relaxation time to increase and then reach a plateau. For CaCl2, the addition of 0.165% always led to a significant increase in the relaxation time and stabilization at higher concentrations. AccordingNobile et al. (2007),Bhattacharya (2010), and Campus et al. (2010), lower relaxation time values indicate that the material is less elastic and lessfirm.The viscosity (
h
) behaved similarly to the parameters of elas-ticity. Larger values were observed for formulation F3 (0.33% CaCl2), which indicates that this behavior is stronger than the others. There was no significant difference in the viscosity of the formulation without added salt (F1) and those with KCl (F5, F6 and F7).3.3. Measurement of the resistance to compression
Table 4shows the averages of the resistance to compression parameters (true rupture stress, true rupture strain, modulus of elasticity and work of rupture) for functional sugar-free guava preserves with added salts. Significant differences in all parameters
Fig. 2.Linearized relaxation curves of Peleg’s model of different formulations of functional sugar-free guava preserves with different levels of KCl or CaCl2.
Table 3
Viscoelastic parameters of Maxwell’s model for functional sugar-free guava preserves added salts.
Formulations Ee(Pa) E1(Pa) l(s) h(Pa s) F1 (no added salts) 52.390.1b 21.280.3c 105.130.7b 2237.170.4d F2 (0.165% CaCl2) 52.050.3b 33.640.4b 140.220.2a 4717.000.7b F3 (0.33% CaCl2) 74.290.9a 42.850.3a 132.060.1a 5658.770.3a F4 (0.66% CaCl2) 31.480.1c 25.190.2c 159.070.9a 4006.970.3c F5 (0.165% KCl) 46.770.3b 22.95
0.5c 79.40
0.3b 1822.23
0.9d F6 (0.33% KCl) 16.650.7c 10.810.1d 143.720.3a 1553.611.3d F7 (0.66% KCl) 20.170.2c 12.510.2d 121.470.1a 1519.591.1d
Means followed by same letter in columns do not differ statistically among themselves by ScotteKnott test at 5% probability.
Fig. 1.Experimental stress versus time curves of different formulations of functional sugar-free guava preserves with different levels of KCl or CaCl2.
Table 4
Resistance to compression parameters analysis for functional sugar-free guava preserves with added salts.
Formulations srup(kPa) εrup E(kPa) Wrup(kJ/m2) F1 (no added salts) 25.350.3d 0.290.6b 47.680.2b 3.670.1c F2 (0.165% CaCl2) 41.550.9c 0.281.1b 82.130.6a 5.200.1c F3 (0.33% CaCl2) 74.410.1b 0.530.2a 80.820.2a 19.360.2b F4 (0.66% CaCl2) 88.580.4a 0.510.8a 37.100.3c 24.670.5a F5 (0.165% KCl) 39.170.9c 0.240.5b 59.200.1b 5.740.2c F6 (0.33% KCl) 9.441.3e 0.220.2b 16.970.1d 2.750.1c F7 (0.66% KCl) 18.120.6d 0.290.3b 53.430.5b 2.980.9c
Means followed by same letter in columns do not differ statistically among them-selves by ScotteKnott test at 5% probability.
analyzed were able to discriminate between the samples of the functional sugar-free guava preserves with added salts.
True rupture stress (
s
rup) is defined as the stress required to break the food matrix (Cunha, 2002, p. 117). According toMarudova and Jilov (2003), higher true rupture stress pre-supposes a more elastic behavior. It is observed that there was no significant differ-ence in the value of true rupture stress between the formulations F2 (0.165% CaCl2) and F5 (0.165% KCl). The formulations with the addition of CaCl2showed the highest mean, which indicates that the addition of calcium chloride caused guava preserves to strengthen. When using low methoxyl pectin, the addition of Ca2þis necessary because this type of pectin forms gel in the middle of zones of junction between the free carboxyl and Ca2þand is
sup-plemented by hydrogen bonds (Fiszman, 1989). Depending on the type of fruit used, it may not be necessary to add calcium. Such is the case with calcium-rich guava, accordingEl-Buluk, Babiker, and El-Tinay (1997). However, as noted in this study, the formulation without the addition of CaCl2(F1) had a lower true rupture stress, i.e., were less strong, than those with addition of CaCl2(F2, F3, F4). The formulation F6 (0.33% KCl) showed the lowest true rupture stress that the formulation F1 and F7, and F7 did not differ from the formulation without salts (F1).Marudova and Jilov (2003)noted that in low methoxyl pectin gels with added monovalent cations, the true rupture stress was lower, which made the gels become brittle. These authors suggest that the decreased true rupture stress was due to the decrease in cross links between pectin chains influenced by the addition of these salts. This increase in true rupture stress with increasing CaCl2concentration may be due to interaction with the calcium in both pectin and carrageenan with the resulting increase in gel strength. This result occurs because calcium carrageenan induces conformational changes in gel form (MacArtain, Jacquier, & Dawson, 2003) and induces gel formation of pectin LMP (Fiszman, 1989).Michel et al. (1997)studied the phase diagram of carrageenan in the presence of sodium, copper, potas-sium and calcium. In the case of divalent cations (Cu2þand Ca2þ),
these authors found that at low concentrations of these (<0.02 M) at all concentrations of carrageenan studied, there is gel formation. They also found that the addition of cations above a critical value does not affect the overall viscoelasticity (G0) of the system and
contributes to only some heterogeneity in the gel.Lai, Wong, and Lii (2000)also studied the effects of calcium on carrageenan gum and reported that there was a decrease in gel strength at a calcium concentration above 0.5 M, which suggests that this decrease was due to syneresis.
In experiments on carrageenan gum system with sodium, potassium and calcium,Takemasa, Chiba, and Date (2001)observed that the after system gelation with calcium showed a high modulus of elasticity. This system was also characterized by a low stress optical coefficient, which indicates low anisotropy of the polymer chains and little reorientation of these chains caused by mechanical deformation of the gel networks. According to MacArtain et al. (2003), these results indicate that calcium induces a high increase in branching during the gelation of the carrageenan, most likely due to aggregation after cooling coil.
True rupture strain (εrup) indicates the brittleness of the food’s texture, i.e., the extent to which the product can be deformed without tearing (Cunha, 2002, p. 117). Materials with high true rupture stress and true rupture strain are rigid and strong, whereas materials with high true rupture stress but with low values of true rupture strain are hard and brittle. Formulations F3 (0.33% CaCl2) and F4 (0.66% CaCl2) differed statistically with respect to true rupture strain of the other formulations showing higher mean values (0.53 and 0.51, respectively). The increase in KCl concentration did not affect the true rupture strain of guava preserves.Yoo et al. (2009) studied the characteristics of enzymatically deesterified pectin gels
produced in the presence of monovalent ionic salts and found that the gelatinization depended on the degree of methoxylation of the pectin and that the pectin gels produced with 0.2 M KCl were brittle. Gels with high values of elastic modulus (E) are more rigid (Fraeye et al., 2010). Formulations F2 (0.165% CaCl2) and F3 (0.33% CaCl2) had higher average modulus of elasticity and were not significantly different. However, F2 was rigid and brittle, and when the level of calcium was duplicated (F3), the gel was hard, but strong. AccordingFraeye et al. (2010)in studies with pectin with different degrees of methoxylation of the concentration, an increase of Ca2þ
leads to an increase in the modulus of elasticity, which makes more rigid gel until it reaches a plateau.Dunstan et al. (2001)reported that the concentration of salt (KCl) solution containing carrageenan gum and locust bean gum causes the modulus to increase to a maximum and then decrease. This result occurs because there is an increased rigidity of the resulting three dimensional networks and syneresis (Cardenas, Goycoolea, & Rinaudo, 2008).
The work of rupture, which is the parameter which indicates the energy required to induce rupture of gel (Roopa & Bhattacharya, 2009), showed values between 2.75 kJ/m2 and 24.67 kJ/m2. The guava preserve with 0.66% CaCl2(F4) had a higher work of rupture. The formulation with KCl did not differ among them in that respect. Roopa and Bhattacharya (2009)observed that in alginate gels, the concentration of CaCl2causes the energy of rupture (Wrup) to increase.
3.4. Principal component analysis
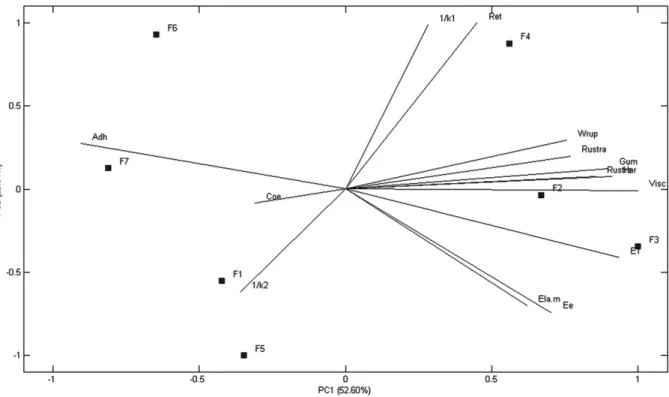
The principal components analysis was performed to obtain an overview about the behavior of salts on the rheological properties of functional sugar-free guava preserves (Fig. 3).
Principal component analysis (PCA) reduces a large number of variables to a few orthogonal variables called principal components (PC), which describe the largest covariance in the data analyzed (Lu et al., 2011). Variables found close to one another in pairs or groups show a positive correlation (Fredriksson, Silverio, Andersson, Eliasson, & Aman, 1998). The first principal component (PC1) explains 52.60%, and the second (PC2) explains 20.84% of the variance of the model. We observed two distinct groups. One consisted of the formulation F1 (without added salts) and formu-lations with KCl (F5 e0.165%, F6e 0.33% and F7e0.66%), and another contained the formulations with CaCl2(F2e0.165%, F3e 0.33% and F4e 0.66%), the latter being positively influenced by most of the rheological parameters.
3.5. Correlation between the rheological properties
Pearson’s correlation coefficients between the different rheo-logical properties of the functional sugar-free guava preserves with/without added salt are shown inTable 5.
Hardness (Har) was negatively correlated with the adhesiveness (Adh) (in absolute value) ( 0.83,p<0.05) and initial decay rate (1/ k1) ( 0.84,p<0.05) and positively with the gumminess (Gum) (0.99,p<0.01), the elastic moduli of the elastic body ideal (E1) (0.82,p<0.05) and the viscosity (
h
) (0.84,p<0.05).Goldner, Pérez, Pilosof, and Armada (2012) obtained opposite results for the correlation of hardness with the adhesiveness studies on cooked tubers because the texture profile analysis simulates mastication, and therefore requires large deformations (20%e50%) (Huang et al., 2007). These strains cause the sample to collapse, and so it is not suitable for the calculation of certain parameters, such as adhe-siveness (Pons & Fiszman, 1996) because this parameter is a surface characteristic (Adhikari et al., 2001; Besbes et al., 2009; Huang et al., 2007). According to the observations in this study, the increase of 1/k1is related to the softening and this occurs because materials with higher 1/k1dissipate more energy and are thereforesofter (Guo et al., 1999; Rodríguez-Sandoval et al., 2009). The gumminess determines the force required to chew a semi-solid food and is calculated through HardnessCohesiveness (Oliveira et al., 2009), i.e., the higher the hardness, the greater the gummi-ness, which confirms the results obtained. In this study, it was found that as the hardness increased, the elastic modulus of the elastic body ideal (E1) increased. According toPeleg (1980), the elastic moduli is a parameter that can be used to measure the hardness of a material, such that samples with higher values of elastic moduli are harder materials. The increase in the hardness of viscoelastic materials causes the viscosity to increase. Such a result was reported byRodríguez-Sandoval et al. (2009), which found that materials with higher hardness have greater relaxation times and thus higher viscosities.
Adhesiveness (Adh) was negatively correlated with the gummi-ness (Gum) ( 0.84,p<0.05), the elastic moduli of the elastic body ideal (E1) ( 0.87,p<0.05), the viscosity (
h
) ( 0.90,p<0.01), the modulus of elasticity (E) ( 0.80,p<0.05) and the work of rupture (Wrup) ( 0.80,p<0.05). As previously mentioned, the adhesiveness, a surface feature, the use of large deformations is not appropriate for calculation the parameter. According Borde, Bergstrand, Gunnarsson, and Larsson (2010)for the calculation of this param-eter should be used small deformations (around 2.0%) and long contact times with the sample probe (approximately 300 s).Gumminess (Gum) was positively correlated with the elastic moduli of the elastic body ideal (E1) (0.78, p < 0.05) and the viscosity (
h
) (0.84,p<0.05). Thisfinding is consistent with other studies (Bellido & Hatcher, 2009;Oliveira et al., 2009;Peleg, 1980;Fig. 3.Principal components analysis for rheological parameters of functional sugar-free guava preserves where: Coe: cohesiveness; Adh: adhesiveness; Rustre: True rupture stress; Ret: relaxation time; Gum: gumminess; Har: hardness; Rustra: True rupture strain; Visc: viscosity; Ela.m: modulus of elasticity;Wrup: work of rupture;Ee: equilibrium elastic moduli;E1: elastic moduli of the elastic body ideal; 1/k1: initial decay rate; 1/k2: hypothetical value of the asymptotic normalized force.
Table 5
Pearson’s correlation coefficients between the rheological properties.
Har Adh Coh Gum Ee E1 l h 1/k1 k2 srup εrup E Wrup
Har 1
Adh 0.83* 1
Coh 0.57 0.15 1
Gum 0.99** 0.84* 0.50 1
Ee 0.52 0.71 0.30 0.48 1
E1 0.82* 0.87* 0.32 0.78* 0.78* 1
l 0.41 0.23 0.07 0.47 0.32 0.26 1
h 0.84* 0.90** 0.22 0.84* 0.66 0.97** 0.46 1
1/k1 0.84* 0.02 0.57 0.22 0.74 0.66 0.95** 0.46 1
k2 0.45 0.59 0.14 0.56 0.07 0.43 0.70 0.65 0.36 1
srup 0.51 0.01 0.70 0.47 0.11 0.28 0.66 0.31 0.65 0.20 1
εrup 0.47 0.45 0.10 0.41 0.36 0.78* 0.49 0.75 0.31 0.37 0.44 1
E 0.46 0.80* 0.21 0.49 0.77* 0.66 0.20 0.66 0.75 0.27 0.41 0.26 1
Wrup 0.46 0.80* 0.57 0.21 0.49 0.77* 0.66 0.20 0.66 0.18 0.27 0.33 0.26 1
*p<0.05, **p<0.01.
Har: hardness; Adh: adhesiveness (absolute value); Coh: cohesiveness; Gum: gumminess;Ee: equilibrium elastic moduli;E1: elastic moduli of the elastic body ideal; l: relaxation time;h: viscosity; 1/k1: initial decay rate;k2: hypothetical value of the asymptotic normalized force;srup: true rupture stress;εrup: true rupture strain;E: modulus of elasticity;Wrup: work of rupture.
Rodríguez-Sandoval et al., 2009), which report that materials with higher elastic moduli of the elastic body ideal and viscosity are harder, and being gummy, require more strength to chew, which is closely correlated with these parameters.
The equilibrium of the elastic moduli (Ee) was positively corre-lated with the elastic moduli of the elastic body ideal (E1) (0.78, p<0.05) and the modulus of elasticity (E) (0.77,p<0.05).EeandE1 parameters are closely related because are the parameters of the elastic element in Maxwell’s model (Bellido & Hatcher, 2009;Kaur, Singh, Sodhi, & Gujral, 2002). The higher solid behavior of material with the highest values of these parameters and the modulus of elasticity (E) is related to the rigidity of the material (Fraeye et al., 2010).
The elastic moduli of the elastic body ideal (E1) are positively correlated with the viscosity (
h
) (0.97,p<0.01), the true rupture strain (εrup) (0.78,p<0.05) and the work of rupture (Wrup) (0.77, p<0.05). Viscosity is calculated according to Equation (3). The greater theE1, the higher theh
. AccordingFraeye et al. (2010), the higher the solid behavior of the material, the higher the true rupture strain.Roopa and Bhattacharya (2009)found that greater the Wrup, greater the energy required to rupture the material, which indicates that the material has solid behavior.Relaxation time (
l
) was negatively correlated with the initial decay rate (1/k1) ( 0.95,p<0.01). Thatfinding is in line with the literature (Bhattacharya, 2010;Campus et al., 2010;Guo et al., 1999; Nobile et al., 2007; Rodríguez-Sandoval et al., 2009), in which stronger materials have longer relaxation and higherk1values.4. Conclusions
The rheological properties of functional sugar-free guava preserves varied according to the type and concentration of added salts. CaCl2was more effective for improving the characteristics of texture, especially gel strength (concentration near the F3: 0.33%), whereas KCl addition degraded gel strength. In testing the param-eters of relaxation, Maxwell’s model discriminated better between the samples than the Peleg’s model parameters. Positive and negative correlations were observed, and the parameters of hard-ness, adhesiveness and elastic moduli of the elastic body ideal (E1) were the most correlated with the other rheological parameters.
Acknowledgment
The authors are grateful to FAPEMIG, CAPES and CNPq for its financial support and the donation of sweeteners by NutramaxÒ
.
References
Acosta, O., Víquez, F., & Cubero, E. (2008). Optimisation of low calorie mixed fruit jelly by response surface methodology.Food Quality and Preference, 19, 79e85. Adhikari, B., Howes, T., Bhandari, B. R., & Truong, V. (2001). Stickiness in foods: mechanisms and test methods e a review. International Journal of Food Properties, 4(1), 1e33.
Ambjerg-Pedersen, H. C., & Jorgensen, B. B. (1991). Influence of pectin on the stability of casein solution studied in dependence of varying pH and salt concentration.Food Hydrocolloids, 5(4), 323e328.
Andrés, S. C., Zaritzky, N. E., & Califano, A. N. (2008). Stress relaxation characteristics of low-fat chicken sausages made in Argentina.Meat Science, 79, 589e594. Arda, E., Kara, S., & Pekcan, Ö. (2009). Synergistic effect of the locust bean gum on
the thermal phase transitions ofk-carrageenan gels.Food Hydrocolloids, 23, 451e459.
Bayarri, S., Durán, L., & Costell, E. (2003). Compression resistance, sweetener’s diffusion and sweetness of hydrocolloids gels.International Dairy Journal, 13, 643e653.
Bayarri, S., Durán, L., & Costell, E. (2004). Influence of sweeteners on the viscoelasticity of hydrocolloids gelled systems.Food Hydrocolloids, 18, 616e619. Bayarri, S., Rivas, I., Izquierdo, L., & Costell, E. (2007). Influence of texture on the temporal perception of sweetness of gelled systems. Food Research International, 40, 900e908.
Bellido, G. G., & Hatcher, D. W. (2009). Stress relaxation behaviour of yellow alkaline noodles: effect of deformation history.Journal of Food Engineering, 93, 460e467. Besbes, S., Drira, L., Blecker, C., Deroanne, C., & Attia, H. (2009). Adding value to hard date (Phoenix dactyliferaL.): composition, functional and sensory characteristics of date jam.Food Chemistry, 112(2), 406e411.
Bhattacharya, S. (2010). Stress relaxation behaviour of moth beanflour dough: product characteristics and suitability of model.Journal of Food Engineering, 97, 539e546.
Bhattacharya, S., Narasimha, H. V., & Bhattacharya, S. (2006). Rheology of corn dough with gum arabic: stress relaxation and two-cycle compression testing and their relationship with sensory attributes.Journal of Food Engineering, 74, 89e95.
Borde, A., Bergstrand, A., Gunnarsson, C., & Larsson, A. (2010). Osmotic-driven mass transport of water: impact on the adhesiveness of hydrophilic polymers.Journal of Colloid and Interface Science, 341, 255e260.
Bourne, M. C. (1982).Food texture and viscosity. New York: Academic Press. Bourne, M. C. (2002).Food texture and viscosity: Concept and measurement. New
York: Academic Press.
Brasil. (2003). Resolução RDC n 359, de 23 de Dezembro de 2003. Aprova Regulamento Técnico de Porções de Alimentos Embalados para Fins de Rotulagem Nutricional.
Brasil. (2008).Alimentos com alegações de propriedades funcionais e ou de saúde, novos alimentos/ingredientes, substâncias bioativas e probióticos: lista de alegações de propriedade funcional aprovadas. Ministério da Saúde. Agência Nacional de Vigilância Sanitária.
Campus, M., Addis, M. F., Cappuccinelli, R., Porcu, M. C., Pretti, L., Tedde, V., et al. (2010). Stress relaxation behaviour and structural changes of muscle tissues from Gilthead Sea Bream (Sparus aurataL.) following high pressure treatment. Journal of Food Engineering, 96, 192e198.
Cardenas, A., Goycoolea, F. M., & Rinaudo, M. (2008). On the gelling behaviour of ‘nopal’(Opuntiaficus indica) low methoxyl pectin.Carbohydrate Polymers, 73(2), 212e222.
Chen, Y., Liao, M. L., & Dunstan, D. E. (2002). The rheology of Kþ-k-carrageenan as a weak gel.Carbohydrate Polymers, 50, 109e116.
Cherbut, C. (2002). Inulin and oligofructose in the dietaryfibre concept.British Journal of Nutrition, 87, S159eS162.
Cunha, C. R. (2002).Efeito do uso de retentados de baixo fator de concentração no rendimento, proteólise e propriedades viscoelásticas de queijo minas frescal de reduzido teor de gordura. Dissertação (Mestrado em Engenharia de Alimentos)eUniversidade Estadual de Campinas, Campinas.
Daniell, S., Mellits, K. H., Faus, I., & Connerton, I. (2000). Refolding the sweet-tasting protein thaumatin II from insoluble inclusion bodies synthesized inEscherichia coli.Food Chemistry, 71, 105e110.
Dunstan, D. E., Chen, Y., Liao, M. L., Salvatore, R., Boger, D. V., & Prica, M. (2001). Structure and rheology of the k-carrageenan/locust bean gum gel. Food Hydrocolloids, 15, 475e484.
El-Buluk, R. E., Babiker, E. F. E., & El-Tinay, A. H. (1997). Changes in chemical composition of guava fruits during development and ripening.Food Chemistry, 59(3), 395e399.
Extralab, B. (2010).Programa Exponent Lite Express: versão 5.0. Jarinú: TEE32. Fiszman, S. M. (1989). Propiedades funcionales de los hidrocoloides
polisacarídicos-mecanismos de gelificacíon.Revista de agroquímica y tecnología de alimentos, 29(4), 415e429.
Fraeye, I., Colle, I., Vandevenne, E., Duvetter, T., Buggenhout, S. V., Moldenaers, P., et al. (2010). Influence of pectin structure on texture of pectin-calcium gels. Innovative Food Science and Emerging Technologies, 11, 401e409.
Fredriksson, H., Silverio, J., Andersson, R., Eliasson, A. C., & Aman, P. (1998). The infl u-ence of amylose and amylopectin characteristics on gelatinization and retrogra-dation properties of different starches.Carbohydrate Polymers, 35, 119e134. Funami, T., Ishihara, S., Nakauma, M., Kohyama, K., & Nishinari, K. (2012). Texture
design for products using food hydrocolloids.Food Hydrocolloids, 26, 412e420. García-García, E., & Totosaus, A. (2008). Low-fat sodiumereduced sausages: effect of the interaction between locust bean gum, potato starch andk-carrageenan by a mixture design approach.Meat Science, 78, 406e413.
Goldner, M. C., Pérez, O. E., Pilosof, A. M. R., & Armada, M. (2012). Comparative study of sensory and instrumental characteristics of texture and color of boiled under-exploited Andean tubers.Food Science and Technology, 47, 83e90. Guillet, A. (2010). On the non hookean elastic behavior of iron whiskers at high
strain.Materials Letters, 64, 2148e2150.
Gujral, H. S., Kaur, A., Singh, N., & Sodhi, N. S. (2002). Effect of liquid whole egg, fat and textured soy protein on the textural and cooking properties of raw and baked patties from goat meat.Journal of Food Engineering, 53, 377e385. Gunasekaran, S., & Ak, M. M. (2000). Dynamic oscillatory shear testing of
foods-selected applications.Trends in Food Science & Technology, 11, 115e127. Guo, Z., Castell-Perez, M. E., & Moreira, R. G. (1999). Characterization of masa and
low-moisture corn tortilla using stress relaxation methods.Journal of Texture Studies, 30, 197e215.
Hamann, D. D. (1983). Structural failure in solid foods. In M. Peleg, & E. B. Bagley (Eds.), Physical properties of foods(pp. 351e383). Westport, CT: AVI Publishing Inc. Hanger, L. Y., Lotz, A., & Lepeniotis, S. (1996). Descriptive profiles of selected high
intensity sweeteners (HIS), HIS blends, and sucrose.Journal of Food Science, 61, 456e464.
Hernández, M. J., Durán, L., & Costell, E. (1999). Influence of composition on mechanical properties of strawberry gels. Compression test and texture profile analysis.Food Science and Technology International, 5(1), 79e87.
Herrero, A. M., Ordónez, J. A., Avila, R., Herranz, B., Hoz, L., & Cambero, M. I. (2007). Breaking strength of dry fermented sausages and their correlation with texture profile analysis (TPA) and physico-chemical characteristics.Meat Science, 77, 331e338.
Honikel, K. O. (1998). Reference methods for the assessment of physical characteristics of meat.Meat Science, 49, 447e457.
Hracek, V. M., Gliemmo, M. F., & Campos, C. A. (2010). Effect of steviosides and system composition on stability and antimicrobial action of sorbates in acidified model aqueous systems.Food Research International, 43, 2171e2175. Huang, M., Kennedy, J. F., Li, B., Xu, X., & Xie, B. J. (2007). Characters of rice starch gel
modified by gellan, carrageenan and glucomannan: a texture profile analysis study.Carbohydrate Polymers, 69(3), 411e418.
Iglauer, S., Wu, Y., Shuler, P., Tang, Y., & Goddard, W. A., III (2011). Dilute iota- and kappa-carrageenan solution with high viscosities in high salinity brines.Journal of Petroleum Science and Engineering, 75, 304e311.
Ishihara, S., Nakauma, M., Funami, T., Odake, S., & Nishinari, K. (2011). Viscoelastic and fragmentation characters of model bolus from polysaccharide gels after instrumental mastication.Food Hydrocolloids, 25, 1210e1218.
Kampf, N., & Nussinovitch, A. (1997). Rheological characterization ofk-carrageenan soy milk gels.Food Hydrocolloids, 11(3), 261e269.
Karaman, S., Yilmaz, M. T., Dogan, M., Yetim, H., & Kayacier, A. (2011). Dynamic oscillatory shear properties of O/W model system meat emulsions: linear viscoelastic analysis for effect of temperature and oil concentration on protein network formation.Journal of Food Engineering, 107, 241e252.
Kaur, L., Singh, N., Sodhi, N. S., & Gujral, H. S. (2002). Some properties of potatoes and their starches I. Cooking, textural and rheological properties of potatoes. Food Chemistry, 79, 177e181.
Khazaei, J., & Mohammadi, N. (2009). Effect of temperature on hydration kinetics of sesame seeds (Sesamum indicumL.).Journal of Food Engineering, 91, 542e552. Kotwaliwale, N., Bakane, P., & Verma, A. (2007). Changes in textural and optical
properties of oyster mushroom during hot air drying. Journal of Food Engineering, 78, 1207e1211.
Kumagai, H., Tashiro, A., Hasegawa, A., Kohyama, K., & Kumagai, H. (2009). Relationship betweenflow properties of thickener solutions and their velocity through the pharynx measured by the ultrasonic pulse Doppler method.Food Science and Technology Research, 15, 203e210.
Lai, V. M. F., Wong, P. A.-L., & Lii, C.-Y. (2000). Effects of cation properties on sol-gel transition and gel properties of kappa carrageenan.Journal of Food Science, 65(8), 1332e1337.
Lau, M. H., Tang, J., & Paulson, A. T. (2000). Texture profile and turbidity of gellan/ gelatin mixed gels.Food Research International, 33, 665e671.
Li, Q., Li, D., Wang, L. J., Özkan, N., & Mao, Z.-H. (2010). Dynamic viscoelastic properties of sweet potato studied by dynamic mechanical analyser. Carbohydrate Polymers, 79, 520e525.
Lobo, A. R., Colli, C., & Filisetti, T. M. C. C. (2006). Fructooligosaccharides improve bone mass and biomechanical properties in rats.Nutrition Research, 26, 413e420.
Lu, R., & Abbott, J. A. (1996). A transient method for determining dynamic viscoelastic properties of solid food.Transactions of the ASAE, 39, 1461e1467. Lu, Z. H., Yada, R. Y., Liu, Q., Bizimungu, B., Murphy, A., Koeyer, D., et al. (2011).
Correlation of physicochemical and nutritional properties of dry matter and starch in potatoes grown in different locations.Food Chemistry, 126, 1246e1253. Lucas, P. W., Prinz, J. F., Agrawal, K. R., & Bruce, I. C. (2002). Food physics and oral
physiology.Food Quality and Preference, 13, 203e213.
MacArtain, P., Jacquier, J. C., & Dawson, K. A. (2003). Physical characteristics of calcium inducedk-carrageenan networks.Carbohydrate Polymers, 53, 395e400. Martínez-Cervera, S., Sanz, T., Salvador, A., & Fiszman, S. M. (2012). Rheological, textural and sensorial properties of low-sucrose muffins reformulated with sucralose/polydextrose.Food Science and Technology, 45, 213e220.
Marudova, M., & Jilov, N. (2003). Influence of sodium citrate and potassium-sodium tartrate on gelation of low-methoxyl amidated pectin. Journal of Food Engineering, 59, 177e180.
Menezes, C. C. (2011).Desenvolvimento de goiabada sem adição de açúcar e com prebiótico e seus efeitos sobre biomarcadores de carcinogênese em ratos. Tese (Doutorado em Ciência de Alimentos)eUniversidade Federal de Lavras, Lavras. Menu-Bouaouiche, L., Vriet, C., Peumans, W. J., Barre, A., Van Damme, E. J. M., & Rougé, P. (2003). A molecular basis for the endo-b1,3-glucanase activity of the thaumatin-like proteins from edible fruits.Biochimie, 85, 123e131.
Mesquita, K. S., Borges, S. V., Carneiro, J. D. S., Menezes, C. C., & Marques, G. R. (2012). Quality alterations during storage of sugar-free guava jam with added prebiotics. Journal of Food Processing and Preservation, . http://dx.doi.org/ 10.1111/j.1745-4549.2012.00703.x.
Michel, A. S., Mestdagh, M. M., & Axelos, M. A. V. (1997). Physicochemical properties of carrageenan gels in presence of various cations.International Journal of Biological Macromolecules, 21, 195e200.
Mojet, J., & Köster, E. P. (2005). Sensory memory and food texture.Food Quality and Preference, 16, 251e266.
Montero, P., & Pérez-Mateos, M. (2002). Effects of Naþ, Kþand Caþ2on gels formed
fromfish mince containing a carrageenan or alginate.Food Hydrocolloids, 16, 375e385.
Morales, R., Guerrero, L., Serra, X., & Gou, P. (2007). Instrumental evaluation of defective texture in dry-cured hams.Meat Science, 76, 536e542.
Moreira, R., Chenlo, F., & Torres, M. D. (2011). Rheology of commercial chestnutflour doughs incorporated with gelling agents.Food Hydrocolloids, 25, 1361e1371. Ngouémazong, D. E., Tengweh, F. F., Fraeye, I., Duvetter, T., Cardinaels, R., Loey, A. V.,
et al. (2012). Effect of de-methylesterification on network development and nature of Ca2þ-pectin gels: toward understanding structure-function relations of pectin.Food Hydrocolloids, 26, 89e98.
Nobile, M. A., Chillo, S., Mentana, A., & Baiano, A. (2007). Use of the generalized Maxwell model for describing the stress relaxation behavior of solid-like foods. Journal of Food Engineering, 78, 978e983.
Nyman, M. (2002). Fermentation and bulking capacity of indigestible carbohydrates: the case of inulin and oligofructose.British Journal of Nutrition, 87, S163eS168. Oliveira, L. F., Borges, S. V., Nascimento, J., Cunha, A. C., Jesus, T. B., Pereira, P. A. P.,
et al. (2009). Utilização de casca de banana na fabricação de doces de banana em massa- avaliação da qualidade.Alimentos e Nutrição, 20(4), 581e589. Peleg, M. (1980). Linearization of relaxation and creep curves of solid biological
materials.Journal of Rheology, 24, 451e463.
Peleg, M. (1987). The basics of solid foods rheology. In H. R. Moskowitz (Ed.),Food texture: Instrumental and sensory measurement(pp. 3e33). New York, NY: Marcel Dekker Inc.
Peleg, M., & Normand, M. D. (1983). Comparison of two methods for stress relax-ation data presentrelax-ation of solid foods.Rheological Acta, 22, 108e113. Pons, M., & Fiszman, S. M. (1996). Instrumental texture profile analysis with
particular reference to gelled systems.Journal of Texture Studies, 27, 597e624. R Development Core Team. (2011).R: A language and environment for statistical
computing. Vienna, Austria: R Foundation for Statistical Computing, ISBN 3-900051-07-0, URL.http://www.R-project.org/.
Rahn, A., & Yaylayan, V. A. (2010). Thermal degradation of sucralose and its potential in generation chloropropanols in the presence of glycerol.Food Chemistry, 118, 56e61.
Ribeiro, C., Zimeri, J. E., Yildiz, E., & Kokini, J. L. (2003). Estimation of effective diffusivities and glass transition temperature of polydextrose as a function of moisture content.Carbohydrate Polymers, 51, 273e280.
Roberfroid, M. (2007). Prebiotics: the concept revisited.Journal of Nutrition, 137, 830Se837S.
Rodrigues, D., Rocha-Santos, T. A. P., Pereira, C. I., Gomes, A. M., Malcata, F. X., & Freitas, A. C. (2011). The potential effect of FOS and inulin upon probiotic bacterium performance in curdled milk matrices.Food Science and Technology, 44, 100e108.
Rodríguez-Cabezas, M. E., Camuesco, D., Arribas, B., Garrido-Mesa, N., Comalada, M., Bailón, E., et al. (2010). The combination of fructooligosaccharides and resistant starch shows prebiotic additive effects in rats.Clinical Nutrition, 29, 832e839. Rodríguez-Sandoval, E., Fernández-Quintero, A., & Cuvelier, G. (2009). Stress
relaxation of reconstituted cassava dough.Food Science and Technology, 42, 202e206.
Roopa, B. S., & Bhattacharya, S. (2009). Alginate gels: rupture characteristics as a function of the conditions of gel formation.Journal of Food Engineering, 91, 448e454.
Rychlewski, J. (1984). On Hooke’s law.Journal of Applied Mathematics and Mechanics, 48(3), 303e314.
Sandrou, D. K., & Arvanitoyannis, I. S. (2000). Low fat/calorie foods: current state and perspectives.Critical Reviews in Food Science and Nutrition, 40(5), 427e447. Sozer, N., & Dalgic, A. C. (2007). Modelling of rheological characteristics of various
spaghetti types.European Food Research Technology, 225, 183e190.
Sozer, N., Kaya, A., & Dalgic, A. C. (2008). The effect of resistant starch additions on viscoelastic properties of cooked spaghetti.Journal of Texture Studies, 39, 1e16. Steffe, J. F. (1992).Rheological methods in food process engineering. East Lansing, MI,
USA: Freeman Press.
Steffe, J. F. (1996).Rheological methods in food process engineering. East Lansing: Freeman Press.
Takemasa, M., Chiba, A., & Date, M. (2001). Gelation mechanism of kappa and iota carrageenan investigated by correlation between the strainoptical coefficient and the dynamic shear modulus.Macromolecules, 34, 7427e7434.
Tang, J., Tung, M. A., & Zeng, Y. (1998). Characterization of gellan gels using stress relaxation.Journal of Food Engineering, 38, 279e295.
Taniwaki, M., Hanada, T., & Sakurai, N. (2006). Device for acoustic measurement of food texture using a piezoelectric sensor.Food Research International, 39, 1099e1105.
Thrimawithana, T. R., Young, S., Dunstan, D. E., & Alany, R. G. (2010). Texture and rheological characterization of kappa and iota carrageenan in the presence of counter ions.Carbohydrate Polymers, 82, 69e77.
Vissoto, F. Z., Gomes, C. R., & Batista, B. J. L. (2005). Caracterização do comportamento reológico e da textura de chocolates sem sacarose.Brazilian Journal of Food Technology, 8(2), 107e111.
Williams, P. A. (2007).Handbook of industrial water soluble polymers. Oxford: Blackwell Publishing Ltd.
Yoo, S. H., Lee, B. H., Savary, B. J., Lee, S., Lee, H. G., & Hotchkiss, A. T. (2009). Characteristics of enzymatically-deesterified pectin gels produced in the presence of monovalent ionic salts.Food Hydrocolloids, 23, 1926e1929.