ISSN 0104-6632 Printed in Brazil
www.abeq.org.br/bjche
Vol. 33, No. 03, pp. 675 - 690, July - September, 2016 dx.doi.org/10.1590/0104-6632.20160333s20150133
Brazilian Journal
of Chemical
Engineering
EVALUATION OF SODIUM CHLORIDE
CRYSTALLIZATION IN MEMBRANE
DISTILLATION CRYSTALLIZATION APPLIED
TO WATER DESALINATION
Y. N. Nariyoshi
*, C. E. Pantoja and M. M. Seckler
Universidade de São Paulo, Escola Politécnica, Department of Chemical Engineering, Av. Prof. Luciano Gualberto, Travessa 3, 380, Butantã, 05508-010, São Paulo - SP, Brazil.
Phone: (55) (11) 30912285; Fax: (55) (11) 30912246 E-mail: [email protected]
(Submitted: February 27, 2015 ; Revised: September 14, 2015 ; Accepted: October 23, 2015)
Abstract - Crystallization in a Direct Contact Membrane Distillation (DCMD) process was studied both theoretically and experimentally. A mathematical model was proposed in order to predict the transmembrane flux in DCMD. The model fitted well experimental data for the system NaCl-H2O from undersaturated to supersaturated conditions in a specially designed crystallization setup at a bench scale. It was found that higher transmembrane fluxes induce higher temperature and concentration polarizations, as well as higher supersaturation in the vicinity of the solution-vapor interface. In this region, the supersaturation ratio largely exceeded the metastable limit for NaCl crystallization for the whole range of transmembrane fluxes of 0.37 to 1.54 kg/ (m2 h), implying that heterogeneous primary nucleation occurred close to such interface either in solution or on the membrane surface. Solids formed in solution accounted for 14 to 36% of the total solids, whereas solid formed on the membrane surface (fouling) was responsible for 6 to 19%. The remaining solids deposited on other surfaces such as in pumps and pipe fittings. It was also discovered that, by increasing the supersaturation ratio, heterogeneous nucleation in solution increased and on the membrane surface decreased. Heterogeneous nuclei in solution grew in size both by a molecular mechanism and by agglomeration. Single crystals were cubic shaped with well-formed edges and dominant size of about 40 µm whereas agglomerates were about 240 µm in size. The approach developed here may be applied to understanding crystallization phenomena in Membrane Distillation Crystallization (MDC) processes of any scale.
Keywords: Desalination; Membrane distillation; Modeling; Crystallization.
INTRODUCTION
Water reuse is being progressively implemented in the chemical processing industry due to increasing water scarcity worldwide (World Water Assessment Programme, 2012). Usually, aqueous waste streams after primary, secondary and tertiary processing steps receive additional treatment to make them suitable for reuse in the same site. Such waters are comprised mainly of inorganic species (salts) dissolved in water
Brazilian Journal of Chemical Engineering 2011). In a near future, due to increasingly stringent
environmental restrictions, brine treatment aiming at the full recovery of its water content will be progres-sively needed. Consequently, a requirement for such processes will be the delivery of salts as dry particu-late solid. To this end, separation methods such as Membrane Distillation Crystallization (MDC) may be considered. MDC lends itself to the use of low enthalpy energy sources, such as condensates with temperature within the range of 50 to 90 °C. The process is simple, compact and does not require costly materials; as mild temperatures and pressures close to atmospheric suffice (Curcio et al., 2011).
In MDC, a membrane distillation and a crystalliza-tion unit are integrated. In the membrane distillacrystalliza-tion unit, a porous hydrophobic membrane is placed be-tween two streams, a hot saline solution (feed) and a cold pure water stream (distillate). The air-filled mem-brane dry pores provide physical separation between the feed and distillate streams. Water vapor crosses the pores from the feed to the distillate side, due to a vapor pressure gradient. This gradient is provided by keep-ing the feed at a sufficiently higher temperature than the distillate. As a consequence of water evaporation, the saline solution becomes supersaturated. It flows to a crystallizer where the supersaturation is relieved by crystal formation. The above-described configuration for membrane distillation is usually called Direct Con-tact Membrane Distillation (DCMD). Other con-figurations are possible, but DCMD is the simplest, most economical and efficient for water desalination purposes (Alklaibi and Lior, 2005; Alkhudhiri et al., 2012). The crystallizer usually consists of a stirred vessel operating in clear-liquor advance mode (Lewis et al., 2015), in which solids of the material to be crystallized stay longer than the solution in the vessel. The solution is continuously circulated between the membrane and the crystallizer.
The DCMD configuration has been widely studied both theoretically and experimentally. Transport phe-nomena (heat, mass and momentum) involved in DCMD have been addressed by a number of research-ers (Schofield et al., 1987; Bandini et al., 1991; Phattaranawik et al.,2003; Termpiyakul et al.,2005), as have topics such as membrane module design (Mar-tinez and Rodriguez-Maroto, 2007; Edwie and Chung, 2012), development of new membrane materials (Cabassud and Wirth, 2003; Gethard et al., 2011; Yang et al., 2011), membrane fouling (Gryta, 2012; Guillen-Burieza et al.,2014; Meng et al.,2014), and membrane pore wetting (Tun et al.,2005; El-Bourawi et al.,2006), among others. Recently, a process design method for DCMD coupled with crystallization has been proposed (Pantoja et al., 2015). Concerning
modeling, Hitsov et al.,(2015) classified four groups of models in DCMD: i) process understanding and optimization models, ii) module design models, iii) process control models and iv) membrane synthesis models. For the current work, the first group is best suited because of the physical approach. The process understanding and optimization models are usually based on a combination of Nusselt and Sherwood equations for heat and mass transfer in solution.
Despite the fact that DCMD integrated with crys-tallization (MDC) is becoming increasingly attractive for actual implementation in industrial-scale projects, efforts must still be made for its consolidation in the water desalination field (Drioli et al.,2012). Among the major barriers, one can detect its long-term opera-tion, affected mainly by crystallization fouling of the membrane (Curcio and Drioli, 2005). The crystalliza-tion aspects of MDC applied to waste brines have not received much attention yet, as well as the morpho-logical features of the particulate generated, since such crystals are often considered to be a solid residue with low commercial value (Kim, 2011). The crystal-lizer is usually described as an equilibrium-stage operation that delivers a saturated solution and re-moves solid salt (Curcio et al., 2001). Crystallization fouling on the membrane or elsewhere in the process is roughly evaluated. Contributions dealing with mem-brane fouling do so in an empirical way. Edwie and Chung (2013) determined critical transmembrane fluxes at different Reynolds numbers and crystallizer temperatures in order to prevent occurrences of mem-brane fouling. Ding et al., (2008) recommended a prefiltering of the feed stream, gas bubble injection on the membrane feed side and fouling removal by backwashing the membrane with air. A physical ap-proach towards elucidation of membrane fouling in MDC has been theoretically described by Pantoja et al. (2015). They have shown that crystallization foul-ing is likely to be highly dependent on temperature and concentration polarization, which induce a high supersaturation in the solution in the vicinity of the solution-vapor interface. For aqueous NaCl solution, polarization is such that the local supersaturation largely exceeds the metastable limit. Therefore, this modeling work explains crystallization fouling due to temperature and concentration at the solution-vapor interface.
are formed (in solution or upon solid surfaces), high-light the crystal characteristics (size, form and purity) and their relation to MDC parameters, e.g., transmem-brane flux and flow velocity. For further investigation of the crystallization mechanisms, a semi-empirical model for transmembrane flux prediction in DCMD was proposed first. The model was validated with a bench scale batch unit fed with NaCl-H2O from un-dersaturated to supersaturated conditions. The model was used to determine the local supersaturation both in the bulk of the solution and in the vicinity of the solution-vapor interface. Additionally, an experi-mental setup has been devised to induce crystalliza-tion on the membrane and to identify which are the dominant elementary processes of crystallization. The model-derived bulk and local supersaturation values are used for interpretation of the experimental results. The NaCl-H2O system was chosen for experimental investigation given that waste brines from many chemical process wastewaters contain significant amounts of NaCl, usually more than 65% of total dis-solved species (Madwar and Tarazi, 2002).
EXPERIMENTAL
Laboratory Unit for Direct Contact Membrane Distillation (DCMD)
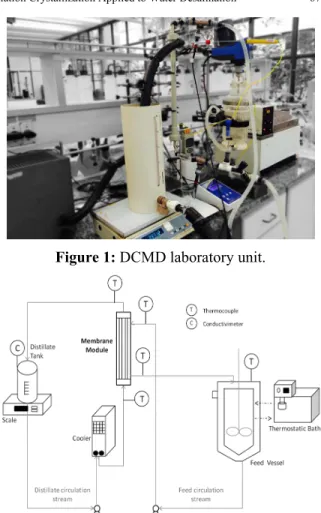
A DCMD laboratory unit in batch mode (Figures 1 and 2) includes a microfiltration module (Microdyn®, MD020CP2N) containing 40 tubular hydrophobic membranes in polypropylene (PP) allocated in a tubu-lar shell also in PP. According to the manufacturer, the membranes have a porosity of 70%, a nominal pore size of 0.20 m, a thickness of 450 m, external diam-eter of 1.80 mm and a total available area of 0.10 m2. Pure water (distillate) circulates continuously be-tween the membrane module (shell or tubes side) and a distillate tank (storage) by means of a centrifugal pump. On the opposite side of the membrane, the feed solution (retentate) circulates in a similar way. The temperatures of the feed solution and distillate streams are kept in the desired values by means of a thermostatic bath (heating jacket) and a cooler. The transmembrane flux is determined by continuously weighing the distillate tank. The heat flux is calcu-lated from an energy balance assisted by temperature measurements at specific points, as indicated in Figure 2. An electrical conductivity meter is placed inside the distillate tank in order to detect any leakage of salt solution from the feed to the distillate stream (membrane pore wetting).
Figure 1: DCMD laboratory unit.
Figure 2: Schematic representation of the DCMD la-boratory unit.
As shown in Table 1, experimental runs were performed with pure water (distillate) and aqueous NaCl solution with different concentrations (feed). Furthermore, different fluid dynamic conditions were explored in the module by varying the circulation flowrate on the feed and distillate sides. Finally, different inlet temperatures were applied in order to vary the transmembrane flux driving force. These runs lasted 30 minutes after stabilization of temperatures and flowrates.
Table 1: Experimental conditions in DCMD runs.
Feed composition: H2O H2O - NaCl
Feed concentration [kg NaCl/ 100 kg H2O]:
- 10, 12, 30,
33 and 36
Feed allocation (module): Shell Tubes
Feed circulation, FH [L/h]: 50, 100 and 200 200
Distillate circulation, FC [L/h]:
50, 100 and 200 50 and 190
Feed temperature, TH, inlet [°C]:
30, 40, 45 and 50 35 and 40
Distillate temperature, TC, inlet [°C]:
Brazilian Journal of Chemical Engineering
Laboratory Unit for Direct Contact Membrane Distillation (DCMD) Extended to Crystallization (MDC)
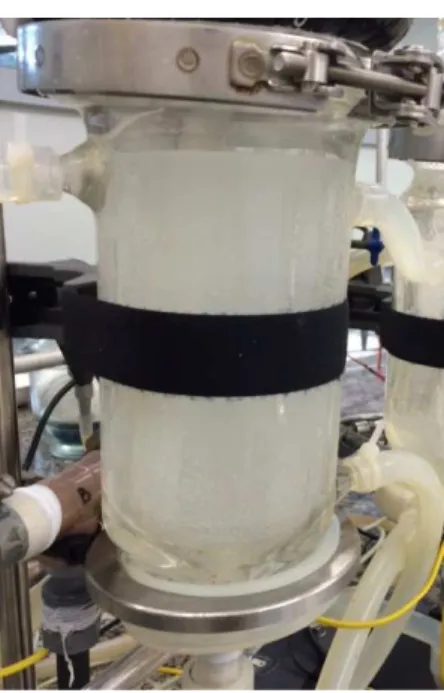
An experimental setup has been devised to explore the elementary aspects of crystallization, with assis-tance of the fundamental knowledge acquired from the previous DCMD experiments. A DCMD bench scale unit (Figure 1 and 2) was used in conditions that promoted crystallization on the membrane. A 0.5 L isothermal vessel (Figure 3) was added between the membrane module and the feed vessel to facilitate visual observation of the crystals formed within the membrane and in solution. The vessel was also used for sampling the suspension.
The modified unit was fed with saturated NaCl-H2O solution either under a low or a high temperature difference between the hot and cold streams (opera-tional conditions are reported in Table 2). The trans-membrane flux was determined by weighing as ex-plained before. The experimental runs lasted until membrane fouling disrupted the pseudo-steady state operation.
Figure 3: Isothermal vessel for crystal observation and sampling.
Table 2: Operational conditions of experimental runs (E_1 and E_2) with duplicates A and B.
Run TH, inlet [°C] TC, inlet [°C] FH [L/h] FC [L/h]
E_1A 36.3±1.0 20.4±1.0 260±5 230±5 E_1B 35.3±0.9 20.1±2.0 260±5 230±5 E_2A 50.7±1.0 29.7±0.6 260±5 230±5 E_2B 46.7±2.5 28.0±1.5 260±5 230±5
The total mass of produced crystals was deter-mined from the amount of water removed, according to the solubility of the system (Zemaitis, 1986). At the end of operation, the suspended crystals were with-drawn from the system, filtered under vacuum, washed with anhydrous ethanol and dried at 50 °C until con-stant weight. In order to quantify the portion of adhered crystals, the feed and observation/sampling vessels were scraped and their crystals dried at 50 °C until constant weight. The crystals remaining inside the DCMD module were determined by weighing the dry module before and after operation. Finally, the solids deposited elsewhere in the system were cal-culated by material balance. The suspended crystals were morphologically characterized by Scanning Electronic Microscopy (JEOL®, JSM-7401F) and had their size distribution measured by Laser Light Scat-tering (MALVERN®, Mastersize X).
DIRECT CONTACT MEMBRANE DISTILLATION (DCMD)
Mathematical Model for DCMD
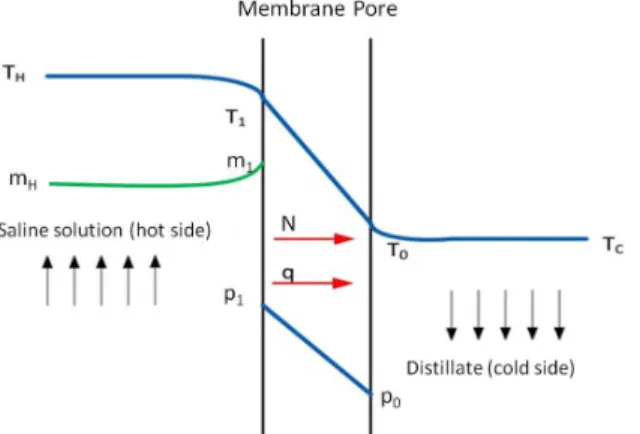
As previously mentioned, the pores of a hydropho-bic membrane are filled with air in DCMD. One extremity of the pores is in contact with a hot aqueous saline solution and the other extremity with cold distillate water. The transmembrane water vapor flux (N) established across the pores (Figure 4), can be described by the following equation:
M 1 0
NK (p p ) (1)
The transmembrane flux (N) is proportional to the water vapor pressure difference between the liquid-vapor interfaces on each pore side (p1-p0). The pa-rameter KM is the overall mass transfer coefficient for vapor transport across the air-filled pores. As the pores are filled with atmospheric air, the resistance to ordinary diffusion of water vapor molecules through a stagnant air layer (KD) has an important role in the determination of KM. Furthermore, considering that the membrane pore radius (r) typically used in DCMD lies between 0.10 and 0.45 m, and the mean free path of one molecule of water is on the order of 0.30 m at 60 °C, the resistance due to Knudsen diffusion (KK) may also be of importance (Schofield et al., 1987).
Figure 4: Temperature (T), concentration (m) and vapor pressure (p) profiles across a hydrophobic membrane pore in DCMD. The subscripts H and C refer to the bulk of the saline solution and distillate streams. The subscripts 1 and 0 indicate the liquid-vapor interface on the hot and cold sides, respectively.
Table 3: Mass transfer correlations in DCMD (Alkhudhiri et al., 2012).
Overall mass transfer coefficient Ordinary diffusion coefficient Knudsen diffusion coefficient
-1 lm M
D K
Y 1
K
K K
w w D
lm lm
1 D M
K
Y χ R T
0.5 w K
lm
r M K =1.064
χ R T
Correlations for KD and KK are also presented in the table. These coefficients may be calculated from mem-brane characteristics such as porosity ( ), tortuosity (χ), thickness ( ) and pore radius (r). Also needed are physical-chemical data such as water vapor diffusivity in air (DW), water molecular weight (MW), as well as the ideal gas constant (R), the log-mean temperature (Tlm) and log-mean air fraction (Ylm) inside the pores. In order to calculate Tlm (Eq. (2)), temperatures at the liquid-vapor interfaces (T1 and T0) must be esti-mated. Likewise, Ylm calculation from Eq. (3) requires the air mole fractionsY1 and Y0, which can be estimated from their respective vapor pressures (p1 and p0) and the total pressure (P) inside the pores according to Eqs. (4).
1 0
lm
1 0
T T
T =
lnT lnT
(2)
1 0
lm
1 0
Y Y
Y
ln Y ln Y
(3)
1 1
p Y
=1-P (4a)
0 0
p Y
=1-P (4b)
It is assumed that thermodynamic equilibrium is established at the two liquid-vapor interfaces. Thus, the vapor pressure at the distillate side can be es-timated from the Antoine equation (Table 4 right) for known values of the interfacial temperature T0 and of three parameters A, B and C for pure water. Similarly, the vapor pressure at the solution-vapor interface can be determined at the temperature T1, with the same parameters A, B and C and the water activity at the interfacial solution concentration. The latter may be determined with a suitable chemical speciation model such as Pitzer’s.
Table 4: Antoine equation for an aqueous saline so-lution (left) and pure water (right) (Zemaitis, 1986).
Vapor pressure at the solution-vapor
interface
Vapor pressure at the distillate-vapor
interface
1 B A
-C+T 1 w
p a 10 0
B A
-C+T 0
p 10
Brazilian Journal of Chemical Engineering
1 H 1
q = h T - T (5a)
0 0 C
q = h T - T (5b)
The parameters h and 1 h are the convective 0 heat transfer coefficients on the saline solution and distillate sides, respectively. Such coefficients are calculated from the characteristic Nusselt number (Nu) for each membrane side, which depends on the flow regime and geometry. In the present model, the geometry is tubular and semi-empirical correlations as suggested by Phattaranawik et al. (2003) are con-sidered (Table 5).
Table 5: Semi-empirical correlations for Nu in tubular geometry (Phattaranawik et al., 2003) as functions of equivalent length (Le), equivalent diameter (de), Reynolds (Re) and Prandtl numbers (Pr). Le is equal to membrane length.
Laminar flow Turbulent flow
e e 0.8 e e
0.036 Re Pr d / L Nu=4.36+
1+0.0011 Re Pr d / L
0.8 1/3 e
e
6d
Nu=0.023 1+ Re Pr
L
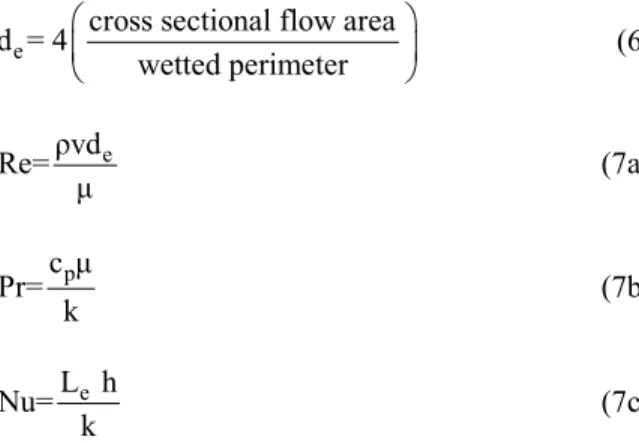
The equivalent diameter (de), the Reynolds (Re), the Prandtl (Pr) and the Nusselt numbers (Nu) are defined in Eqs. (6) and (7) and depend on the fluid thermal conductivity, the thermal convective coeffi-cient, specific heat, density, viscosity and velocity (k, h, cp, ρ, μ and v, respectively).
e
cross sectional flow area d = 4
wetted perimeter
(6)
e
ρvd
Re= (7a)
p
c Pr=
k (7b)
e
L h Nu=
k (7c)
An energy balance in the stationary state around the saline solution in contact with the membrane im-plies that the radial heat flux q is equal to the enthalpy variation of the solution crossing the module. A similar balance can be applied to the distillate side, resulting in the following equations:
H p,H H
q =- F c T (8a)
C p,C C
q = F c T (8b)
F refers to the mass flow rate, T to the temperature and cp to the fluid specific heat at constant pressure. The subscripts H and C indicate the hot saline solution and the cold distillate stream, respectively. The symbol
∆ indicates the difference between the module outlet and inlet.
Eqs. (5) are used to estimate the interfacial tem-peratures T1 and T0. A Temperature Polarization Coef-ficient (TPC), defined by Equation (9a), quantifies the relation between the interfacial and bulk temperatures at each side of the pore (Tun et al., 2005).
Water evaporation at the solution-vapor interface promotes a local variation of solute concentration rel-ative to its concentration in the bulk. This variation gives rise to a concentration polarization, which can be quantified by a Concentration Polarization Coeffi-cient (CPC), defined by Equation (9b) (Ji et al., 2010). The CPC relates the solute molal concentration at the solution-vapor interface (m1) with the solute molal concentration in the bulk solution (mH). This coeffi-cient can be estimated by a correlation that takes into account solution density (ρH), transmembrane flux (N) and the coefficient of solute mass transfer (KL). The TPC and CPC equations are presented next.
1 0 H C T T TPC = T T
(9a)
H L N K 1 H m CPC = = e
m
(9b)
The solute mass transfer coefficient (KL) can be calculated from semi-empirical correlations such as those proposed by Dittus-Boelter for turbulent flow and by Levesque for laminar flow (Yun et al., 2006) (Table 6). For these correlations, Sc can be calculated from the viscosity (μ) and the density (ρ) of the liquid and from the solute diffusivity (Ds) (Eq. (10)).
s
Sc=
ρD (10)
Table 6: Semi-empirical correlations for KL in tubular geometry (Yun et al., 2006) as a function of flow velocity (v), equivalent length (Le), equivalent diameter (de), solute diffusivity (Ds), Reynolds number (Re) and Schmidt number (Sc).
Laminar flow Turbulent flow
1/3 2/3 e L s e d v
K =1.62 D
L
0.8 0.33 s L
e
D K =0.023Re Sc
The vapor pressure at the solution-vapor interface (p1) is an important parameter, because it determines the magnitude ofthe transmembrane flux (N) as stated in Eq. (1). In order to calculate p1, it is necessary to predict the water activity (aW) according to the Antoine equation in Table 4. Therefore, in the present model, the water activity in aqueous systems with strong electrolytes is predicted with a rigorous ther-modynamic method, the Pitzer method (Zemaitis, 1986). This method has as inputs the composition and temperature of a saline solution, providing as output the water osmotic coefficient ( ) , which is re-lated to water activity (aW) according to the following equations:
w w i i i
1000ln a
M m
(11a)
c a
c a ca
3/2 c a 2
ca
2
-1= Z Z f +m B
2 m C (11b) 2 i i i 1
I m z
2
(11c)I f =-A
1+1.2 I
(11d)
3
0 A B H
1 e 2 N
A
3 k T 1000
ρ ξ
(11e)
ca 0 1 1
B exp I (11f)
The variables Zi represent the ion charges and the variables υi the stoichiometric coefficients of the ionic
species in the reactions of dissociation in water. The solution concentration is expressed in terms of molal-ity (mi), which allows the calculation of the ionic strength (I). The Debye-Huckel constant (Aϕ) is a func-tion of the saline solufunc-tion temperature (TH) and of the solvent density (ρ0), wherein e, , NA and kB are, re-spectively, the electron charge, solvent dielectric constant, Avogadro number and Boltzmann constant.
0, 1 and Cφ are the Pitzer parameters, which, for NaCl, are 0.0765, 0.2664 and 0.00127, respectively, where the parameter α1 is equal to 2.0 for 1-1 electro-lytes (Zemaitis, 1986).
In a shell-and-tubes module (commonly used in DCMD), the saline concentration increases along the module as water is evaporated. Therefore, due to direct contact of the two liquids on each membrane interface at different temperatures, the saline solution tends to decrease its temperature and the distillate temperature tends to increase along the module, reflecting heat transfer due to the latent heat of evaporation/condensation and the heat of conduction. Because of a high circulation flowrate and a short flow channel (bench scale apparatus), such longitudi-nal variations were small. In other words, along the module, flowrates were considered to be constant, a Log-Mean Temperature Difference (LMTD) across the module was taken and an arithmetic mean between inlet and outlet for the bulk saline concentration was considered. Only one thermal boundary layer on each membrane interface (solution-vapor and distillate-vapor) and a single mass boundary layer (solution-vapor) were assumed.
For supersaturated solutions, it is of interest to determine the solution temperature and concentration at the membrane inlet and outlet, both in the bulk and at the solution-vapor interface. These may be calcu-lated by material balance using the model-derived values of flux and membrane polarizations. For this calculation (not shown), it was assumed that: i) the solution leaving the isothermal vessel is saturated (supersaturation is consumed by crystal formation); ii) the solution leaving the feed vessel is slightly undersaturated (higher temperature than the isother-mal vessel); iii) the bulk solution leaving the mem-brane is slightly supersaturated (due to solvent evaporation and a slight cooling in the membrane); and iv) the water vapor flux is constant. The calcu-lated NaCl concentrations are compared to the solu-bility by means of the supersaturation ratio, S, (Eq. (12)), where c and c* are the concentration of solution and solubility, respectively.
c S=
c* (12)
An S value of 1.0 indicates that the solution is saturated; values below 1.0 indicate that the solution is undersaturated and values above 1.0 represent su-persaturated conditions. For the system in study (NaCl-H2O), the supersaturation ratio limit for spon-taneous crystal formation (primary nucleation) is S = 1.0025, also called the metastable limit (Mullin, 2001).
Brazilian Journal of Chemical Engineering is, thus, composed of a set of algebraic equations that
can be solved simultaneously. The model was imple-mented in EXCEL®. The model input parameters are the bulk temperatures (TH and TC) at the module inlet and outlet, as well as the mass flow rates (FH and FC) and the inlet bulk saline concentration (mH). Model outputs are the membrane polarization coefficients (TPC and CPC), the mass transfer coefficients within the air filled pores (KM, KD and KKn), the interfacial vapor pressures across the membrane pores (p1 and p0) and, finally, the transmembrane flux (N).
Model Validation for Undersaturated to Saturated Solution
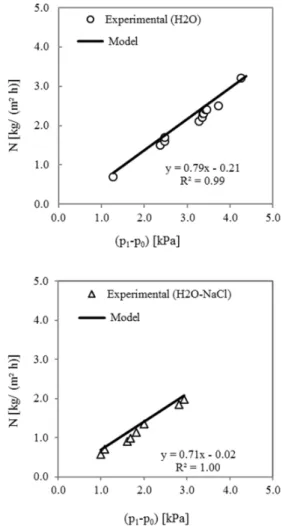
Figure 5 reports the values of transmembrane flux (N) predicted by the model and those experimentally determined as functions of the vapor pressure differ-ence between the liquid-vapor interfaces across the membrane pores (p1-p0). To illustrate how the experi-mental values of N were obtained, one typical run is explained next. The saline solution was allowed to circulate on the tubes side (200 L/h), with an initial concentration of 10kg of NaCl per 100kg of water and an inlet temperature at 35 °C. Similarly, distillate water was circulated on the shell side (190 L/h) with an inlet temperature of 20 °C. After 18 min, a semi-stationary state was achieved. During the subsequent 30 min, the distillate tank was continuously weighed to determine the mass gain as a function of time. For a known membrane area, the experimental N could be determined. Using the measured values of tempera-ture (Figure 3) and inlet salt concentration, the mathe-matical model yielded the vapor pressure difference and the transmembrane flux. The experimental value for N was 1.03 kg/ (m² h) and the model value was 1.15 kg/ (m² h) under a vapor pressure difference (p1 -p0) of 1.69 kPa. The conditions for several other experiments are shown in Table 1.
In Figure 5, it is noticeable that the model slightly overestimates the experimental data by about 10%, a good match considering that no model parameters were fit for the particular experimental setup used. It is likely that the actual membrane parameters differ somewhat from the values given by the manufacturer. The model was found to be valid for both pure water and aqueous NaCl solution on the feed side, for a wide range of temperatures, concentrations, and circulation flowrates and for different fluid allocations in the module (Table 1). The dominant mechanism of mass transfer resistance is ordinary diffusion (Yln/KD), which is approximately 12500 times higher than Knudsen diffusion (1/KKn). For the system fed with pure water, the lowest N obtained was 0.7 and the
highest 3.2 kg/ (m² h), under (p1-p0) ranging from 1.3 to 4.4 kPa. Regarding the system fed with aqueous NaCl solution, the lowest N obtained was 0.6 and the highest 2.0 kg/ (m² h), under (p1-p0) ranging from 1.0 to 2.9 kPa.
Figure 5: Transmembrane flux (experimental and model) as a function of vapor pressure driving force in DCMD fed with pure water (top) and aqueous NaCl solution (bottom).
Membrane Overall Mass Transfer Coefficient
MDC applications, as the membrane inlet salt concen-tration is high and almost invariant, it is recommended to set a high inlet temperature to obtain a low value for Ylm and a high value for KM, which leads to a high transmembrane flux.
Figure 6: Log-mean air molar fraction inside the pores in function of two inlet bulk temperatures and NaCl concentration.
Polarization Effects
The Temperature Polarization Coefficient (TPC) defined in Eq. (9a) gives an indication of the actual transmembrane flux, which is directly related to the interfacial temperature difference across the air-filled pores (T1-T0), in comparison to the value that could be obtained for a given bulk temperature difference (TH -TC). A TPC value of 1.0 represents no polarization and maximal transmembrane flux for a given (TH-TC). TPC values ranging from 0.60 to 0.70 were obtained from the experimental runs reported in Table 1.
The Concentration Polarization Coefficient (CPC), defined in Eq. (9b) as the ratio of the interfacial to the bulk concentration on the retentate side of the pore, is also an indication of the actual transmembrane flux in relation to the flux that would be obtained in the absence of boundary layer concentration profiles. A CPC value of 1.0 indicates no polarization and maximum flux for a given retentate concentration. Experimentally the CPC ranged from 1.02 to 1.08.
The impact of these polarizations (TPC and CPC) on the flux (N) is shown in Figure 7. Values of N without any type of polarization (ideal flux based on bulk temperatures and concentrations) were compared to N values taking into account only temperature polarization (TPC reduction), only concentration polarization (CPC reduction) and both polarizations (TPC and CPC reduction). Figure 7 shows that the ideal N (without polarizations) was reduced from 42
to 66% due to both polarizations (TPC and CPC). TPC was more important than CPC in dilute solutions, corresponding to a 32% reduction in flux (for a total reduction of 42%), whereas CPC was more important than TPC in concentrated solutions, responding to a 40% reduction in flux (for a total reduction of 60%).
Figure 7: Effects of temperature and concentration polarization (TPC and CPC) on ideal flux as a func-tion of NaCl concentrafunc-tion.
Fluid Dynamics
The effects of flow velocity on transmembrane flux (N) were experimentally investigated by varying the circulation flowrate on both the shell and tubes sides. Experiments were conducted with distilled water on both sides, so that concentration polarization was absent, simplifying the analysis. The inlet bulk temperatures were fixed at 49 and 30 °C for shell and tubes, respectively. The flux N (Eq. (1)) and the TPC (Eq. (9a)) values are shown in Figures 8 and 9 as a function of circulation flowrate, respectively.
Figure 8 shows that, for a fixed set of inlet tem-peratures, a higher circulation flowrate on the shell side (hot water) results in higher transmembrane flux; an increase of 8% being found for the range of values investigated. However, the circulation flowrate on the tube side (cold water) has a negligible effect on N. The model predicted well these effects (compare lines and symbols in Figure 8).
Brazilian Journal of Chemical Engineering in flux is less pronounced than expected from the
increase in temperature difference, since the tempera-ture polarization coefficient decreases with higher values of circulation flowrate on the shell side (Figure 9). The TPC varied 10% in the range of conditions investigated.
Figure 8: Transmembrane flux (experimental and model) as a function of circulation flowrate on the tube and shell sides.
Figure 9: TPC (model) and LMTD (experimental) as functions of the circulation flowrate on the tube and shell sides.
The observed lower value of TPC at higher circula-tion flowrate derives from two opposing effects, a mass transport one and a latent heat one. Firstly, the mass transport is more effective on the membrane boundary layer at higher Reynolds (Re) numbers (the range covered experimentally was 420<Re<1750), which contributes to a higher TPC. Secondly, at higher circulation the larger transmembrane flux cor-responds to a larger heat of evaporation on the
retentate side, as well as a higher heat of condensation on the distillate side of the pore. Energy balances on each interface show that the interfacial temperature is reduced on the retentate side, whereas on the distillate side it is increased, both effects contributing to lower TPC. Therefore, polarization was more pronounced (TPC was lower) at higher circulation flowrate be-cause the latent heat effect was more important than the opposing mass transport effect on the boundary layer.
By considering both the flux and the TPC re-sponses to the circulation flowrate on the shell side, we conclude that higher circulation flowrates promote higher fluxes due to a higher LMTD (vapor pressure difference) along the module, in spite of the lower TPC. The Re numbers evaluated (tube and shell sides) are quite low. Thus, it is possible that a different behavior might be found for larger Re numbers. Indeed, Pantoja et al. (2015) have shown that, by providing turbulent flow in the membrane, polariza-tion coefficients close to 1.0 are attainable.
Membrane Wetting
Another aspect investigated was the operational pressure applied on both membrane sides (shell and tubes) associated with liquid flow. In spite of mem-brane hydrophobicity, operational pressure above a certain limit can promote liquid penetration inside the pores (membrane wetting). This limit is called the Liquid Entry Pressure (LEP). The Laplace-Cantor equation (Eq. (13)) can be applied for LEP calculation (El-Bourawi et al., 2006).
w
2 b cosθ LEP=
r
(13)
In Eq. (13), b is a geometric factor determined by pore geometry (assumed to be 1 for cylindrical pores), r is the pore radius (0.10 µm for the membrane in study), is the membrane hydrophobicity (2.09 rad for PP) and w the superficial tension of water in con-tact with the membrane material (0.072 N/m for water-PP).
conductivity, which did not indicate any leakage of saline solution through membrane pores.
CRYSTALLIZATION
NaCl crystallization takes place when the solution temperature and concentration are such that the solu-bility limit of NaCl is exceeded. In DCMD, if suf-ficient solvent is removed by evaporation, crystalliza-tion may occur. Besides, since temperature and con-centration polarization arise in DCMD processes, the solution temperature in the vicinity of the solution-vapor interface is lower than in the bulk, whereas the solution concentration is higher. Therefore, the super-saturations in the bulk and near the solution-vapor interface are different. Depending on the supersatura-tion, specific elementary processes of crystallization will be more important. The identification of which elementary processes are active is crucial in order to better understand the crystal characteristics and to control crystallization. Therefore, we propose to ex-plore the elementary crystallization processes both theoretically and experimentally and their relation to the local supersaturation ratio associated with changes in DCMD parameters.
Transmembrane Flux
The transmembrane flux behavior is shown in Fig. 10. In experiment E_1A the initial flux was 0.63 kg/ (m² h) and had a linear flux decay of 7% per hour during 120 minutes of operation. The duplicate periment (E_1B), exhibited the same behavior. In ex-periment E_1B, in which the operational time was extended, the drop in flux proceeded smoothly until 180 minutes. Thereafter the flux dropped rapidly, oper-ation being no longer possible after 280 minutes. Interestingly, particles in suspension were visually noticed as turbidity (Fig. 3) at the beginning of opera-tion under a constant transmembrane flux (within the first 30 minutes). These particles recirculated through-out the system continuously. Concerning the second experimental run (E_2A), the initial flux was 1.54 kg/ (m² h). Its duplicate (E_2B) had a lower initial flux, 1.48 kg/ (m² h), due to a slightly lower inlet feed temperature and lower LMTD along the module, but had a similar flux behavior during the whole opera-tional time. In each one of these experiments, the flux was constant in an initial stage that lasted 50 minutes, followed by an abrupt decay. The sudden drop in membrane permeability observed in all experiments is likely to be associated with pore blockage due to crystallization fouling (Di Profio et al.,2010).
Figure 10: Transmembrane flux and temperature difference (LMTD) along the module as a function of operational time from experimental runs E_1 (top) and E_2 (bottom). Experiments A and B are duplicates.
Figure 10 also shows that the sharp drop in trans-membrane flux is accompanied by a sharp increase in the temperature difference along the module (LMTD), which is explained by a drop in the circulation flowrate (not shown). Therefore, because membrane fouling hampers the fluid passage, it is likely that it occurs not only on the membrane pores, but also in other parts of the unit. Indeed, clogging of the circula-tion pump by particle deposicircula-tion was visually ob-served after the experimental runs. Deposition of solids in the sampling vessel was also visually de-tected (see also next section).
The concomitant effect of flux reduction and LMTD increase provides another evidence for mem-brane pore blockage, since in the absence of pore blockage the flux would be proportional to LMTD.
Model Validation for Supersaturated Solution
Brazilian Journal of Chemical Engineering predicted by the DCMD model (Nmod) superestimates
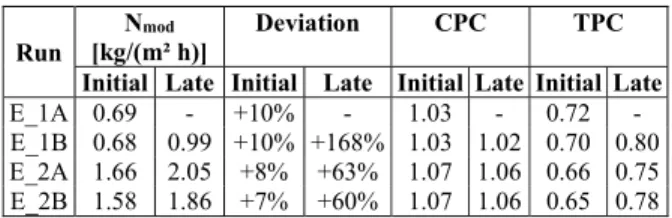
the experimental flux within 10% deviation (Table 7), just as it did for undersaturated solutions. Also in anal-ogy to the previously derived results for undersatu-rated solution, polarization effects for high flux (E_2) are more important than for low flux (E_1) (Table 7). Therefore, for high flux a lower temperature and a higher NaCl concentration is expected in the vicinity of the solution-vapor interface, both contributing to a higher local supersaturation. We have calculated the impact of such temperature and concentration gradi-ents on the local supersaturation ratio at both the membrane module inlet and outlet, as explained in the section “Mathematical Model for DCMD”.
The supersaturation ratios (S) at the initial stage of operation are given in Table 8. The bulk solution at the membrane inlet is slightly undersaturated, but in the vicinity of the solution-vapor interface the solu-tion is supersaturated. At the membrane module outlet, the NaCl concentration in the bulk is higher than at the inlet because of water transport (supersatu-ration decay associated with crystallization within the membrane is neglected), so the outlet solution is supersaturated both in the bulk and at the interface. Closer inspection of the supersaturation ratios reveals that the solution in the bulk is always below the NaCl-H2O metastable limit (S<1.0025), but the metastable limit is remarkably exceeded in the solution-vapor in-terface at both membrane inlet and outlet (S>1.0025). Therefore, primary nucleation is not expected to occur in the bulk, but will take place in the vicinity of the membrane surface throughout its whole length. Table 8 also shows that for higher fluxes (E_2A and B) the supersaturation is higher everywhere in comparison with low fluxes (E_1A and B), because polarization is more pronounced.
We now consider the late stage of operation, after the sharp flux drop. Table 7 shows that the model largely overestimates the flux. Since the values of TPC and CPC are similar to the non-crystallization conditions, the extremely low experimental fluxes are not determined by a low flux driving force, but by a high mass transfer resistance. Therefore, the low flux may be explained by crystallization fouling of the pores.
In summary, the application of the DCMD model to conditions of our crystallization experiments re-vealed that the vicinity of the liquid-vapor interface is supersaturated throughout the whole membrane mod-ule length and that the supersaturation ratio is higher when the transmembrane flux is higher, because of larger temperature and concentration polarization effects. Besides, the model revealed that the sharp drop in flux towards the end of the membrane life is
due to a reduced membrane permeability that is consistent with membrane fouling.
Table 7: Transmembrane flux in DCMD (model and deviation from experimental), concentration polarization coefficient and temperature polariza-tion coefficient.
Run
Nmod
[kg/(m² h)]
Deviation CPC TPC
Initial Late Initial Late Initial Late Initial Late
E_1A 0.69 - +10% - 1.03 - 0.72 -
E_1B 0.68 0.99 +10% +168% 1.03 1.02 0.70 0.80
E_2A 1.66 2.05 +8% +63% 1.07 1.06 0.66 0.75
E_2B 1.58 1.86 +7% +60% 1.07 1.06 0.65 0.78
Table 8: Supersaturation ratio at the membrane inlet and outlet in the bulk solution and in the solution-vapor interface (membrane); initial stage of operation, before the abrupt flux drop.
Run Sin, bulk Sin, membrane Sout, bulk Sout, membrane
E_1A 0.9991 1.0305 1.0002 1.0316
E_1B 0.9989 1.0304 1.0001 1.0316
E_2A 0.9969 1.0691 1.0008 1.0718
E_2B 0.9959 1.0688 1.0005 1.0708
Solids Distribution Throughout the Laboratory Unit
Table 9 shows the total mass of produced solids, the percentage of solids in suspension, the percentage deposited in the DCMD module, the percentage ad-hered in the sampling vessel and the percentage remaining elsewhere in the unit. The latter includes depositions in the pump, valves, pipe fittings and flowmeter. NaCl lost during manipulation, such as withdrawal, filtering and washing are neglected.
Table 9: Mass quantification of NaCl production in the unit.
Run Total [g]
Suspended [%]
DCMD [%]
Sampling V. [%]
Elsewhere [%]
E_1A 49 14 10 8 68
E_1B 70 17 19 9 55
E_2A 65 18 6 8 68
E_2B 55 36 7 10 47
whereas the proportion of crystals in suspension was higher. Therefore, the data suggest that a high super-saturation enhanced heterogeneous primary nuclea-tion in solunuclea-tion and reduced heterogeneous primary nucleation on the membrane surface.
Particles Characterization
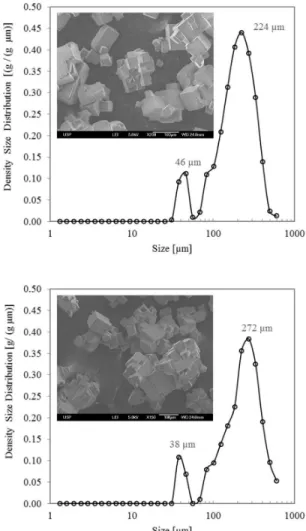
Particles in suspension were a mixture of single crystals with cubic habit and polycrystalline particles (agglomerates) (see insets of Figure 11). The particles display well-defined edges, indicating absence of breakage. Figure 11 also shows that the particles in sus-pension exhibited a bimodal size distribution function. In experimental run E_1B (top), the dominant sizes were 46 and 224 µm, while in run E_2B (bottom) the corresponding dominant sizes were 38 and 272 µm. The larger sizes generally correspond to agglomerates and the smaller ones to single crystals, such as the ones shown in Figure 11 SEM insets. The smaller sin-gle crystals and larger agglomerates found in the experiment E_2B may be explained by the higher local supersaturation ratio (S) on the membrane solution-vapor interface, as under these conditions the primary nucleation rate and the agglomeration rate are higher. These results are qualitatively consistent with crystal-lization theory (Mullin, 2001; Lewis et al., 2015).
Elementary Processes of Crystallization
Based on the experimental evidence found so far, we propose the main elementary processes involved in NaCl crystallization in our experiments. Since no NaCl seeds are present throughout the system, some sort of primary nucleation is responsible for the formation of new crystals. Heterogeneous nuclei formed upon solid surfaces are more easily formed than heterogeneous nuclei in solution, because the energy barrier is lower (Lewis et al.,2015). Upon fur-ther growth, these nuclei form a solid layer on the surfaces, that is, they form the so-called crystalliza-tion fouling. This process has been observed on poly-meric membrane surfaces (Di Profio et al., 2010). Micrometric fragments of the incrustation layer may become loose and enter the solution by mechanical action of other crystals and, less likely, merely by hy-drodynamic shear, a process called secondary nuclea-tion – this effect has not been quantified so far. As long as these nuclei are released into a supersaturated solution, they grow by molecular and agglomeration mechanisms, forming a suspension. Part of these heterogeneous nuclei may also form directly from solution. Because crystals are small, they circulate with the suspension. This observation leads to the
hypothesis that particulate fouling might also occur, in which part of the crystals in suspension begins to collide, adhere, to agglomerate and grow attached on the membrane surface (Bramson et al.,1995).
Figure 11:Crystal size distribution and Scanning Electronic Microscopy of suspended crystals from E_1B (top) and E_2B (bottom).
CONCLUSIONS
Brazilian Journal of Chemical Engineering concentration polarization in solutions close to
satura-tion. Both temperature and concentration polarization effects were enhanced for high transmembrane flux, because of solution-vapor interface cooling associated with the latent heat of vaporization and increased solute concentration associated with the rate of sol-vent evaporation.
The DCMD model for crystallization conditions revealed that the solution in the vicinity of the solu-tion-vapor interface was supersaturated with respect to NaCl, even at the membrane inlet, where the bulk solution was undersaturated. Besides, it was found that the supersaturation ratio near the solution-vapor interface largely exceeded the metastable limit, im-plying that heterogeneous nucleation of NaCl would take place. Heterogeneous nucleation in solution was likely to be responsible for the formation of 14 to 36% of the solids, whereas 6 to 19% of the solids were formed by heterogeneous nucleation on the mem-brane surface (crystallization fouling). The remaining solids were formed on others surfaces of the experi-mental unit outside the membrane. Higher supersatu-rations increased the proportion of suspended crystals and decreased the proportion of crystals deposited on the membrane.
Particles after a few hours of operation consisted of a mixture of single crystals of cubic habit with dominant size of about 40 µm and agglomerates with dominant size of about 240 µm. Higher supersatura-tion led to smaller single particles and larger ag-glomerates.
The DCMD model enables the determination of supersaturation in the solution-vapor interface of the membrane, which in turn may be correlated to ele-mentary crystallization processes and ultimately with the processes leading to membrane fouling. This ap-proach was used here to explain the experimental behavior of a bench scale system, but may be easily extended to MDC operations based on DCMD of any scale.
NOMENCLATURE
A, B, C Antoine equation parameters
Aφ Debye-Huckel constant [kg1/2.mol-1/2]
a Solvent activity
b Geometric factor of the membrane pores c Concentration of solution [kg/ 100 kg of
solvent]
c* Solubility of solution [kg/ 100 kg of solvent]
cp Specific heat at constant pressure [J/(Kg.K)]
D Diffusivity [m²/s]
d Diameter [m]
F Mass flow rate [Kg/s]
h Heat transfer coefficient [W/(m².K)] K Mass transfer coefficient [Kg/(m².s.Pa)] k Thermal conductivity [W/(m.K)] L Characteristic length [m]
m Molality [mols of solute/ 100 kg of solvent]
N Transmembrane vapor flux [kg/(m2.s)]
Nu Nusselt number
P Total pressure [Pa]
p Vapor pressure [Pa]
Pr Prandtl number
q Heat flux [W/m²]
r Pore radius [m]
Re Reynolds number
S Supersaturation ratio
Sc Schmidt number
T Temperature [K]
v Velocity [m/s]
Y Air mole fraction
Z Ionic charge
Greek Letters
Membrane thickness [m]
Membrane porosity
µ Viscosity [Pa.s]
Stoichiometric coefficient
Dielectric constant
ρ Density [kg/m³]
Superficial tension [N/m] Membrane hydrophobicity [rad]
Φ Osmotic coefficient
χ Membrane tortuosity
Subscripts
0 distillate-vapor interface, cold side 1 solution-vapor interface, hot side
D ordinary diffusion
e equivalent
C cold (bulk)
H hot (bulk)
i Ionic specie
K Knudsen diffusion
lm log-mean
L solute diffusion
m arithmetic average
ACKNOWLEDGEMENTS
The authors wish to acknowledge the financial support of CAPES – Brazilian Federal Agency for Support and Evaluation of Graduate Education within the Ministry of Education of Brazil.
REFERENCES
Alkhudhiri, A., Darwish, N., Hilal, N., Membrane dis-tillation: A comprehensive review. Desalination, 287, p. 2-18 (2012).
Alklaibi, A., Lior, N., Membrane distillation desalina-tion: status and potential. Desalination, 171(2), p. 111-131 (2005).
Baker, R. W., Membrane Technology and Applica-tions. Wiley, New York (2004).
Bandini, S., Gostoli, C., Sarti, G., Role of heat and mass transfer in membrane distillation process. Desalination, 81(1-3), p. 91-106 (1991).
Bramson, D., Hasson, D., Semiat, R., The roles of gas bubbling, wall crystallization and particulate depo-sition in CaSO4 scale formation. Desalination, 100(1-3), p. 105-113 (1995).
Cabassud, C., Wirth, D., Membrane distillation for water desalination: how to choose an appropriate membrane? Desalination, 157(1-3), p. 307-314 (2003).
Curcio, E., Criscuoli, A., Drioli, E., Membrane crys-tallizers. Industrial & Engineering Chemistry Re-search, 40(12), p. 2679-2684 (2001).
Curcio, E., Drioli, E., Membrane distillation and re-lated operations - A review. Separation and Puri-fication Reviews, 34(1), p. 35-86 (2005).
Di Profio, G., Curcio, E., Drioli, E., Supersaturation control and heterogeneous nucleation in mem-brane crystallizers: Facts and perspectives. Indus-trial & Chemical Engineering Research, 49(23), p. 11878-11889 (2010).
Ding, Z., Liu, L., Yu, J., Ma, R., Yang, Z., Con-centrating the extract of traditional Chinese medi-cine by direct contact membrane distillation. Journal of Membrane Science, 310, p. 539-549 (2008).
Drioli, E., Di Profio, G., Curcio, E., Progress in mem-brane crystallization. Current Opinion in Chemical Engineering, 1(2), p. 178-182 (2012).
Edwie, F., Chung, T., Development of hollow fiber membranes for water and salt recovery from highly concentrated brine via direct contact mem-brane distillation and crystallization. Journal of Membrane Science, 421, p. 111-123 (2012).
Edwie, F., Chung, T., Development of simultaneous membrane distillation-crystallization (SMDC) tech-nology for treatment of saturated brine. Chemical Engineering Science, 98, p. 160-172 (2013). El-Bourawi, M., Ding, Z., Ma, R., Khayet, M., A
framework for better understanding membrane distillation separation process. Journal of Mem-brane Science, 285(1-2), p. 4-29 (2006).
Fornari, M., Godoi, L., Cresce o reuso de água no Brasil. Saneamento Ambiental, 162, p. 12-15 (2012). (In Portuguese).
Gethard, K., Sae-Khow, O., Mitra, S., Water desalina-tion using carbon-nanotube-enhanced membrane distillation. ACS Applied Materials & Interfaces, 3(2), p. 110-114 (2011).
Gryta, M., Polyphosphates used for membrane scaling inhibition during water desalination by membrane distillation. Desalination, 285, p. 170-176 (2012). Guillen-Burrieza, E., Ruiz-Aguirre, A., Zaragoza, G.,
Arafat, H. A., Membrane fouling and cleaning in long term plant-scale membrane distillation opera-tions. Journal of Membrane Science, 468, p. 360-372 (2014).
Hitsov, I., Maere, T., De Sitter, K., Dotremont, C., Nopens, I., Modelling approaches in membrane distillation: A critical review. Separation and Puri-fication Technology, 142, p. 48-64 (2015).
Ji, X., Curci, E., Al Obaidani, S., Di Profio, G., Fontananova, E., Drioli, E., Membrane distillation crystallization of seawater reverse osmosis brines. Separation and Purification Technology, 71(1), p. 76-82 (2010).
Kern, D. Q., Process Heat Transfer. McGraw-Hill, Singapore (1965).
Kim, D., A review of desalting process techniques and economic analysis of recovery of salts from retentates. Desalination, 270(1-3), p. 1-8 (2011). Lewis, A. E., Seckler, M. M., Kramer, H. T. M., Van
Rosmalen, G. M., Industrial Crystallization: Fun-damentals and Applications, Cambridge Univer-sity Press (2015).
Madwar, K., Tarazi, H., Desalination techniques for industrial wastewater reuse. Desalination, 152, p. 325-332 (2002).
Martinez, L., Rodriguez-Maroto, J., Effects of mem-brane and module design improvements on flux in direct contact membrane distillation. Desalination, 205(1-3), p. 97-103 (2007).
Brazilian Journal of Chemical Engineering Mullin, J. W., Crystallization. Butterwoth-Heinemann,
Oxford (2001).
Pantoja, C. E., Desenvolvimento de processo para dessalinização de soluções aquosas concentradas oriundas de sistemas de tratamento de efluentes de refinarias de petróleo. Qualificação de Doutorado, Escola Politécnica da Universidade de São Paulo, São Paulo, p. 72 (2013). (In Portuguese).
Pantoja, C. E., Nariyoshi, Y. N., Seckler, M. M., Mem-brane distillation crystallization applied to brine desalination: A hierarchical design procedure. Industrial & Engineering Chemistry Research, 54(10), p. 2776-2793 (2015).
Phattaranawik, J., Jiraratananon, R., Fane, A., Heat transport and membrane distillation coefficients in direct contact membrane distillation. Journal of Membrane Science, 212(1-2), p. 177-193 (2003). Schofield, R., Fane, A., Fell, C., Heat and mass
transfer in membrane distillation. Journal of Mem-brane Science, 33(3), p. 299-313 (1987).
Termpiyakul, P., Jiraratananon, R., Srisurichan, S.,
Heat and mass transfer characteristics of a direct contact membrane distillation process for desali-nation. Desalination, 177(1-3), p. 133-141 (2005). Tun, C., Fane, A., Matheickal, J., Sheikholeslami, R.,
Membrane distillation crystallization of concen-trated salts – flux and crystal formation. Journal of Membrane Science, 257(1-2), p. 144-155 (2005). World Water Assessment Programme, The United
Nations World Water Development Report 4: Managing Water under Uncertainty and Risk. UNESCO, 1, p. 230-356 (2012).
Yang, X., Wang, R., Shi, L., Fane, A. G., Debowski, M., Performance improvement of PVDF hollow fiber-based membrane distillation process. Journal of Membrane Science, 369(1-2), p. 437-447 (2011). Yun, Y., Ma, R., Zhang, W., Fane, A., Li, J., Direct
contact membrane distillation for high concentra-tion NaCl soluconcentra-tions. Desalinaconcentra-tion, 188(1-3), p. 251-262 (2006).