ISSN 0104-6632 Printed in Brazil
www.abeq.org.br/bjche
Vol. 30, No. 03, pp. 487 - 497, July - September, 2013
Brazilian Journal
of Chemical
Engineering
LABORATORY APPARATUS TO EVALUATE
MICROALGAE PRODUCTION
L. R. S. Gris, A. C. Paim, M. Farenzena
*and J. O. Trierweiler
*Group of Intensification, Modeling, Simulation, Control and Optimization of Processes, Chemical Engineering Department, Phone: + (55) (51) 3308 3918, Fax: + (55) (51) 3308 3277,
Federal University of Rio Grande do Sul, Rua Luiz Englert, s/n. CEP: 90.040-040, Porto Alegre - RS, Brasil.
E-mail: {farenz, jorge}@enq.ufrgs.br
(Submitted: September 25, 2012 ; Revised: November 19, 2012 ; Accepted: November 21, 2012)
Abstract - The application of microalgae for energy purposes and CO2 biomitigation continues to present a
number of challenges, including the optimization of culture conditions. The application of experimental designs for microalgae cultivation is difficult, since experiments involving such microorganisms generally last days or weeks. This work proposes a multipurpose laboratory apparatus for the optimization of microalgae experimental conditions that simultaneously enables the evaluation of variables such as temperature,
irradiance, photoperiod and CO2 concentration in the aeration stream, as well as variables related to the
concentration of culture media nutrients. A case study is also presented in which temperature, concentration
of f/2 medium sodium nitrate and the effects of incident light intensity on Nannochloropsis oculata lipid
content are evaluated. Experiments were carried out following central composite designs, in batch cultivation within an airlift photobioreactor apparatus. The best experimental result was obtained at 21 °C, 119 mg/L
NaNO3 and 137 µE.m-2.s-1, corresponding to 41.8% lipids and 211.9 mg.L-1 final lipid concentrations.
Keywords: Multipurpose laboratory apparatus; Microalgae; Nannochloropsis oculata;Lipid.
INTRODUCTION
Microalgae are photosynthetic microorganisms that convert sunlight, water and carbon dioxide into biomass (Chisti, 2008). These microorganisms have generated a great deal of interest in the literature because of their high efficiency as oil producers compared to oil crops (Chisti, 2007). There is a wide range of applications for microalgae products, from high value foods (Zittelli et al., 2003) to wastewater treatment (Yoshida et al., 2009), aquiculture (Thompson et al., 1999), hydrogen production (Ghirardi et al., 2000) and even oil production, where they can be used as biodiesel (Chisti, 2007). Despite great efforts, algal biodiesel is still a long way from entering the market, mainly because of its price
(Gallagher, 2011). Developments in species selection and improvement and in production optimization are thus required in order to facilitate this process.
488 L. R. S. Gris, A. C. Paim, M. Farenzena and J. O. Trierweiler
by other microorganisms; easier biomass harvest; and greater autonomy in the control of gas exchange, amongst other aspects (Tredici, 2004; Ugwu, 2008).
In order to achieve economic viability in the use of photobioreactors for the cultivation of microalgae, both for energy purposes and for biomass usage in sectors such as food, medicines, dyes, etc., further developments are required through investments in small, medium and large scale microalgae apparatus for the purposes of data collection. To evaluate the different variables and conditions for cultivation using apparatus with low operational and capital costs, it is therefore essential to conduct several experiments in parallel. There are no works in the literature that describe multipurpose apparatus for the study of microalgae that simultaneously enables the assessment of variables such as temperature, irradiance, photoperiod, gas flow and CO2 concentra-tion in the aeraconcentra-tion stream, as well as variables related to nutrients in the culture media.
The main objective of this work is to propose and build a laboratory airlift photobioreactor apparatus to perform central composite design experiments which enables the simultaneous performance of a large number of experiments, thereby reducing total experimental time. The scope of the apparatus should enable several combinations of variables, where the best operational condition for each species can be determined with minimum total batch time.
Of the 100,000 known species of microalgae, only a small number has been assessed as a source of oil (Brennan and Owende, 2010). One of the species that shows high growth rate and lipid content is Nannochloropsis oculata (Roncarati et al., 2004). Several works in the literature have addressed the effects of cultivation variables on Nannochloropsis oculata production. Flynn et al. (1993) have studied the effect of carbon-nitrogen on algae growth. Converti et al. (2009) have studied the effect of nitrogen and temperature on growth and lipid content. Spolaore et al. (2006) have studied the effects of pH, temperature, aeration rate, and incident light intensity. (Chiu et al., 2009) have studied lipid accumulation in response to CO2 enriched aeration.
The secondary objective of this work is to illustrate the application of the proposed equipment in an experimental design not available in the literature. Despite the existence of the above-mentioned studies that involved Nannochloropsis oculata, there are no reports of studies which have evaluated simultaneously, in the same experiment, the interaction between variables such as temperature, incident light intensity and medium nitrogenous source concentration, nor their effect on
biomass and lipid concentration. This, therefore, is the scope of the experimental design proposed in this work.
THE MULTIPURPOSE AIRLIFT PHOTOBIOREACTOR APPARATUS
The apparatus proposed in this work allows us to evaluate in the same experimental design, several different variables, namely: inside the reactor – temperature, pH, nutrient medium composition, such as inorganic salts and vitamins (concentrations could be off-line monitored by some analytical technique); aeration – total flow and aeration stream composition (air and CO2); incident light – photoperiod and intensity. The apparatus consists of a metallic struc-ture with three shelves (each of 1.2 m width, 0.7 m height and 0.4 m depth) on which the photobio-reactors can be positioned, as shown in Figure 2C. Different devices were used for each controlled variable:
i) Temperature control: Fullgauge TIC-17RGTi (Brazil) temperature indicator controls, a Servilab SE 100-AG 1000 W bath refrigerator (pump connected) (Brazil), 100 and 150 W aquarium heaters (Brazil), a Texius TPGC-Mini 120 W (Brazil) centrifugal pump and plastic tanks (20 L volume). As shown in Figure 1B, an on-off control strategy was adopted to maintain the cultures at the desired temperatures by pumping water through stainless steel tubes inserted into each photobioreactor (the “U” shown in Figure 2).
ii) Photoperiod control: Novus TM 6331 (Brazil) timers and Universal Duramax Super Day light 20 W (Brazil) fluorescent lamps. The incident light intensity set is made with an adjustable voltage circuit on each shelf of the apparatus, as shown in Figure 1C.
iii) Flow set: Dwyer Instruments MMA-21 (USA) rotameters, one for each photobioreactor.
Laboratory Apparatus to Evaluate Microalgae Production 489
Figure 1: Laboratory apparatus. Schematic system representations for A Composition set, B
Temperature control, and C Photoperiod control, incident light intensity and flow sets.
A
B
C D
Figure 2: A) Frontal and B) Lateral plan of the airlift photobioreactor model. Monitoring
490 L. R. S. Gris, A. C. Paim, M. Farenzena and J. O. Trierweiler
According to Merchuk and Gluz (2002), airlift bioreactors are considered to be superior to traditional stirred-tank fermenters because they provide the main requirements for culturing micro-organisms: a gas–medium interface for the supply and removal of waste gases; the means of agitation to ensure proper nutrient distribution; the means of heat transfer (for temperature control); and a contamination-free environment; furthermore, they remain profitable in relation to fluid dynamics. This is interesting for microalgae cultivation, since airlift bioreactors demonstrate efficient mixing with low shear, high mass transfer, and low power consump-tion. Given these advantages, which have been corroborated by successful work in microalgae cultivation (Mirón et al., 2000; Xu et al., 2002), this particular photobioreactor design was chosen for the proposed apparatus.
The main advantage of the proposed apparatus is flexibility, because different combinations of variables can be implemented and it is also possible to change the type of photobioreactors and microalgae species, depending on the scope of the work. The execution time for experiments is another advantage, since at least twelve photobioreactors could be available within the apparatus. For example, a central composite design of three variables, with five replicates in the central point (totaling nineteen experiments), could be performed in only two batches.
Some improvements that could be made in the future are: replacing the rotameters, which present between 4% and 10% error, with mass flow controllers, which are more accurate; and the modification of the heat exchange system, which currently has only one 1000 W cooling bath. The acquisition of a more efficient cooling system would provide greater autonomy in performing experiments involving tem-perature. Furthermore, accuracy could also be improved, since the variation is currently approxi-mately plus or minus 0.5 degrees.
CASE STUDY – MATERIALS AND METHODS
Algal Strain and Inoculum Preparation
The strain of Nannochloropsis oculata was obtained from the Phytoplankton Ecology and Marine Microorganisms Laboratory (Federal University of Rio Grande: FURG, Brazil). Cultures were main-tained in an autoclaved liquid culture on artificial seawater (marine salt Red Sea, salinity 33 ± 1 g.L-1) enriched with f/2 nutrients (Lourenço, 2006)(Vetec
reagents, Brazil). These were kept in 6 L Erlenmeyer flasks (4 L working volume), with aeration (filtered air without carbon dioxide enrichment, 0.25 vvm, i.e., 1 L.min-1) and daily manual agitation in a refrigerated incubator. Incident light intensity was fixed at approximately 98 µE.m-2.s-1. The cells were main-tained at a controlled temperature (25 ± 1 °C) and photoperiod (12 hr light/12 hr dark). The cultures for inoculums were subcultured every 10 days by transferring cells to a fresh medium (dilution by 10).
Experimental Design
A central composite design (divided into two blocks) was performed to evaluate the influence of temperature, f/2 medium NaNO3 concentration, and incident light intensity on lipid content. The quantitative independent variable values are shown in Table 1. The central values were chosen on the basis of previous optimizations reported in the litera-ture (Spolaore et al., 2006; Chiu et al., 2009; Converti et al., 2009), although no simultaneous optimization of these three variables has so far been reported.
Table 1: Quantitative values of the encoded factors. Experimental design 1.
Factor -α -1 0 +1 +α
Temperature (°C) 19 21 24 27 29
NaNO3 concentration in f/2
medium (mg.L-1) 25 45 75 105 125
Incident light intensity
(µE.m-2.s-1) 49 68 95 122 140
Total time of cultivation was 11 days (corresponding to the end of the exponential phase) for each batch. The pre-cultured Nannochloropsis oculata was inoculated in photobioreactors at an initial biomass concentration (calculated dried weight of microalgae biomass) of 26.8 ± 1.0 mg.L-1 and 21.5 ± 0.8 mg.L-1, for experimental blocks 1 and 2, respectively.
Laboratory Apparatus to Evaluate Microalgae Production 491
concentration was 10.0 ± 1.3 mg.L-1. Total cultiva-tion time was 13 days (corresponding to the end of the exponential phase).
Table 2: Quantitative values of the encoded factors. Experimental design 2.
Factor -α -1 0 +1 +α
NaNO3 concentration in f/2
medium (mg.L-1) 100 119 165 211 230
Incident light intensity
(µE.m-2.s-1) 122 137 176 214 230
Airlift Photobioreactors
Experiments were conducted in batch mode with 12 rectangular internal loop airlift photobioreactors (6 cm optical path, 35 cm height and 3.2 L working volume). Heat transfer was carried out by pumping a controlled temperature water stream through stainless steel tubes (1/2″) located at the downcomer.
Agitation was provided through continuous air injection (without CO2 supplementation) into two porous stones placed at the bottom of the riser of each system. An aeration rate of 800 ml. min-1 (0.25 vvm) was measured with gas flow meters (rotameters). The overall volumetric mass transfer coefficient of the liquid phase (kLa) was determined using the Dynamic method (Chisti, 1989) at 19 °C and an aeration rate of 750 mL.min-1, where kLa was equal to 28.62 h-1.
The photoperiod was kept constant (12 hr light/ 12 hr dark) and the photobioreactors were illumi-nated from one side (riser). Incident light intensity was measured daily from the light-attached surface of the photobioreactor using a light meter (Instrutherm LD-200, Brazil) at the point indicated by a red dot in Figures 2A and 2B. A white blackout curtain protected the apparatus from outside interference from other light sources in the environment. Internal medium temperatures were monitored daily (and rectified, if necessary) with a bulb thermometer, at the point indicated by a blue dot in Figures 2A and 2B.
Analytical Methods
From each photobioreactor 4 ml was sampled every day, at the same time of day, in order to monitor cell growth. The evaluation of biomass density was achieved by measuring the optical density at a wavelength equal to 570 nm (Pró-Análise UV-1600 spectrophotometer, Brazil). Each
sample was diluted in order to obtain an absorbance measurement between 0.1 and 1.0, where necessary.
For each block of experiments, a calibration curve of cell dry weight (filtration on Macherey-Nagel GF-3 filters, Germany) versus absorbance was established. For each batch experiment, therefore, growth curves (not shown) and biomass final concentrations were determined on the basis of absorbance. Indicator paper was used for the daily monitoring of pH (Merck, range 0-14, USA) and remained between 7 and 8 throughout the experi-mental period.
Lipid extraction was conducted according to a modified Folch method combined with the use of ultrasound (Brum et al., 2009; Lee et al., 2010). Dry biomass was obtained by centrifugation (3044 g, 5 min, 10 °C) and lyophilization (to a constant weight). A sample (500 mg) was macerated with a chloroform/methanol solution (2:1, v/v, total 30 ml) in a porcelain crucible and was subsequently kept in sonication for 90 min (Ultrasonic Bath Unique 1400A MaxiClean 40 kHz, Brazil). The solid content of the sample was removed by centrifugation (2214 g, 8 min, 4 °C) and the phase containing the lipids was subjected to additions of 0.88% KCl solution (6 mL), followed by chloroform/methanol (1:1, v/v, total 4 ml) and finally by hand agitation in triplicate. The remaining lipid phase was filtered with anhydrous Na2SO4, recovered in a previously weighed round bottom flask and submitted to solvent evaporation in a rotary evaporator (70 °C, vacuum). Following this process, the round bottom flask containing lipids was kept in a desiccator for 10 minutes and then weighed to determine the lipid mass.
Three equations were determined experimentally in relation to the final biomass concentration of Nannochloropsis oculata (y, in mg.L-1) and optical density (x), two for block Experimental Design 1 (Equations (1) and (2), one for each batch performed) and one for Experimental Design 2 (Equation (3), one single batch), with R2 = 99.2%, 97.9%, and 97.1%, respectively.
y=247.7x−9.0 (1)
y=259.1x 8.8− (2)
y=236.6x−20.4 (3)
492 L. R. S. Gris, A. C. Paim, M. Farenzena and J. O. Trierweiler
consistent with the work of Spolaore et al. (2006), in which different experimental conditions did not affect the linear relationship between absorbance and dry weight.
Statistical data analysis was performed using Statistica 10.0 (StatSoft Incorporation) Software. The linear, quadratic and interaction factors of the variables were calculated. The significance level (α) was equal to 0.05%, which attests to the significance of the results with 95% confidence for the response variables. A p-value of less than 0.05 was considered to indicate significance. F-tests were carried out to evaluate the significance of the fitted models at 5% (Montgomery, 2001).
RESULTS AND DISCUSSION
First Experimental Design
The design matrix of the central composite design and the experimental results are shown in Table 3. The reduced models fitted for final biomass concentration and lipid content, shown in Equations (4) and (5), respectively, satisfactorily explained the effect of NaNO3 concentration in f/2 medium (N) and incident light intensity (I), with an explained variation of data equivalent to 82.18% and 88.62%, respectively.
1
2
biomass (mg.L ) 366.6 45.4 N
19.1 N 47.4 I
− = + ⋅
− ⋅ + ⋅ (4)
2
lipid (%) 22.14 2.61 N 1.39 I
1.52 I 2.21 N I
= − ⋅ + ⋅
+ ⋅ + ⋅ ⋅ (5)
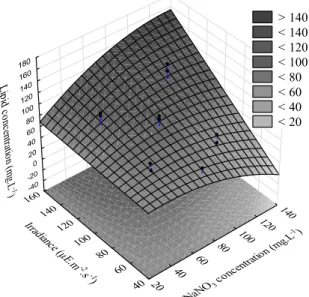
The positive values of the linear regression coefficients associated with N and I (Equation (4)) indicate that an increase in final biomass concentra-tion is favored by an increase in these variables’ values. The negative value of the quadratic regres-sion coefficient associated with N demonstrates a parabolic data profile, which suggests a maximum for this variable.
The positive values of the regression coefficients associated with I (Equation (5)) indicate that an increase in lipid content is favored by increasing the value of this variable. The same applies to the interaction effect between N and I, which shows that the lipid content increases in proportion to the combined effect of the two variables. The negative value of the linear regression coefficient associated with N, however, shows that the relationship between this variable and lipid content is inversely proportional, which is similar to the results obtained by Converti et al. (2009).
Table 3: Central composite design parameter levels of (encoded values). Experimental design 1.
Independent variables * Dependent variables Experiment T N I concentration (mg.LBiomass final -1)
Lipid content (%)
Lipid concentration (mg.L-1)
1 0 0 0 390.6 24.42 95.4
2 0 0 0 397.3 24.35 96.7
3 0 0 0 433.7 23.47 101.8
4 -1 -1 -1 274.7 30.36 83.4
5 +1 -1 -1 246.0 28.54 70.2
6 -1 +1 -1 333.2 21.38 71.2
7 +1 +1 -1 299.5 18.73 56.1
8 -1 -1 +1 381.7 26.17 99.9
9 +1 -1 +1 360.1 29.00 104.4
10 -1 +1 +1 482.7 24.86 120
Bl
oc
k
1
11 +1 +1 +1 453.0 29.22 132.4
12 -α 0 0 328.1 18.15 59.6
13 +α 0 0 338.0 18.13 61.3
14 0 -α 0 218.2 25.86 56.4
15 0 +α 0 404.3 16.53 66.8
16 0 0 -α 309.5 21.42 66.3
17 0 0 +α 383.1 26.65 102.1
18 0 0 0 353.5 22.28 78.8
Bl
oc
k
2
19 0 0 0 366.0 18.79 68.8
*
Laboratory Apparatus to Evaluate Microalgae Production 493
This inverse proportionality is consistent, since algae generally respond to nitrogen deprivation as a command to store energy and then react to this response by accumulating lipids. This happens naturally at the end of the exponential growth phase of batch culture when nutrients are scarce (Brown et al., 1997).
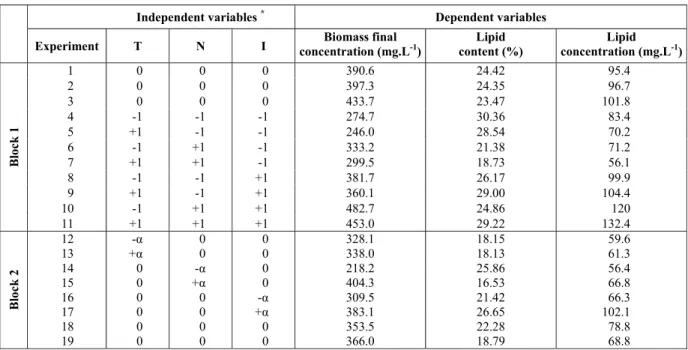
In the region bounded by the experimental points (Figure 3), experimental conditions that favor the production of biomass do not correspond exactly with those that favor the accumulation of lipids and this represents a challenge for the joint optimization of these two variables. However, if one analyzed the
region above the upper experimental limits for N and I, an extrapolation of data would suggest that it is possible to obtain satisfactory results for both responses at higher values for these variables, as suggested in Figure 4, provided by Equation (6) (in which only the significant factors were considered, with an explained variation of the data equivalent to 90.94 %).
To examine whether this behavior is confirmed, a second optimization step was then performed. The values chosen for N and I were precisely those in which the step one extrapolation suggests more total lipid concentration. 20 40 60 80 100 120 140 NaNO
3 co
ncentr
ation (
mg.L -1) 40 60 80 100 120 140 160 Irra dian
ce (µE .m-2
.s-1)
100 200 300 400 500 600 B iom as s c on ce nt ra tio n (m g.L -1 ) (a) 20 40 60 80 100 120 140 NaNO
3 co
ncent ration (mg.L -1) 40 60 80 100 120 140 160 Irradianc e (µ E.m-2 .s-1)
5 10 15 20 25 30 35 40 45 L ip id
s (%
) > 40 < 36 < 31 < 26 < 21 < 16 < 11 (b) > 500 < 440 < 340 < 240 < 140
Figure 3: Experimental design 1. Response surfaces for biomass concentration (a) and
lipid content (b) in the reduced fitted models. Dots represent experimental data.
20 40 60 80
100 120 140
NaNO
3 co ncen
tratio
n (mg
.L-1)
40 60 80 100 120 140 160 Irra dian
ce (µE .m-2
.s-1) -40 -20 0 20 40 60 80 100 120 140 160 180 Li p id c o nc en tratio n (m g.L-1 ) > 140 < 140 < 120 < 100 < 80 < 60 < 40 < 20
Figure 4: Experimental design 1.Response surfaces for lipid concentration. Dots represent
494 L. R. S. Gris, A. C. Paim, M. Farenzena and J. O. Trierweiler
Second Experimental Design
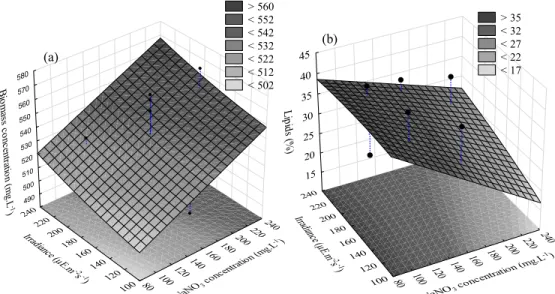
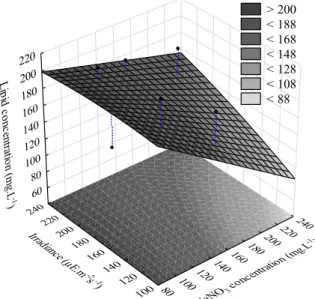
Experimental results are presented in Table 4. If we only take statistically significant effects into account, adjusted models 7 and 8 - for biomass and lipid content respectively - reasonably explain the effect of NaNO3 concentration in f/2 medium (N) and incident light intensity (I), with an explained variation of data equivalent to 72.81% and 82.29%, respectively. For lipid concentration (Equation (9)),
the data explanation was equal to 72.57%. Surface responses are presented in Figures 5 and 6.
1 2
biomass (mg.L )− =550.5 13.5 N+ ⋅ −21.3 I⋅ (7)
2
lipid (%) 26.26 4.78 N= − ⋅ +5.87 I⋅ +4.48 N I⋅ ⋅ (8)
1
2
lipid (mg.L ) 144.18 21.92 N
24.75.I 21.13.N.I
− = − ⋅
+ + (9)
Table 4: Parameter levels of central composite design (encoded values). Experimental design 2.
Independent variables *
Dependent variables Experiment N I Biomass final concentration
(mg.L-1)
Lipid content (%)
Lipid concentration (mg.L-1)
1 -1 -1 507.0 41.8 211.9
2 +1 -1 531.1 38.0 201.8
3 -1 +1 536.8 20.8 111.7
4 +1 +1 533.2 34.9 186.1
5 -α 0 496.3 37.7 187.1
6 +α 0 524.0 34.8 182.4
7 0 -α 513.4 27.4 140.7
8 0 +α 567.3 17.4 98.7
9 0 0 560.2 28.0 156.9
10 0 0 563.8 25.9 146.0
11 0 0 552.4 29.1 160.7
N = NaNO3 concentration in f/2 medium, I = incident light intensity.
80 100 120140
160180
200220240
NaNO 3 co
ncent ration (m
g.L-1)
100 120 140 160
180
200 220 240
Irradian ce (
µE.m-2 s-1)
490 500 510 520 530 540 550 560 570 580
B
io
m as s co nc en tra tio
n
(m
g.
L-1
)
> 560 < 552 < 542 < 532 < 522 < 512 < 502
80 100 120
140 160 180
200 220 240
NaNO
3 co
ncentra tion (m
g.L-1)
100 120 140 160 180
200 220 240
Irra dian
ce (µE .m-2
s)-1
15 20
25 30 35 40 45
L
ipid s (%
)
> 35 < 32 < 27 < 22 < 17
(a)
(b)
Figure 5: Experimental design 2. Response surfaces for the biomass concentration (a)
Laboratory Apparatus to Evaluate Microalgae Production 495
80 100
120140 160180
200220
240
NaNO
3 co
ncentr ation (
mg.L
-1)
100
120 140
160
180
200 220 240
Irradian ce (
µE.m-2 s-1)
60 80
100 120 140 160 180 200
220
L
ip
id c
o
nc en tra tio n (m
g.
L
-1
)
> 200 < 188 < 168 < 148 < 128 < 108 < 88
Figure 6: Experimental design 2. Response surfaces for lipid concentration. Dots
represent experimental data.
Once again we found an inverse relationship between biomass concentration and lipid content, as can be seen in the surfaces. Within the region of greater incident light intensity values, however, lipid concentration is only slightly affected by NaNO3 concentration. This behavior is interesting and may suggest that in conditions of higher light intensity a variation in NaNO3 concentration does not have a relevant impact on lipid concentration.
Although the results obtained in this work do not present the same maximum biomass concentration as others performed in semicontinuous and continuous regimes, they are very similar to those found in batch mode in the work of Ohse et al. (2009), where 828 mg.L-1 of biomass was produced, under condi-tions which, with the exception of the photoperiod, were similar. It is important to highlight the higher lipid content, around 40%, obtained by the cultures in this work, which could be associated with micro-organism stress.
CONCLUSIONS
This work proposed an experimental apparatus to evaluate microalgae production. The experimental apparatus we constructed allowed for the performance of several simultaneous experiments, reducing total execution time. The flexibility of the proposed apparatus was illustrated by two experimental designs, where the temperature, f/2 medium sodium nitrate concentration and incident light intensity effects on Nannochloropsis oculata were evaluated.
Other species and variables could be studied in the future, including: new experiments with aeration stream CO2 enrichment; changes to nutrient concen-tration, irradiance, photoperiod and temperature; and production in semicontinuous and continuous modes. Furthermore, should sufficient interest be generated, other kinds of photobioreactors could be studied within the apparatus. This model could be applied to microalgae study research centers and we consider this to be the work’s greatest contribution.
In terms of the case study, of the variables studied, the interaction between NaNO3 medium concentration and irradiance was particularly important and the synergy between these variables should always be considered for Nannochloropsis oculata lipid optimization. The best experimental result obtained was 221.9 mg.L-1 for a final lipid concentration under conditions of 21 °C, NaNO3 concentration 119 mg.L-1 and 137 µE.m-2.s-1.
Since Nannochloropsis oculata is a very robust species, i.e., it works well under changing environmental conditions, one can feasibly assert that it is possible to maintain excellent lipid production and increase productivity, which therefore classifies this species as one of the most promising in the use of microalgae for energy purposes.
ACKNOWLEDGEMENTS
496 L. R. S. Gris, A. C. Paim, M. Farenzena and J. O. Trierweiler
de Abreu, from LABFITO (FURG), for providing the Nannochloropsis oculata strain; and the scientific and technological initiation students Aline Bernardi, Cauã Brum Borges, and Elis Cristina Domeneghini, for their experimental contributions.
NOMENCLATURE
I incident light intensity
N NaNO3 concentration in f/2 medium NaNO3 sodium nitrate
T temperature v/v volume per volume
vvm volume per volume per minute
x optical density
y Nannochloropsis oculata biomass concentration
mg.L-1 milligram per liter
µE.m-2.s-1 microEinstein per square meter per second
REFERENCES
Borowitzka, M. A., Commercial production of microalgae: Ponds, tanks, tubes and fermenters. Journal of Biotechnology, 70,313-321 (1999). Borowitzka, M. A., Culturing microalgae in outdoor
ponds. Algal Culturing Techniques, R. A. Andersen, Elsevier Inc.205-218 (2005).
Brennan, L. and Owende, P., Biofuels from microalgae - A review of technologies for production, processing, and extractions of biofuels and co-products. Renewable and Sustainable Energy Reviews, 14(2), 557-577 (2010).
Brown, R., Jeffrey, S. W., Volkman, J. K. and Dunstan, G. A., Nutritional properties of mi-croalgae for mariculture. Aquaculture, 51, 315-331 (1997).
Brum, A. A. S., De Arruda, L. F. and Regitano-d'Arce, M. A. B., Extraction methods and quality of the lipid fraction of vegetable and animal samples. Química Nova, 32(4),849-854 (2009). Chisti, M. Y., Airlift Bioreactors. Elsevier Applied
Science, London, New York, Pages (1989). Chisti, Y., Biodiesel from microalgae. Biotechnology
Advances, 25(3),294-306 (2007).
Chisti, Y., Biodiesel from microalgae beats bioethanol. Trends in Biotechnology, 26(3), 126-131 (2008).
Chiu, S. Y., Kao, C. Y., Tsai, M. T., Ong, S. C., Chen, C. H. and Lin, C. S., Lipid accumulation
and CO2 utilization of Nannochloropsis oculata in response to CO2 aeration. Bioresource Tech-nology, 100(2),833-838 (2009).
Converti, A., Casazza, A. A., Ortiz, E. Y., Perego, P. and Del Borghi, M., Effect of temperature and nitrogen concentration on the growth and lipid content of Nannochloropsis oculata and Chlorella vulgaris for biodiesel production. Chemical Engineering and Processing: Process Intensification, 48(6),1146-1151 (2009).
Flynn, K. J., Davidson, K. and Leftley, J. W., Carbon-nitrogen relations during batch growth of Nannochloropsis oculata (Eustigmatophyceae) under alternating light and dark. Journal of Applied Phycology, 5(4),465-475 (1993).
Gallagher, B. J., The economics of producing biodiesel from algae. Renewable Energy, 36(1), 158-162 (2011).
Ghirardi, M. L., Zhang, L., Lee, J. W., Flynn, T., Seibert, M., Greenbaum, E. and Melis, A., Microalgae: A green source of renewable H2. Trends in Biotechnology, 18(12),506-511 (2000). Lee, J. Y., Yoo, C., Jun, S. Y., Ahn, C. Y. and Oh, H.
M., Comparison of several methods for effective lipid extraction from microalgae. Bioresource Technology, 101,(1 suppl.) (2010).
Lourenço, S. d. O., Cultivo de Microalgas Marinhas: Princípios e Aplicações. RiMa, Pages (2006). (In Portuguese).
Merchuk, J. C. and Gluz, M., Bioreactors, Air-lift Reactors. Encyclopedia of Bioprocess Technology. M. C. Flickinger and S. W. Drew, John Wiley & Sons, Inc (2002).
Mirón, A. S., Camacho, F. G., Gómez, A. C., Grima, E. M. and Chisti, Y., Bubble-column and airlift photobioreactors for algal culture. AIChE Journal, 46(9),1872-1887 (2000).
Montgomery, D. C., Design and Analysis of Experiments. John Wiley & Sons, Inc, Pages (2001).
Ohse, S., Derner, R. B., Ozório, R. A., Braga, M. V. d. C., Cunha, P., Lamarca, C. P. and Dos Santos, M. E., Production of biomass and carbon, hydrogen, nitrogen and protein contents in microalgae. Ciência Rural, 39(6), 1760-1767 (2009).
Laboratory Apparatus to Evaluate Microalgae Production 497
Spolaore, P., Joannis-Cassan, C., Duran, E. and Isambert, A., Commercial applications of micro-algae. Journal of Bioscience and Bioengineering, 101(2),87-96 (2006).
Thompson, F. L., Abreu, P. C. and Cavalli, R., The use of microorganisms as food source for Penaeus paulensis larvae. Aquaculture, 174(1-2), 139-153 (1999).
Tredici, M. R., Mass production of microalgae: photobioreactors. Handbook of Microalgal Culture: Biotechnology and Applied Phycology. A. Richmond, Blackwell Publishing,178-214 (2004). Ugwu, C. U. A. H., Uchiyama, H., Photobioreactors
for mass cultivation of algae. Bioresource
Technology, 99,4021-4028 (2008).
Xu, Z., Baicheng, Z., Yiping, Z., Zhaoling, C., Wei, C. and Fan, O., A simple and low-cost airlift photobioreactor for microalgal mass culture. Biotechnology Letters, 24(21),1767-1771 (2002). Yoshida, K., Ishii, H., Ishihara, Y., Saito, H. and
Okada, Y., Bioremediation potential of formalde-hyde by the marine microalga Nannochloropsis oculata ST-3 strain. Applied Biochemistry and Biotechnology, 157(2),321-328 (2009).