ISSN 0104-6632 Printed in Brazil
Brazilian Journal
of Chemical
Engineering
Vol. 20, No. 04, pp. 363 - 374, October - December 2003
THE EFFECTS OF GEOMETRY AND OPERATIONAL
CONDITIONS ON GAS HOLDUP, LIQUID
CIRCULATION AND MASS TRANSFER
IN AN AIRLIFT REACTOR
E.R. Gouveia
1, C.O. Hokka
1and A.C.Badino-Jr
1*
Department of Chemical Engineering, Universidade Federal de S. Carlos Phone (016) 260-8264, Fax (016) 260-8266, P.O. Box 676, Via Washington Luiz, Km 235, CEP 13565-905, São Carlos - SP, Brazil.
E-mail: badinojr@deq.ufscar.br
(Received: May 29, 2002 ; Accepted: May 28, 2003)
Abstract - In airlift reactors transport phenomena are achieved by pneumatic agitation and circulation occurs in a defined cyclic pattern through a loop. In the present work, the effect of geometrical relations on gas holdup and liquid velocity, and consequently on the gas-liquid mass transfer coefficient, was studied in a 6-liter airlift bioreactor with AD/AR = 0.63; AD, downcomer cross-sectional area, and AR, riser cross-sectional area.
Measurements of the volumetric oxygen transfer coefficient (kLa) were taken in a water-air system using a
modified sulfite oxidation method. Different conditions were examined by varying parameters such as superficial air velocity in the riser (UGR), bottom clearance (d1) and top clearance (d2). It was observed from
the experimental results that d1 and d2 have a remarkable effect on kLa values. The effect is due to their
influence on gas holdup and liquid velocity, consequently affecting kLa. Superficial air velocity in the riser
(UGR) ranged from 0.0126 to 0.0440 m.s-1 and kLa varied between 40 to 250 h-1, whereas gas holdup (ε)
reached values up to 0.2. The volumetric oxygen transfer coefficient (kLa), gas holdup in the riser (εR) and
downcomer (εD) and superficial liquid velocity in the riser (ULR) for all the geometrical relations were
successfully correlated with dimensionless numbers, namely, the Sherwood number (Sh) and the Froude number (Fr) as well as with geometrical relations such as the bottom space ratio (B = d1/DD)and top space
ratio (T = (d2 + DD)/DD).
Keywords: airlift reactor, oxygen transfer, gas holdup, hydrodynamics, kLa.
INTRODUCTION
Non conventional bioreactors are currently the focus of studies in many biochemical engineering laboratories, since the success of an industrial fermentation process depends heavily on the efficiency of the reactor. Particularly oxygen transfer and the corresponding energy input necessary to meet the oxygen demand strongly affects production costs. Airlift reactors are agitated pneumatically and circulation takes place in a defined cyclic pattern
through a loop, which divides the reactor into two zones: a flow-upward and a flow-downward zone. The gas-sparged zone or the riser, has higher gas holdup than the relatively gas-free zone, the downcomer, where the flow is downward (Chisti, 1989).
mixing and extended aseptic operation, made possible by the absence of stirrer shafts, seals and bearings, are important advantages of airlift reactors in fermentation applications (Chisti and Moo-Young, 1987; Chisti, 1989; Moresi, 1981).
In the concentric-tube airlift bioreactor, some geometrical parameters affect gas holdup, liquid circulation, mixing time and the volumetric oxygen transfer coefficient. Extensive study of reactor hydrodynamics and reactor geometry enhances the importance of the geometrical parameters in the design and scale-up of concentric-tube airlift bioreactors (Gavrilescu and Tudose, 1998a, b and c). Particularly in recent work, the performance of airlift reactors has been studied in terms of oxygen transfer capability for further utilization in fed-batch cultures (Gallindez-Mayer et al., 2001) and in cultivations with a pellet-type growing microorganism (Freitas and Teixeira, 2001). The latter authors mention that results in the literature for mass transfer in airlift reactors vary widely and are contradictory, since the reactors and experimental procedures are all different. On the other hand, bench scale (1 to 10 liters) reactors are the most practical for development of new bioprocesses, particularly those dealing with valuable metabolites and utilizing somewhat expensive components. This is the case in the production of biologically active substances by filamentous microorganisms or hybridoma cells, which are very sensitive to shear stress, while demanding na appropriate supply of oxygen. So far, little work has focused on the hydrodynamics and mass transfer performance of small-scale airlift reactors in view of establishing operational conditions for batch, fed-batch and even continuous cultivation of cells.
In the present work the effects of geometrical factors upon gas holdup and liquid velocity, and
consequently on the mixing and mass transfer coefficient (kLa), was studied in a concentric-tube
airlift bioreactor with six-liter working volume for further utilization in bioprocess development. Mixing time and the volumetric oxygen transfer coefficient (kLa) were measured under different
conditions by varying the superficial air velocity in the riser (UGR), bottom clearance (d1) and top
clearance (d2) in a water-air system.
MATERIALS AND METHODS
Equipment
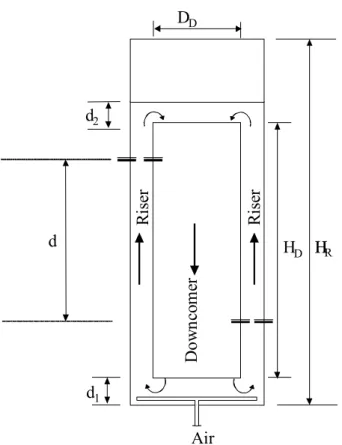
A scheme of the concentric-tube airlift reactor used in this work with dimensions given in Table 1 is
shown in Figure 1. Riser diameter, DR, is an
equivalent diameter, calculated as DR = (4/Π(AT –
AD))1/2 (m2), where AT is the total superficial area
and AD, the downcomer superficial area (m2). It was
made of glass, with the bottom and top plates made of rigid nylon. Air sparger and other pipes were made of stainless steel. The distance from the reactor base to the draft tube (d1) and the distance from the
top of the draft tube to the liquid level (d2) were
changed within the range of 0.025 to 0.045 m and of 0 to 0.040 m, respectively.
For determination of kLa, experiments were
carried out with aqueous sulfite solution and air as the gaseous phase. Air was sparged through a 0.114 m ring, with 35 holes with a diameter of 0.0007 m and a superficial air velocity in the riser (UGR) set
within the range of 0.0126 to 0.0440 m.s-1. Airflow rates were measured with a mass flowmeter from Cole Parmer (series 33116-42). All experimental runs were carried out at atmospheric pressure and a temperature of 280C.
Table 1: Geometrical characteristics of the airlift reactor
Dimension – Symbol Value (m)
Riser Diameter - DR 0.100
Downcomer Diameter - DD 0.080
Bottom Clearance - d1 0.025; 0.035; 0.045
Top Clearance - d2 0.000; 0.020; 0.040
Inner Tube Height - HD 0.37
Pressure Measurement Distance - d 0.13
HD H
d1
d2
DD
DT
HR
d
Ri
se
r
Do
w
n
co
m
er
Ri
se
r
Air
Figure 1: Schematic view of the concentric-tube airlift reactor
Gas Holdup
The total gas holdup (εT) was determined by the
volume expansion method, while for the riser (εR)
and downcomer (εD) zones, the manometer method
was used. Chisti (1989) describes both methods in details. An electronic pressure meter model SC 990 from T&S – Equipamentos Eletrônicos, S. Carlos SP (Brazil) was utilized to measure the pressure drop between the riser and downcomer for each set of experiments. The distance between the two data acquisition points (d) was 0.13 m (Figure 1). The average of three recorded values was used for holdup calculation according to the following equation:
L i
L G L G
P
( )g
ρ ∆
ε = −
ρ − ρ ρ − ρ d (1)
where subscript “i” stands for D (downcomer) or R (riser).
Characterization of the Liquid Phase
Acid solution was used as a tracer to evaluate mixing time (tm), circulation time (tC) and linear or
interstitial liquid velocity (VL) by analysis of the pH
forcing function response data. Mixing time (tm)
was defined as the time required to reach 95% of the final pH value after addition of the tracer. Initially, the airlift reactor was filled with 6 liters of tap water and the air was turned on up to the point of maximum flow rate to saturate the water with oxygen. After 5 minutes, aeration was set to the desired value and pH was adjusted with HCl 2N solution to 6.0 (± 0.1). Then the tracer, a 10 mL citrate buffer 1M (pH 3.4), was injected into the reactor exactly in the center of the liquid level, at the top of the downcomer zone. Meanwhile, a chart recorder was switched on to monitor the pH in the bioreactor via a New Brunswick (NBS, Edison NJ, USA) pH meter/controller with an Ingold probe. From the time interval between two tracer peaks, circulation time (tC) was measured.
The liquid linear velocity in the riser section (VLR) can be estimated from circulation time (tC) by
the following procedure. Average liquid linear velocity (VL) is calculated from circulation time (tC)
given by equation (2):
D 1
L
C
2 H d d
V
t
+ +
= 2 (2)
Circulation time (tC) is the sum of the time which
elapsed in the riser (tR) and that which elapsed in the
downcomer (tD):
tC = tR + tD (3)
and tR and tD are defined as
D 1 2
R
LR
H d / 2 d /
t
V
+ +
= 2 (4)
D 1 2
D
LD
H d / 2 d /
t
V
+ +
= 2 (5)
Furthermore, the continuity criterion (ULR AR =
ULD AD) can be used to show the existence of the
following relationship between the liquid linear velocities in the riser (VLR) and the downcomer
(VLD) (Chisti, 1989):
LR R R LD D D
V (1− ε ) A =V (1− ε ) A (6)
By substituting equations (3), (4) and (5) into equation (2), we obtain
LR LD L
LR LD
2 V V
V
V V
=
+ (7)
Thus, by measuring circulation time (tC), the
liquid linear velocities in the riser (VLR) and in
the downcomer (VLD) can be calculated as
follows:
D 1 2 D D
LR
C R
H d d A (1- )
V 1
t A (1
+ + ε
= +
ε
- R)
(8)
D 1 2 R R
LD
C D
H d d A (1- )
V 1
t A (1
+ + ε
= +
ε
- D)
4
(9)
Measurement of the Volumetric Oxygen Transfer Coefficient
The volumetric oxygen transfer coefficient (kLa) was
determined by a modified sulfite method (Vilaça et
al., 2000). Initially, distilled water was added to the reactor. Air was turned on and the airflow rate was adjusted to the desired value. Enough copper sulfate crystal catalyst to give 0.7 g.L-1 was added and dissolved. Enough sodium sulfite crystals to give 8.83 g.L-1 was added to the reactor and the recorder, coupled to a dissolved oxygen analyzer (New Brunswick Scientific Co., Edison NJ, USA), was turned on. The DO analyzer was linked to the DO probe placed in the riser, as described above.
The reaction between sodium sulfite and oxygen in the liquid phase is given by the stoichiometric equation
4 CuSO
2 3 2 2
Na SO +1/ 2 O →Na SO (10)
The amount of sodium sulfite added was enough to maintain the dissolved oxygen concentration around zero during a long time period, increasing the accuracy of the method. The time (∆t) necessary to consume all the sodium sulfite was determined by the rise in dissolved oxygen level. The time interval varied from around 30 minutes to 3 hours. The dissolved oxygen, DO, rapidly fell to zero (in a few seconds), and this fact was easily detected since the slope of the DO curve is very steep, abruptly leveling off at zero or a near-zero level. Also, the rise in the DO curve is steep and can be easily observed. The error should be around the range of a few seconds to 30 minutes, at the most. Actually this method is utilized by New Brunswick Inc. to evaluate the oxygen transfer capabilities of their fermentors. This method (modified sulfite oxidation) was utilized to have a standard reference for comparison with commercial fermentors. Under these conditions, the reaction rate is much higher than diffusion through the gas-liquid interface and the process is diffusion-controlled. Therefore the volumetric oxygen transfer rate, NV (molO2.L-1.s-1), can be determined from the
stoichiometry of Equation (10), leading to Equation (11).
V
0.5 n N
V t
=
∆ (11)
where n is the number of moles of Na2SO3 consumed
in the reaction and V is the total liquid volume in the reactor.
The volumetric oxygen transfer coefficient (kLa)
can be determined by Equation (12).
V L * N k a C C =
− (12)
transfer area per unit volume, C* is the saturated-oxygen concentration and C is the dissolved saturated-oxygen concentration; during ∆t, C = 0.
bubble disengagement and lower gas holdup. Mention should be made that when d2 = 0, measured
with UGR = 0, the volume of liquid is smaller.
Therefore for a given airflow rate, εR and εD are
higher. The importance of studying the d2 = 0
condition lies in the fact that this equipment will also be utilized as a single and repeated fed-batch reactor. The first step will be cultivation with minimum volume as a batch. This step can last for several hours to a few days. After this step, feeding with concentrated medium will take place.
For each measure, the reactor content was replaced with distilled water and the above procedure was repeated.
RESULTS AND DISCUSSION
A set of experiments was conducted using three values of d1 (0.025, 0.035 and 0.045 m), three values
of d2 (0, 0.020 and 0.040 m) and six values of UGR
(0.0126-0.0440 m.s-1). The ratio between downcomer and riser areas was AD/AR = 0.63. Figure 2 shows the
results obtained for the gas holdup in the riser (εR)
and in the downcomer (εD) zones. It was observed
that the gas holdup in both zones increases with the decrease in bottom clearance (d1). This fact was also
observed by Gravilescu and Tudose (1998a) while working with three large concentric-tube airlift reactors of 70, 2,500 and 5,200 liters.
Similarly to the riser (εR) and downcomer (εD) gas
holdup, the superficial liquid velocity in the riser (ULR) depends on the geometrical characteristics. In
the riser, ULR depends on the superficial air velocity
in the raiser (UGR) and on the reactor geometrical
characteristics, as shown in Figure 3.
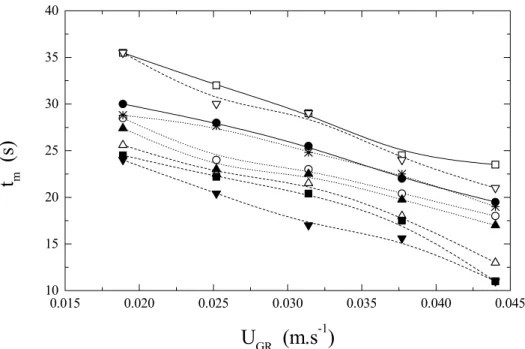
Figure 4 shows the effect of superficial air velocity in the raiser (UGR) on mixing time (tm). It
can be observed that the larger the top clearance (d2),
the higher is the mixing time (tm). Similarly, when d1
is increased, mixing time decreases for constant d2.
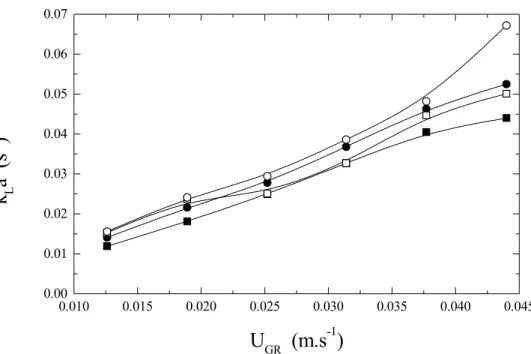
The experimental values of the volumetric oxygen transfer coefficient (kLa), obtained for six
different values of superficial air velocity in the riser (UGR) and four different pairs of d1 and d2, are given
in Figure 5. Results show that kLa was higher for
both d1 = 0.045 m and d2 = 0.040 m. This behavior is
directly associated with the smaller values of mixing time (tm), which led to higher liquid circulation
velocity under this geometrical relationship. Higher εi values were observed for d2 = 0,
particularly for larger values of UGR. Regardless of d1
values, for d2 > 0.020m, εR and εD values were very
similar. However, when d2 = 0, εR and εD are very
large, particularly for higher UGR. Working with d2
from 0 to 0.28 m (draft-tube height = 1.68 to 8.26 m) Gravilescu and Tudose (1998a) also observed this effect. Probably, above a certain critical value of d2
the drag of bubbles is hindered, resulting in faster
0.010 0.015 0.020 0.025 0.030 0.035 0.040 0.045 0.00
0.03 0.06 0.09 0.12 0.15 0.18 0.21
(a)
ε
i(-)
0.010 0.015 0.020 0.025 0.030 0.035 0.040 0.045 0.00
0.03 0.06 0.09 0.12 0.15 0.18
(b)
ε
i(-)
U
GR(m.s
-1)
0.010 0.015 0.020 0.025 0.030 0.035 0.040 0.045 0.00
0.03 0.06 0.09 0.12 0.15
(c)
ε
i(-)
U
GR(m.s
-1)
Figure 2: Gas holdup in the riser (εR) and downcomer (εD) zones of the concentric-tube airlift reactor
as a function of superficial air velocity (UGR). a) d1 = 0.025 m, b) d1 = 0.035 m and
c) d1 = 0.045 m. εR: (C - d2 = 0.000 m), (A - d2 = 0.020 m), (H - d2 = 0.040 m),
0.015 0.020 0.025 0.030 0.035 0.040 0.045 0.060
0.065 0.070 0.075 0.080
U
LR(
m
.s
-1
)
U
GR(m.s
-1)
Figure 3: Liquid superficial velocity in the riser zone (ULR) as a function of superficial air velocity (UGR): __
__: d1 = 0.025 m and d2 = 0.000 m, ...Ο...: d1 = 0.025 m and d2 = 0.020 m, --U--: d1 = 0.025 m
and d2 = 0.040 m, __V__: d1 = 0.035 m and d2 = 0.000 m, ...¼ ...: d1 = 0.035 m and d2 = 0.020 m,
----: d1 = 0.035 m and d2 = 0.040 m, __A__: d1 = 0.045 m and d2 = 0.000 m, ...S...:
d1 = 0.045 m and d2 = 0.020 m, --T--: d1 = 0.045 m and d2 = 0.040 m
0.015 0.020 0.025 0.030 0.035 0.040 0.045 10
15 20 25 30 35 40
t
m(s)
U
GR(m.s
-1)
Figure 4: Reactor mixing time (tm) as a function of superficial air velocity (UGR). __ __: d1 = 0.025 m and
d2 = 0.000 m,...Ο...: d1 = 0.025 m and d2 = 0.020 m, --U--: d1 = 0.025 m and d2 = 0.040 m, __V__: d1 = 0.035 m and
d2 = 0.000 m, ...¼ ...: d1 = 0.035 m and d2 = 0.020 m, ----: d1 = 0.035 m and d2 = 0.040 m, __A__: d1 = 0.045 m and
0.010 0.015 0.020 0.025 0.030 0.035 0.040 0.045 0.00
0.01 0.02 0.03 0.04 0.05 0.06 0.07
k
La (
s
-1
)
U
GR(m.s
-1)
Figure 5: Volumetric oxygen transfer coefficient (kLa) as a function of superficial air velocity
(UGR). C : d1 = 0.025 m and d2 = 0.00 m, A : d1 = 0.025 m and d2 = 0.04 m,
: d1 = 0.045 m and d2 = 0.00 m, Ο : d1 = 0.045 m and d2 = 0.040 m
From the results, it can be observed that the gas holdup (εi), the superficial liquid velocity in the riser
(ULR) and the volumetric oxygen transfer coefficient
(kLa) were clearly affected by the geometrical
characteristics of the bioreactor, making possible the application of correlations between these variables and the geometrical factors, as proposed by Gavrilescu and Tudose (1998a, b and c). The correlations obtained from the experimental results for each gas holdup are as follows:
GR
R
U Fr
g D
= (18)
The main variable affecting partial gas holdup is top clearance, d2 in variable T. Gavrilescu and
Tudose (1998a) observed that the Froude number (Fr) was the variable that most affected gas holdup in any bioreactor zone. However, in the present work, this was not observed, probably due to the fact that the range of superficial gas velocities in the riser (UGR), from 0.0126 to 0.0440 m.s-1, was too narrow.
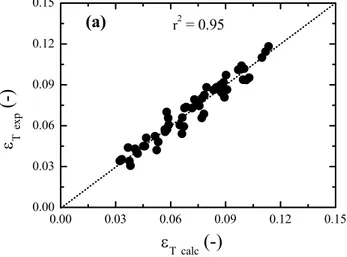
Gavrilescu and Tudose (1998a) worked in the range of UGR between 0.01 and 0.11 m.s-1. Figure 6
contains the experimental values of gas holdup and values calculated from equations (13), (14) and (15). The dispersion of data for εR and εD is due to
oscillations in the digital electronic pressure meter readings used for calculation of holdup. The full range of the “electronic pressure meter” (pressure transducer) is 200 cm H2O and accuracy is 0.25% of
the full range; therefore εR and εD error is around
23%, taking into account the oscillations of the digital dial during measurement. This fact is reflected in the low correlation coefficients found, as shown in Figures 6b and 6c.
0.77 0.39 0.08
T 1.32 Fr B T
ε = , r2 = 0.95 (13)
1.31 0.42 -2.44
R 11.97 Fr B T
ε = , r2 = 0.80 (14)
1.46 0.72 -5.21
D 13.52 Fr B T
ε = , r2 = 0.71 (15)
where
1
R
d B
D
= (16)
2
R
d T
D
There are some difficulties in comparing correlations obtained in this work with those presented in the literature, mainly due to the differences in geometrical characteristics between the bioreactors studied. In the present work the range of UGR was quite narrow as compared with that
found in the literature. For instance, Gravilescu and Tudose (1998a, b and c) vary UGR from 0.02 to 0.10
m.s-1, while in the present work the range varies between 0.016 and 0.040 m.s-1, since higher UGR
could not be attained in the small-scale equipment utilized. However, use of correlations (13), (14), (15), (19) and (20) allows prediction of variable behavior in the concentric-tube airlift bioreactor for the gas-liquid system studied in the present work. This enables adoption of operational conditions that favor the development of processes involving industrially important aerobic microorganisms. Figure 8 shows a comparison of the experimental kLa
data with those predicted by equation (20). As shown by the correlation coefficient, there is an excellent agreement making it possible to define the proper geometry and operational conditions for a specific bioprocess.
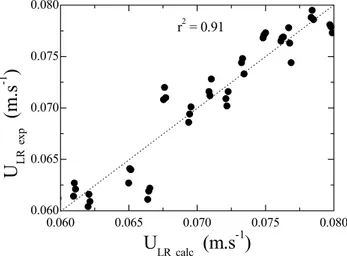
Also, the following relationship between the experimental values of superficial liquid velocity in the riser (ULR) and the geometrical factors was
obtained:
0.297 -0.004 0.095 LR
U =0.178 Fr B T , r2 = 0.91 (19)
Figure 7 contains the values predicted by equation (19), compared with the experimental values for the riser superficial liquid velocity (ULR).
Regarding kLa, it can be observed in Figure 5 that
this variable was also affected by geometrical parameters d1 and d2. In addition, it was possible to
apply the relationship proposed by Gavrilescu and Tudose (1998c), taking into account parameters B, T and Fr as follows:
6 1.121 0.201 0.410
Sh=7.16 10 Fr⋅ B T , r2 = 0.98 (20) where
2 L
L
k a D Sh
D
= R
1
(21)
The important conclusions drawn from this work are that the volumetric mass transfer coefficient is affected by even small changes in the geometrical relations, particularly by the top clearance, d2. Also,
the classical correlation with dimensionless numbers, namely the modified Sherwood number and the Froude number, together with the geometrical relations, enables prediction of the oxygen mass transfer in the reactor. The results showed that, even when working with the minimum liquid volume (d2
= 0), the oxygen mass transfer is large enough to support a high growth rate of microorganisms with a high oxygen demand, which allows operation of the reactor as a fed-batch. Also, the experimental procedure was shown to be convenient for evaluation of mixing and mass transfer studies in bench-scale airlift reactors.
and
9 2 L
D =2.43 10⋅ − m .s− .
As shown by Equation (19), ULR is affected by T
(d2/DR + 1), while the effect of B (d1/DR) is almost
negligible. It seems that the circulation rate is much more affected by the increase in liquid height than the decrease in pressure drop, caused by the increase in B. Therefore kLa should be affected more by T
than by B, as shown by equation 20. Gravilescu and Tudose (1998c) point out that higher circulation rates lead to more small-size bubble entrainment. As a result kLa increases more rapidly with T than the
holdup due to the larger interfacial area.
0.00 0.03 0.06 0.09 0.12 0.15 0.00
0.03 0.06 0.09 0.12 0.15
(a)
ε T
ex
p
(-)
0.00 0.05 0.10 0.15 0.20 0.25 0.00
0.05 0.10 0.15 0.20 0.25
(b)
ε R
ex
p
(-)
ε
Rcalc
(-)
r2 = 0.800.00 0.03 0.06 0.09 0.12 0.15 0.00
0.03 0.06 0.09 0.12 0.15
(c)
ε D
ex
p
(-)
ε
Dcalc
(-)
r2 = 0.71Figure 6: Comparison between calculated and experimental values of (a) total gas holdup (εT), (b) riser gas holdup (εR) and (c) downcomer gas holdup (εD)
0.060 0.065 0.070 0.075 0.080 0.060
0.065 0.070 0.075 0.080
U
LRex
p
(
m
.s
-1
)
U
LRcalc(m.s
-1)
r2 = 0.91
0.00 0.02 0.04 0.06 0.08 0.00
0.02 0.04 0.06 0.08
k
La
exp
(s
-1
)
k
La
calc(s
-1)
r2 = 0.98
Figure 8: Comparison between calculated and experimental values of volumetric oxygen transfer coefficient (kLa)
kLa Volumetric oxygen transfer coefficient (s-1)
ACKNOWLEDGEMENTS
n Number of moles of sodium sulfite
consumed (mole) The authors acknowledge the financial support
received from CNPq (Conselho Nacional de Desenvolvimento Científico e Tecnológico, Brasilia DF, Brazil) and FAPESP (Fundação de Amparo à Pesquisa do Estado de São Paulo, Brazil).
NV Volumetric oxygen transfer rate per unit
volume (mol.m-3.s-1) RH Hydraulic radius (m)
Sh Sherwood number (-)
T Top spatial ratio (-) tC Circulation time (s)
NOMENCLATURE tD Time in downcomer region (s)
tR Time in riser region (s)
AD Downcomer cross-sectional area (m2) tm Mixing time (s)
AR Riser cross-sectional area (m2) UGR Air superficial velocity in the riser (m.s-1)
ULR Liquid superficial velocity in the
downcomer (m.s-1) B Bottom spatial ratio (-)
C Dissolved concentration of oxygen in the
air-water system (mol.m-3) V Liquid volume (m3)
C* Dissolved concentration of saturated
oxygen in the air-water system (mol.m-3) L
V Average liquid linear velocity (m.s-1)
LR
V Liquid linear velocity in the riser (m.s-1) d1 Bottom clearance (m)
LD
V Liquid linear velocity in the downcomer
(m.s-1) d2 Top clearance (m)
DL Diffusivity of oxygen in water (m2.s-1)
DD Downcomer diameter (m)
Greek Letters DR Riser equivalent diameter DR = (4/Π (AT –
AD))1/2 (m)
εi general gas holdup (-)
Fr Froude number (-)
εR gas holdup in the riser (-)
εT total gas holdup (-)
REFERENCES
Blenke, H., Loop Reactors. In: Ghose T.K., Fiechter A. and Blackebrough N., Advances in Biochemical Engineering, vol. 13, Springer, Berlin – Heidelberg – New York, pp. 120-214 (1979).
Chisti, M.Y., Airlift Bioreactors, Elsevier, New York (1989).
Chisti, M.Y. and Moo-Young, M., Airlift Reactors: Characteristics, Applications and Design Considerations. Chem. Eng. Commun., 60, pp. 195-242 (1987).
Freitas, C. and Teixeira, J.A., Oxygen Mass Transfer in a High Solids Loading Three-phase Internal-loop Airlift Reactor, Chem. Eng. J., 84, pp. 57-61 (2001).
Galindez-Mayer, J., Sanchez-Teja, O., Christiani-Urbina, E. and Ruiz-Ordaz, N., A Novel
Split-cylinder Airlift Reactor for Fed-batch Cultures. Biopr. Biosystem. Eng., 24, pp. 171-177 (2001). Gavrilescu, M. and Tudose, R.Z., Concentric-tube Airlift
Bioreactors. Part I: Effects of Geometry on Gas Holdup. Bioprocess Eng., 19, pp. 37-44 (1998a). Gavrilescu, M. and Tudose, R.Z., Concentric-tube
Airlift Bioreactors. Part II: Effects of Geometry on Liquid Circulation. Bioprocess Eng., 19, Pp. 103-109 (1998b).
Gavrilescu, M. and Tudose, R.Z., Concentric-tube Airlift Bioreactors. Part III: Effects of Geometry on Mass Transfer. Bioprocess Eng., 19, pp. 175-178 (1998c). Margaritis, A. and Sheppard, J.D., Mixing Time and
Oxygen Transfer Characteristics of a Double Draft Tube Airlift Fermentor. Biotechnol. and Bioeng., 23, pp. 2117-2135 (1981).
Moresi, M., Optimal Design of Airlift Fermenters. Biotechnol. Bioeng., 23, pp. 2537-2560 (1981). Vilaça, P.R., Badino, A.C., Facciotti, M.C.R. and