Authors
Fabiana Baggio Nerbass1
Jyana Gomes Morais1 Rafaela Gonzaga dos Santos2
Tatiana Stela Kruger1
Andrea Carolina Sczip2
Hercilio Alexandre da Luz Filho1
1 Pro-Kidney Foundation.
2 Kidney Diseases Treatment Center.
Submitted on: 08/13/2012. Approved on: 02/14/2013.
Correspondence to: Fabiana Baggio Nerbass.
Pro-Kidney Foundation, Joinville, SC. Kidney Diseases Treatment Center, Joinville, SC. Rua Xavier Arp, nº 15, Joinville, SC, Brazil. CEP: 89227-680. E-mail: [email protected]
the treatment involving vascular access care, compliance towards the prescribed medications and nutritional guidelines - which recommendations include an ade-quate intake of energy and protein, and restriction of potassium, phosphorus, so-dium and fluids.1 Sodium intake control is necessary, since it is the main trigger of the osmometric thirst, which happens when the increase in extracellular os-molarity stimulates the hypothalamic osmoreceptors,2 triggering the sensation of thirst and the resulting fluid intake. In healthy subjects, the resulting increase in extracellular volume is compensated by renal excretion of sodium and fluids to restore the normal state of hydration,3 which does not occur with most hemo-dialysis patients, since they have minimal residual diuresis or anuria.
It is estimated that in anuric patients for each 8 g of sodium chloride (salt) in-gested, they would need 1 liter of fluids to keep the concentration of serum so-dium at normal levels.4 Therefore, the higher the sodium intake, the greater the fluid intake, and consequently the higher the cumulative weight between one dialy-sis and another, the so-called interdialytic weight gain (IDWG). The IDWG cor-responds to the difference between the post-dialysis and pre-dialysis weight of the following session and it is related to complications such as hypertension, con-gestive heart failure and even death.5,6 An %IDWG higher than 5.7% was asso-ciated with a 35% increase in mortality, regardless of other risk factors.6 Besides the indirect evidence of sodium intake
Factors associated to salt intake in chronic hemodialysis
patients
Introduction: Salt intake increases fluid intake and, consequently, blood pres-sure (BP) and interdialytic weight gain (IDWG), known as morbi-mortality risk factors for hemodialysis (HD) patients.
Objective: Evaluate salt intake and food sources, as well as its relationship with demographics, clinical and nutritional pa-rameters. Methods: Cross-sectional study with 109 patients (66% women, age = 49.0 ± 12.6 years) from five dialysis cen-ters. For total salt intake, a validated food frequency questionnaire (FFQ) and the use of discretionary salt were estimated. The relationship of salt intake with many factors was studied. Results: Salt intake was high (8.6 ± 5.4 g/day) and 72% came from discretionary salt. Only literacy was significantly correlated total salt intake (r = -0.29, p < 0.01) and discretionary salt (r = -0.30, p < 0.01). With FFQ food items, there was a positive correlation with the %IDWG (r = 0.26, p < 0.01) and negative with age (r = -0.35, p < 0.001). Direct relationship between salt intake with %IDWG was found in the anuric subgroup (r = 0.26, p < 0.05) and with medium BP in those with no prescription of hypotensive drugs (r = 0.35, p < 0.05).
Conclusion: Salt intake was high mainly due to discretionary salt. It was associa-ted with education and adversely affecassocia-ted %IDWG in anuric patients and medium BP in those not taking hypotensive drugs.
A
BSTRACTKeywords: dialysis; food consumption; sodium.
I
NTRODUCTIONinfluence on mortality because of its relationship with the %IDWG and elevated blood pressure, a re-cent publication found that a higher dietary sodium intake was an independent predictor of mortality among 1,770 patients in hemodialysis.7
To promote the reduction of these problems, the European Nutrition Guide recommends a sodium intake not higher than 2,000 to 2,300 mg daily or 5-6 g of table salt (sodium chloride) and the IDWG must not exceed 4% to 4.5% of the individual’s dry weight.4
Although the main dietary source of sodium is ta-ble salt added to foods, many compounds and food additives such as monosodium glutamate, sodium benzoate, etc., have been widely used by the food industry and can contribute significantly to increa-se the sodium intake. In industrialized countries it is estimated that 75% of sodium intake come from processed food.8
Few studies have investigated sodium intake and its food sources in the population of patients on hemodialysis.
Thus, the objective of this study was to evaluate sodium intake and its food sources in patients on he-modialysis (HD), as well as its association with de-mographic, clinical and nutritional parameters.
M
ETHODPATIENTS
The study was cross-sectional and included 109 pa-tients who were on a chronic hemodialysis program in two units of the Pro-Rim foundation in the cities of Joinville and Balneário Camboriu and in three units of the Center for Kidney Disease Treatment in the cities of Joinville, Jaragua do Sul and Mafra, all in the state of Santa Catarina - Brazil. From a total of approximately 400 patients in the five aforemen-tioned units, we included only those aged over 18 years, on hemodialysis for more than three months and who were used to take their main meals at ho-me. Patients with cognitive impairment, those who could not answer the questions regarding salt intake and those in which the data collected from medical records was incomplete or had typos were taken off the study.
The patients were also questioned about their schooling, which was analyzed in years from the
first year of elementary school, continued use of an-tihypertensive medication and residual diuresis. We considered anuric those with residual diuresis < 100 ml/day. All participants had regular monitoring with professional nutritionists and were instructed, both individually and in group meetings, to consume the proper amount of salt (up to 6 g/day).4 The study was approved by the Ethics Committees of the participating institutions.
SALTINTAKE
To obtain the daily total salt intake we used the sum of the salt added + the salt already in the food from the Food Frequency Questionnaire (FFQ). Salt in-take higher than 6 g/day was considered high.4
SALTADDITION
The patients were asked about the usual monthly consumption of salt at home (number of 1 kg pa-cks per month) as well as the number of people who took their main meals (lunch and dinner) at home at least five times a week. The individual intake was de-termined by dividing the quantity of salt consumed (in grams) by the number of frequent diners.9
FOODSALTIN THE FOOD FREQUENCY QUESTIONNAIRE (FFQ)
of monthly consumption (0 to answer 1 = never: 0.5 to answer 2 = less than once a month; 2 for answer #3 = one to three times per month; four to #4 = once per week; 12 for the 5th = two to four times a week; 60 for #7 two or more times a day). The result was the monthly sodium intake for each item. To obtain the daily and monthly salt intake, we used the equi-valent of 400 mg of sodium = 1 g of salt.
%IDWG ANDBLOODPRESSURE
The %IDWG was calculated vis-à-vis the actual wei-ght gain between one and another HD session using the following formula:
test according to the distribution of variables. To compare the variables between the groups we ran the Student t-test. Statistical significance was set at
p < 0.05.
R
ESULTSTable 1 shows the sample characteristics. The pa-tients included were mostly females and the percen-tage of participants with either high %IDWG or ina-dequate MAP was approximately 25%.
(Current pre-HD weight - Post-previous HD weight) x100/ Post-previous HD weight
A %IDWG ≤ 4.5% was considered appropriate.4 The pre-HD blood pressure was measured after the patient had been seated for at least five minu-tes. For analysis of both the %IDWG and the blood pressure (BP) we calculated the mean value obtai-ned from the hemodialysis sessions over four weeks. For BP data analysis, we calculated the mean arterial pressure (MAP) using the following formula:
Diastolic BP + 1/3 (systolic - diastolic)
MAP up to 107 mmHg was considered appro-priate because it corresponds approximately to a BP of 140/90 mmHg.10 Data was collected from patient charts.
NUTRITIONALSTATUSASSESSMENT
We used the body mass index (BMI) as an indicator of nutritional status, obtained by the weight (kg) di-vided by the patient’s squared height (cm). We used the dry weight, which is defined according to clinical criteria (blood pressure, edema, intradialytic symp-toms), periodically reviewed by the multidisciplina-ry team. BMI greater than 23 kg/m2 was considered adequate.4
STATISTICALANALYSIS
The statistical analysis was performed with the SPSS software, version 13.0 for Windows (SPSS, Inc. Chicago, IL). Results were expressed as mean and standard deviation, median and extreme values or as percentages - where appropriate. For corre-lation analysis, we used the Pearson or Spearman
TABLE 1 MAINCHARACTERISTICSOFTHEPOPULATION
STUDIED (N = 109)
Age (years) 49.0 ± 12.6
Female gender (%) 66
Dialysis type (months) 120 (3 to 276)
BMI (kg/m2) 25.2 ± 5.5
Education (years of study) 7.2 ± 3.6
Diabetes mellitus (%) 25.7
IDWG% 3.7 ± 1.6
IDWG > 4.5% (%) 24.8
Pre-dialysis (mmHg) 101 ± 11 MAP > 107 mmHg (%) 26.6
Pacients on hypotensive agents (%) 63
Anuric (%) 51.4
BMI: Body mass index; IDWG%: Percentage of interdialytic weight gain; Pre-dialysis MAP: Mean arterial pressure pre-hemodialysis.
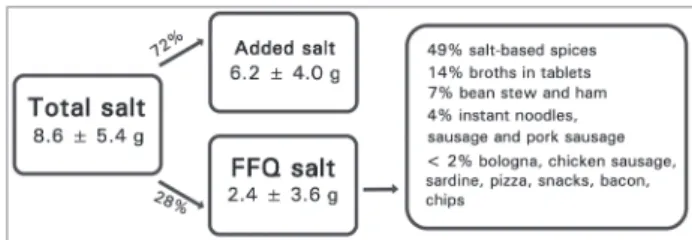
The average daily salt intake was high (8.6 ± 5.4 g/day), and 58% reported a level considered to be inadequate (> 6 g/day). As shown in Figure 1, the added salt accounted for 72% of the total salt in-take, while the FFQ foods had a lower participation. Salt-based seasonings and broth tablets accounted for 63% of the intake attributed to FFQ items.
Figure 1. Daily total salt intake, salt addition and salt from FFQ food items.
The total salt intake was not different betwe-en gbetwe-enders, but the food from the FFQ was higher among males (3.5 ± 5.3 versus 1.8 ± 2.2 g/day,
level, patients with educational level higher than ele-mentary education reported lower total salt intake (6.7 ± 4.4 versus 9.7 ± 5.6 g/day, p < 0.05) and added salt (4.7 ± 2.6 versus 7.1 ± 4.3 g/day, p < 0.05) than the others. There was no difference when the salt intake was compared by age (cutoff = 60 years) or nutritional status by the BMI (cutoff = 23 kg/m2).
In the whole group of patients, education was the only variable that significantly correlated with both the total salt intake (r = -0.29, p < 0.01) and with the addition of salt (r = -0.30, p < 0.01). Concerning the salt of the FFQ food items, there was a direct correlation with the %IDWG (r = 0.26, p < 0.01) and an inverse one with age (r = -0.35, p < 0.001). We found a direct relationship between total salt intake and %IDWG in the subgroup of anuric pa-tients (r = 0.26, p < 0.05) and MAP only in partici-pants who were not taking antihypertensive agents (r = 0.35; p < 0.05).
Upon dividing the sample according to the %IDWG, patients with high %IDWG reported hi-gher total salt intake and FFQ foods, and the mean MAP was also significantly higher than the partici-pants with adequate %IDWG. There was no diffe-rence when comparing the groups according to the adequacy of MAP or total salt intake (Table 2).
D
ISCUSSIONThis study showed that patients on hemodialysis had a high intake of salt, associated with %IDWG, MAP and schooling.
Inadequate salt intake was also found in two other studies involving hemodialysis patients in our country. In the study carried out by Vasconcelos
et al.10 they estimated an intake of 8.6 ± 2.9 g, the Agondi et al.,11 whose evaluation methodology was
the same one used in this study, found 10.6 ± 6.3 g/ day. Salt intake similar to that found in this study was estimated for the Brazilian population through the Household Budget Survey (HBS) held between the years of 2008 and 2009: 8.2 g/day.12
Contrary to what occurs in developed countries, in which sodium intake comes mainly from proces-sed foods (75%),8 in our study the main source of intake of this electrolyte was the added salt (72%). Agondi et al.11 found an even higher participation of added salt in the total salt intake (82%). In the same study, salt-based seasonings also had the highest par-ticipation in sodium intake among the FFQ foods.
Salt intake and its association with several cha-racteristics have been little explored in both the po-pulation of hemodialysis patients around the world and in the general population of our country. In this study, among the demographic variables studied, the only one that influenced the total salt intake was schooling. An inverse correlation with this variable was also found by Agondi et al.11 This association may be due to less information regarding the use of salt among patients with lower educational level.
The presence or absence of diuresis influenced the relationship between salt intake and %IDWG, sin-ce a direct correlation between these variables was found only in anuric patients. Different results were observed in other studies, in which they found this association with the entire group of patients, regar-dless of diuresis.7,11 An association of the total salt in the %IDWG was also evident when the sample was divided according to its adequacy. Patients with inappropriate %IDWG reported higher salt intake than others.
The relationship between salt intake and overall MAP was observed only in the group of patients who
TABLE 2 INTER-RELATIONSHIPBETWEENADJUSTMENTSTO %IDWG, MAP ANDTOTALSALTINTAKE
%IDWG MAP (mmHg) Total salt (g/day)
≤ 4.5% (n = 82)
> 4.5% (n = 27)
≤ 107 (n = 80)
> 107 (n = 29)
≤ 6.0 n = 46)
> 6.0 (n = 63) Total salt (g/day) 8.0 ± 4.9 10.5 ± 6.3* 8.2 ± 5.1 9.8 ± 5.9 - -Added salt (g/day) 6.0 ± 3.6 6.9 ± 5.1 6.1 ± 4.1 6.6 ± 3.9 -
-Salt in FFQ food (g/day) 2.0 ± 3.2 3.6 ± 4.5* 2.1 ± 3.1 3.2 ± 4.7 -
-%IDWG - - 3.6 ± 1.7 4.1 ± 1.2 3.5 ± 1.2 3.9 ± 1.8
MAP (mmHg) 100 ± 10 105 ± 14* - - 99 ± 12 102 ± 11
were not taking hypotensive drugs continuously. This same association, but now with systolic blood pres-sure, was found in a study involving 1,770 patients, regardless of the use of antihypertensive agents.7
Evidence of the benefits of salt restriction in he-modialysis patients were identified by studies that found decreased IDWG and the need for antihyper-tensive medication, better preservation of left ven-tricular function, and reduction of intradialytic hy-potension.10,13,14 However, it has been shown that managing fluid restriction is one of the most stress-ful components of the treatment of these patients.15 In fact, more than half of the patients reported inadequate sodium intake and a quarter had high %IDWG.
Studies using health-behavioral theories as the transtheoretical theory and the health belief model assessed the differences between patients with res-pect to predisposition to complying with sodium and water restriction and the main barriers and benefits perceived by them to comply with these recommendations. As a result, they found that in-dividuals who reported greater benefits are more likely to be compliant, unlike those who consider a larger number of barriers.16,17 Smith et al.1 held a study in which patients on hemodialysis were gathered in small discussion groups to talk about their perceptions regarding barriers and facilitating factors vis-à-vis their compliance with fluid restric-tion. Among the barriers, psychological factors we-re the most we-reported, lack of motivation being a key one. Among the facilitating factors, knowledge was the one most discussed by patients, followed by psychological factors such as self-confidence and positive social support.
In a study carried out in our country, in which beliefs regarding salt restriction were investigated in 117 hemodialysis patients, it was observed that subjects perceived more benefits than barriers to follow this guidance. Among the benefits, the most frequently mentioned were: “salty foods are not good for me” and “eat less salt will preserve the health of my heart”. The most frequently reported barriers were “eating low salt hampers going to res-taurants” and “low-salt foods are not tasty”.11 For these scholars, a better understanding of patients’ beliefs regarding the restriction of salt and water is an important tool for increasing the effectiveness
of interventions and compliance through necessary behavioral modifications.1,11,17
C
ONCLUSIONThe results of this study showed that interventions are needed to increase compliance vis-à-vis salt res-triction, since it has been negatively associated with IDWG and blood pressure, factors that significantly increase the morbidity and mortality of these patients.
R
EFERENCES1. Smith K, Coston M, Glock K, Elasy TA, Wallston KA, Ikizler TA, et al. Patient perspectives on fluid management in chronic hemodialysis. J Ren Nutr 2010;20:334-41. http:// dx.doi.org/10.1053/j.jrn.2009.09.001 PMid:19913443 PM-Cid:2888683
2. Lindley EJ. Reducing sodium intake in hemodialysis patients. Semin Dial 2009;22:260-3. http://dx.doi.org/10.1111/j.1525-139X.2009.00570.x PMid:19573006
3. Guyton AC, Hall JE. Textbook of Medical Physiology. 10th ed.
Philadelphia: Saunders; 2000.
4. Fouque D, Vennegoor M, ter Wee P, Wanner C, Basci A, Canaud B, et al. EBPG guideline on nutrition. Nephrol Dial Transplant 2007;22:ii45-87. http://dx.doi.org/10.1093/ndt/ gfm020 PMid:17507426
5. Kalantar-Zadeh K, Regidor DL, Kovesdy CP, Van Wyck D, Bunnapradist S, Horwich TB, et al. Fluid retention is asso-ciated with cardiovascular mortality in patients undergoing long-term hemodialysis. Circulation 2009;119:671-9. http:// dx.doi.org/10.1161/CIRCULATIONAHA.108.807362 PMid:19171851 PMCid:2773290
6. Leggat JE Jr, Orzol SM, Hulbert-Shearon TE, Golper TA, Jones CA, Held PJ, et al. Noncompliance in hemodialysis: predictors and survival analysis. Am J Kidney Dis 1998;32:139-45. http://dx.doi.org/10.1053/ajkd.1998.v32.pm9669435 PMid:9669435
7. Mc Causland FR, Waikar SS, Brunelli SM. Increased dietary so-dium is independently associated with greater mortality among prevalent hemodialysis patients. Kidney Int 2012;82:204-11. http://dx.doi.org/10.1038/ki.2012.42 PMid:22418981
8. Vennegoor MA. Salt restriction and practical aspects to improve compliance. J Ren Nutr 2009;19:63-8. http://dx.doi. org/10.1053/j.jrn.2008.10.019 PMid:19121774
9. Ferreira-Sae MC, Gallani MC, Nadruz W, Rodrigues RC, Franchini KG, Cabral PC, et al. Reliability and validity of a semi-quantitative FFQ for sodium intake in low-income and low-literacy Brazilian hypertensive subjects. Public Health Nutr 2009;12:2168-73. http://dx.doi.org/10.1017/ S1368980009005825 PMid:19476677
10. Vasconcelos MSF, Santos MCG, Morais PGF, Anjos SC, Ruzany F, Hoette M. A restrição de sal reduz a pressão arterial sistêmica, o ganho de peso interdialítico e o uso de fármacos anti-hipertensivos em pacientes em hemodiálise crônica. J Bras Nefrol 2004;26:57-64.
11. Agondi Rde F, Gallani MC, Rodrigues RC, Cornélio ME. Re-lationship between beliefs regarding a low salt diet in chronic renal failure patients on dialysis. J Ren Nutr 2011;21:160-8. http://dx.doi.org/10.1053/j.jrn.2010.03.007 PMid:20537916 12. Brasil. Instituto Brasileiro de Geografia e Estatística (IBGE).
13. Kayikcioglu M, Tumuklu M, Ozkahya M, Ozdogan O, Asci G, Duman S, et al. The benefit of salt restriction in the treatment of end-stage renal disease by haemodialysis. Nephrol Dial Transplant 2009;24:956-62. http://dx.doi.org/10.1093/ndt/ gfn599 PMid:19004849
14. Maduell F, Navarro V. Assessment of salt intake in hemodialysis. Nefrologia 2001;21:71-7. PMid:11344965
15. Welch JL, Austin JK. Factors associated with treatment-related stressors in hemodialysis patients. ANNA J 1999;26:318-25. PMid:10633603
16. Welch JL, Perkins SM, Evans JD, Bajpai S. Differences in per-ceptions by stage of fluid adherence. J Ren Nutr 2003;13:275-81. http://dx.doi.org/10.1016/S1051-2276(03)00115-8 17. Ghaddar S, Shamseddeen W, Elzein H. Behavioral modeling