High-frequency Audiometry Hearing on
Monitoring of Individuals Exposed to
Occupational Noise: A Systematic Review
Cleonice Aparecida Silva Antonioli
1Teresa Maria Momensohn-Santos
1,2Tatiana Aparecida Silva Benaglia
31Specialization on Advanced Audition, Instituto de Estudos Avançados da Audição, São Paulo, SP, Brazil
2Audiologist, PUC, São Paulo, São Paulo, Brazil 3Statistics, UNICAMP, Campinas, São Paulo, Brazil
Int Arch Otorhinolaryngol 2016;20:281–289.
Address for correspondence Cleonice Aparecida Silva Antonioli, Fga, Instituto de Estudos Avançados da Audição, Rua Dr. Albuquerque Lins, 537 - Santa Cecilia, SP Campinas, São Paulo 13034-673, SP, Brazil (e-mail: [email protected]).
Introduction
The hearing limit can be influenced by several factors intrinsic or extrinsic to the individual. A few are: age, heredity, head trauma, smoking, systemic diseases, exposure to chemical substances, and/or occupational and extra occupational noise.
Nowadays, noise is one of the most frequent problems in many different societies, whether at work or outside of it. When not managed effectively, it can lead to irreversible alterations in the ear structure, resulting in hearing loss.1
In the labor process, noise is common,2–4and considered to be the second most common cause of hearing loss in adults, after prebycusis.5
Keywords
►
high-frequency
►
hearing loss caused by
noise
►
hearing loss
►
hearing tests
►
hearing
►
monitoring
Abstract
Introduction
The literature reports on high-frequency audiometry as one of the exams
used on hearing monitoring of individuals exposed to high sound pressure in their work
environment, due to the method
́
s greater sensitivity in early identi
fi
cation of hearing
loss caused by noise. The frequencies that compose the exam are generally between 9
KHz and 20KHz, depending on the equipment.
Objective
This study aims to perform a retrospective and secondary systematic
revision of publications on high-frequency audiometry on hearing monitoring of
individuals exposed to occupational noise.
Data Synthesis
This systematic revision followed the methodology proposed in the
Cochrane Handbook, focusing on the question:
“
Is High-frequency Audiometry more
sensitive than Conventional Audiometry in the screening of early hearing loss individuals
exposed to occupational noise?
”
The search was based on PubMed data, Base, Web of
Science (Capes), Biblioteca Virtual em Saúde (BVS), and in the references cited in
identi
fi
ed and selected articles. The search resulted in 6059 articles in total. Of these,
only six studies were compatible with the criteria proposed in this study.
Conclusion
The performed meta-analysis does not de
fi
nitively answer the study
’
s
proposed question. It indicates that the 16 KHz high frequency audiometry (HFA)
frequency is sensitive in early identi
fi
cation of hearing loss in the control group (medium
difference (MD
¼
8.33)), as well as the 4 KHz frequency (CA), this one being a little less
expressive (MD
¼
5.72). Thus, others studies are necessary to con
fi
rm the HFA
importance for the early screening of hearing loss on individuals exposed to noise at
the workplace.
received August 27, 2015 accepted October 11, 2015 published online December 14, 2015
DOI http://dx.doi.org/ 10.1055/s-0035-1570072. ISSN 1809-9777.
Copyright © 2016 by Thieme Publicações Ltda, Rio de Janeiro, Brazil
THIEME
Despite the legal requirements, actions by several health professionals, safety at work initiatives, and union interven-tions, the productivity dynamics still generate a noisy work environment putting workers’hearing at risk.6
There are endless actions implemented to try to control the occupational noise; however, they are not always effective. The use of auditory Personal Protection Equipment (PPE), tone audiometry, as well as historical knowledge of hearing loss are not always sufficient to keep workerśhearing limits stable, as recommended by Brazilian decree 19/1998 from the Ministry of Labor.7Nonetheless, certain variables may intervene and contribute to the triggering of hearing loss and/or its progression, even in the work environment. These include the type and usage of the personal hearing protection equipment (PPEs),8the efficiency of the equipment over a long period of usage time, individual sensitivity, maintenance on the noise source equipment, and the different raw materi-als used in production environment (density, resistance).
The auditive monitoring and management of the individual exposed to occupational noise can show deficits when the available resources are limited to only conventional audiometry data (auditory threshold of the worker exposed to noise), to dosimetry (level of exposure to noise) and to the use of PPEs. Conventional audiometry is a procedure guaranteed by law for tracking the hearing capacity of workers exposed to noise, but does not prematurely identify any hearing alterations. It is an important, thought limited, resource for inhibitory actions in the progression of hearing loss in monitored individual, whose auditory deficit reflect in health, social security, and indemnify-ing statistics in the company.
Studies suggest that high-frequency audiometry (from 9 kHz to 20 kHz) is an additional and important test to identify an initial hearing loss, as it is more sensitive to noise than conven-tional audiometry,9,10even though there is no consensus on the standardization of the procedure (calibration, methodology, results, and analysis).11,12This study aims to answer whether high-frequency audiometry is more sensitive than conventional audiometry in the tracking of premature hearing loss in individ-uals exposed to occupational noise. Our objective is to perform a secondary retrospective systematic review with a meta-analysis on high-frequency audiometry used in monitoring high-noise pressure on exposed workers’hearing health.
Review of Literature
The guidelines to this systematic review were suggested by Cochrane Handbook and include: formulation of a research question, localization, selection, and gathering of scientific articles as well as their critical evaluation.13Our investigation question was: “Is the high-frequency audiometry more sensitive than the conventional audiometry in tracking the premature hearing loss in occupational noise exposed indi-viduals?”Literature research was conducted from March 10 to September 30, 2014, based on the following online data: PubMed, Embase, Web of Science (Capes), and Biblioteca Virtual em Saúde. The keywords were selected from the Health Science Keywords list (DeCS).14They are:Audiometry;
Hearing Loss,High-Frequency; Hearing Loss, Noise-Induced;
Hearing Loss; Hearing Tests; Hearing; Monitoring; Noise,
Occupational; Occupational Health. For the article research,
the keywords were combined in the following way:
Audiom-etry and monitoring and occupational hearing loss,
high-frequencyandaudiometryandoccupational health;Hearing
Loss,High-Frequency;Hearing Loss,Noise-Inducedand
moni-toringandaudiometry;Hearing Loss,Noise-Inducedand
mon-itoring;Hearing testsandmonitoringandoccupational health.
We also manually researched the bibliography from the selected articles. To evaluate the quality of the selected articles, we adopted a recommendation from the Committee to Advise on Tropical Medicine and Travel (CATMAT) regard-ing the recommendation grade (A, B, C, D, and E, with A beregard-ing the most recommended for usage and E, the least) and the evidence level category (classification from I to VII, in which level I is the highest and VII the lowest).15–17
Two authors participated independently in the elaboration of the search strategies based on data, the study selection based on the including and excluding criteria, the critical evaluation of the studies for inclusion in the systematic review, and in the interpretation of the results.
The inclusion criteria for this systematic review were: (1) studies with an approach to the objective explicit in the title, abstract, or article body; (2) publication date within the past 11 years; (3) research that includes a study group and a control group; (4) results from similar statistics tests; (5) at least one frequency matching the other studies; and (6) studies in English, Portuguese, and Spanish.
We excluded all repeated articles.
Discussion
The search for the keywords above in the database used resulted in a sum of 6059 articles. Remaining after thefilters of the publication year (3582 articles) and of the filter: languages (3569 articles).
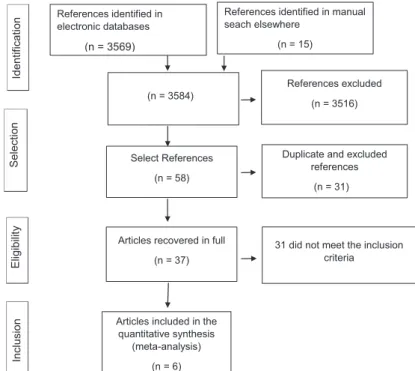
After titles and abstracts screening and the manual search in bibliographic references, 3854 articles were identified. Observ-ing the inclusion and exclusion criteria adopted, 68 were selected. From these, we excluded 31 because they were in more than one database. Thus, 37 articles remained for full text analysis. From the selection of abstracts found, which were relevant for the proposed question, we retrieved the articles in full text. After the reading of only six studies5,10,18–21matched the proposed inclusion criteria (►Fig. 1).
Next, we gathered data from the selected articles for the following variables: reference data of article; identification of the study type; investigation of the analyzed population and control group (CG); evaluated frequencies in high-frequency audiometry (HFA) and conventional audiometry (CA); inclusion and exclusion criteria; ethics committee and consent term use; analysis of the statistics used and outcomes (►Fig. 1).
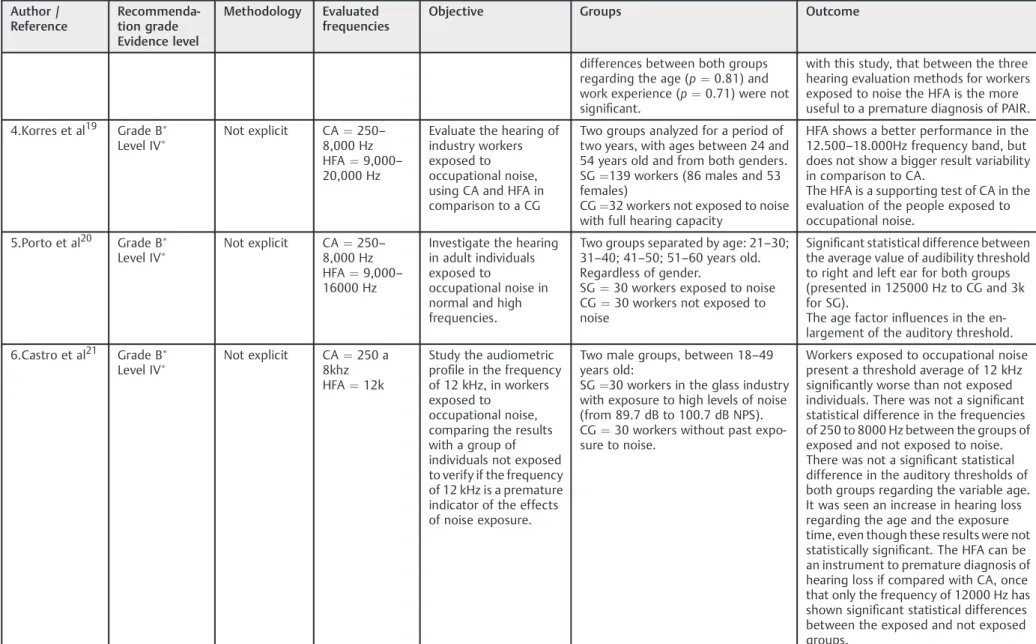
We present the gathered data in these forms summarized in►Table 1.
The selected variables from the articles were author name, publication year, recommendation grade and evidence level, methodology, evaluated frequencies, objective, investigation group formation, sample size, and study outcome.
International Archives of Otorhinolaryngology Vol. 20 No. 3/2016
In this study, the selected articles did not undergo a randomization process. They correspond to evidence level IV and a B 05 recommendation grade, which indicates mod-erate evidence for a cohort study.
Even though the selected articles refer to a specific sample group (workers exposed to occupational noise) with a com-mon predetermined risk factor - in this case, noise - only two explicitly approached the research type and study outline in their methodology: the cohort study and the prospective cross-sectional study. The more explicit and clear the study type data, the methodological procedures used for the data gathering and its use in the analysis process, the better the chances of a reader understanding the outlines and limits of the study, as well as itsfindings.
The percentage related to the publication year of the selected articles was 17% for 2004 and 2011, and 33% for 2008 and 2014.
The sample size varied between 30 and 186 participants in the study group and 30 to 148 participants in the control group. Regarding the study subjects, 50% included both genders and 50% only males. There is no evidence that gender has any influence on the auditory limit or makes a difference when considering exposure to a high level of sound pres-sure.10Age varied between 18 and 60 years old. Some studies (33%) subdivided the age groups in decades to comprehend the influence of age on the auditory limit. It was possible to observe that individuals above 40 years old are more suscep-tible to presbycusis; however, the study by Mehrparvar10did not see a significant difference in the variable age (p¼0.3) for both groups: exposed and control.
The frequencies referred to as the most sensitive in HFA among the studied population in the selected articles were: 14 kHz for studies 1, 2, 3, 4, and 5, and 16 kHz for 1, 2, and 3. Study number 6 analyzed only the frequency of 12 kHz, which
was significant; however, it was not part of the meta-analysis as it was not contained in the methodology of the other studies. Study number 2 connects high frequency sensibility to an age below 40 years old. Above that age, there was a decrease in the sensibility, justified by the probable interference of presbycusis. The studies (1, 4, 5, and 6) that evaluated the difference of auditory limits in HFA between the left and right ears did not produce significant data. Similarly, studies that evaluated the difference between genders also did not reach significant data outcome.
The average auditory limits were higher for all frequencies in the study group (SG) when compared with control group (CG) in articles 1, 2, 4, and 5, being higher for the higher frequencies. The same occurred with the standard deviation, which, in general, was higher for SG than for CG, where higher values correlated with higher frequencies. In article number 6, the averages and the standard deviations found for fre-quencies up to 3 kHz varied for both groups, being larger in the control group in the left ear. In frequencies above 4 kHz, the highest averages and standard deviations concentrated in the SG. In study number 3, the averages of the auditory limits and the standard deviations were bigger for all subjects in the conventional audiometry group (CA).
The frequencies analyzed in the conventional audiometry were more constant then the high-frequency audiometry for the six selected studies (►Tables 2and3). This can be justified with the existence of standardization only for the CA as well as the diversity/limitation of the equipment for the higher frequencies. Therefore, for the meta-analysis, we selected only the frequencies of 2 kHz, 3 kHz, 4 kHz, 6 kHz, 8 kHz, 10 kHz, 14 kHz, and 16kHz.
We grouped the ages in the second text to maintain the same pattern of the other studies. Creating an average, a standard deviation and a unique pvalue for each analyzed
(n = 3584)
References excluded
(n = 3516)
31 did not meet the inclusion criteria
Duplicate and excluded references
(n = 31) Select References
(n = 58)
Articles recovered in full
(n = 37)
Articles included in the quantitative synthesis
(meta-analysis)
(n = 6) References identified in electronic databases
(n = 3569)
References identified in manual seach elsewhere
(n = 15)
Selectio
n
n
oit
a
cifi
t
n
e
dI
Elig
ibilit
y
Inclusion
Fig. 1 Flow selection of items for a systematic review with meta-analysis.
International Archives of Otorhinolaryngology Vol. 20 No. 3/2016
Table 1 General outlook of the selected articles
Author / Reference
Recommenda-tion grade Evidence level
Methodology Evaluated frequencies
Objective Groups Outcome
1.Mehrparvar et al10
Grade B
Level IV historical cohort
CA¼250, 500, 1k, 2k, 3k, 4k, 6k and 8k Hz HFA¼10– 16kHz
Compare the noise’s effects at HFA x CA in employee exposed to occupational noise.
Two groups under the age offifty. SG¼120 textile workers (108 men and 12 women) with continuous noise exposure of 85þdBA.
CG (106 men and 14 women) not exposed to noise.
In the SG, the hearing threshold was superior in 16000 Hz for both ears, and the difference was statistically
meaningful for all frequencies (p<0.001 for each frequency in each ear); but this comparison did not show a meaningful difference in the control group (p¼0.18, 0.41, 0.72 for the right ear 3000, 4000 and 6000 Hz, and p¼0.39, 0.91, 0.28 for the left ear 3000, 4000, 6000 Hz, respectively). Overall, 54.2% of the cases presented hearing loss in at least one ear and in one frequency at the conventional
audiometry. In the high frequencies, the results were of 87.6%. It has been identified a higher incidence of hearing loss in 4000, 6000 and 16000 Hz, given that 16000 Hz the most
sensible frequency.
2.Somma et al18
Grade B Level IV
Not explicit CA¼250 A 8KhZ HFA¼9K A 18KHZ
Investigate the sensibility of HFA x CA at detecting hearing damage due to noise at work.
Two male groups of two cement factories in Italy:
SG¼186 CG¼98
To control the age effects in hearing and evaluate better the noise effects over the high frequencies in the groups, they were grouped (21–30; 31–40; 41–50; and 51–60 years old).
HFA can be useful for work evaluation with age inferior to forty years old, after that the age factor can alter the results. In youthful individuals (less than 40 years) the affected frequencies were of 14 and 16kHz.
3.Mehrparvar et al5
Grade B Level IV
Prospective cross
CA¼500, 1k, 2k, k, 4k, 6k,e 8kHz
HFA¼10000, 12000, 14000, and 16000 Hz
Compare three different tests for the premature diagnosis of PAIR (CA, HFA and EOAPD) in workers.
Two groups of 120 men, composed by workers of three ceramic and roof tile companies.
SG¼exposed to noise levels above 85 dBA;
CG¼no noise exposure.
The average age and work experience were 35.006.33 and 10.765.52 years and 34.155.76 and 11.146.12 years in thefirst and second group, respectively. The
At the present study, the frequencies altered in HFA and in CA were 4000 and 6000 Hz, and 14000 and 16000 Hz. EOAPD in high frequencies (3000, 4000 and 6000 Hz) was more sensitive to noise than CA, and less than HFA, perhaps due to the subjects having a slight hearing loss.
Our study did not show a significant difference between both methods for hearing loss detection. It was concluded,
In
ter
n
a
tio
na
l
A
rc
hi
ve
s
o
f
O
to
rh
in
ola
ry
n
g
o
lo
g
y
V
o
l.
2
0
N
o
.
3
/2
01
6
Hi
gh
-frequenc
y
A
udiometr
y
He
aring
o
n
Individua
ls
Exposed
to
Oc
cupati
o
n
al
Noise
An
ton
iol
i
e
t
a
l.
Table 1 (Continued)
Author / Reference
Recommenda-tion grade Evidence level
Methodology Evaluated frequencies
Objective Groups Outcome
differences between both groups regarding the age (p¼0.81) and work experience (p¼0.71) were not significant.
with this study, that between the three hearing evaluation methods for workers exposed to noise the HFA is the more useful to a premature diagnosis of PAIR.
4.Korres et al19 Grade B
Level IV Not explicit CA
¼250– 8,000 Hz HFA¼9,000– 20,000 Hz
Evaluate the hearing of industry workers exposed to occupational noise, using CA and HFA in comparison to a CG
Two groups analyzed for a period of two years, with ages between 24 and 54 years old and from both genders. SG¼139 workers (86 males and 53 females)
CG¼32 workers not exposed to noise with full hearing capacity
HFA shows a better performance in the 12.500–18.000Hz frequency band, but does not show a bigger result variability in comparison to CA.
The HFA is a supporting test of CA in the evaluation of the people exposed to occupational noise.
5.Porto et al20 Grade B Level IV
Not explicit CA¼250– 8,000 Hz HFA¼9,000– 16000 Hz
Investigate the hearing in adult individuals exposed to
occupational noise in normal and high frequencies.
Two groups separated by age: 21–30; 31–40; 41–50; 51–60 years old. Regardless of gender.
SG¼30 workers exposed to noise CG¼30 workers not exposed to noise
Significant statistical difference between the average value of audibility threshold to right and left ear for both groups (presented in 125000 Hz to CG and 3k for SG).
The age factor influences in the en-largement of the auditory threshold.
6.Castro et al21 Grade B Level IV
Not explicit CA¼250 a 8khz HFA¼12k
Study the audiometric profile in the frequency of 12 kHz, in workers exposed to
occupational noise, comparing the results with a group of individuals not exposed to verify if the frequency of 12 kHz is a premature indicator of the effects of noise exposure.
Two male groups, between 18–49 years old:
SG¼30 workers in the glass industry with exposure to high levels of noise (from 89.7 dB to 100.7 dB NPS). CG¼30 workers without past expo-sure to noise.
Workers exposed to occupational noise present a threshold average of 12 kHz significantly worse than not exposed individuals. There was not a significant statistical difference in the frequencies of 250 to 8000 Hz between the groups of exposed and not exposed to noise. There was not a significant statistical difference in the auditory thresholds of both groups regarding the variable age. It was seen an increase in hearing loss regarding the age and the exposure time, even though these results were not statistically significant. The HFA can be an instrument to premature diagnosis of hearing loss if compared with CA, once that only the frequency of 12000 Hz has shown significant statistical differences between the exposed and not exposed groups.
Abbreviations: CA, conventional audiometry; CG, control group; EOAPD,; HFA, high frequency audiometry; SG, study group.
In
te
rn
at
io
nal
A
rc
hi
ve
s
o
f
O
to
rh
in
ol
ar
yn
g
o
lo
g
y
V
o
l.
2
0
N
o
.
3
/2
01
6
High-frequenc
y
A
udiometr
y
He
aring
o
n
Individuals
Exp
o
sed
to
O
cc
upational
N
oise
An
to
n
iol
i
e
t
a
l.
28
frequency. The other studies (1, 3, 4, 5, and 6) had, individu-ally, the results obtained by ear grouped by frequency. This way, each frequency got an average reference value for both ears. The alteration made the meta-analysis possible.
For the meta-analysis, we used the R software (R Core Team, 2012), a statistics program that allows the calculation of the study data that are not from an interference, as the cross-sectional and cohort. This provides a summarized Table 2 General panorama of the analyzed frequencies
N Author / Reference Frequencies evaluated Common studies
Audiometry AAF
1 Mehrparvar et al10 CA¼250Hz - 8KHz
HFA¼10KHz - 20KHz
Interacoustic,Denmark-headphones kross R/80
2 Somma et al18 CA¼250Hz - 8KHz
HFA¼9K - 18KHz
Amplaid A3 19 - headphonesHDA200 (Wedemark, Germany)
3 Mehrparvar et al5 CA¼500Hz - 8KHz
HFA¼10KHz - 16KHz
Audiometry AC 40 - headphones R80
4 Korres et al19 CA¼250Hz - 8KHz
HFA¼9KHz - 20KHz
Amplaid A321 - headphones HDA200 (Wedemark, Germany)
5 Porto et al20 CA¼250Hz - 8KHz
HFA¼9KHz - 16KHz
Audiometry SD50 Siemens -headphonesHD 200 (Wedemark, Germany)
6 Castro et al21 CA¼250Hz - 8KHz
HFA¼12kHz
Audiometry GSI 61 -headphonesTDH-39p.
Abbreviations: CA, conventional audiometry; HFA, high-frequency audiometry.
Table 3 General panorama of the common analyzed frequencies in the studies
N Author / Reference Frequencies Evaluated Common Studies
Audiometry AAF
1 Mehrparvar et al10 CA¼2KHz; 3KHz; 4KHz; 6KHz; 8KHz
HFA¼10KHz; 14KHz e 16KHz
Interacoustic,Denmark-headphones kross R/80
2 Somma et al18 CA¼2KHz; 3KHz; 4KHz; 6KHz; 8KHz
HFA¼10KHz; 14KHz e 16KHz
Amplaid A3 19 - headphonesHDA200 (Wedemark, Germany)
3 Mehrparvar et al5 CA¼2KHz; 3KHz; 4KHz; 6KHz; 8KHz
HFA¼10KHz; 14KHz e 16KHz
Audiometry AC 40 - headphones R80
4 Korres et al19 CA¼2KHz; 4KHz; 8KHz
HFA¼10KHz; 14KHz e 16KHz
Amplaid A321 - headphones HDA200 (Wedemark, Germany)
5 Porto et al20 CA¼2KHz; 3KHz; 4KHz; 6KHz; 8KHz
HFA¼10KHz; 14KHz e 16KHz
Audiometry SD50 Siemens -headphonesHD 200 (Wedemark, Germany)
6 Castro et al21 CA¼2KHz; 3KHz; 4KHz; 6KHz; 8KHz Audiometry GSI 61 -headphonesTDH-39p.
Abbreviations: CA, conventional audiometry; HFA, high-frequency audiometry.
Mean Control
Exposed Study
difference
W (fixed) 95% CI
MD
SD Mean Total SD Mean Total
Mehrparvar et al10 120 12.9 8.5 120 7.1 3.2 5.8 [4.17; 7.43] 11.4%
Somma et al18 186 12.0 6.9 98 10.3 1.2 1.70 [0.68; 2.72] 28.8%
Mehrparvar et al5 142 7.9 3.4 121 11.0 4.3 -3.70 [-4.05; -2.15] 33.3%
Korres et al19 139 12.7 11.2 32 7.0 5.0 5.70 [3.16; 8.24] 4.6%
Porto et al20 60 10.8 15.9 60 4.7 7.1 6.10 [1.69; 10.51] 1.5%
Castro et al21 30 5.4 2.3 30 5.8 2.5 -0.40 [-1.62; 0.82] 20.3%
100% [-0.15; 0.94] 0.39
461 677
Fixed effect model
Heterogeneity: I-squared = 96%; tau-squared = 12.58, p < 0.0001
Fig. 2 Analysis for the frequency 2KHz.
International Archives of Otorhinolaryngology Vol. 20 No. 3/2016
measure with the respective confidence grade, a 95% confidence grade (CI) shown in the forest plot, with a hetero-geneity evaluation across the studies.
In the analysis of the auditory limits for the frequencies in CA and HFA, we found a heterogeneity for all frequencies analyzed in this study (values above 90% in I-squared) which shows the difference in the statistical results, which were possibly the result of methodological heterogeneity.
►Figs. 2and3show that the data obtained in the meta-analysis were not significant in the frequencies of 2 kHz with confidence gaps: 0.15; 0.94 and with medium difference (MD) of 0.39 and 3 kHz with confidence gaps: 0.08; 1.54 with MD of 0.73, for both groups in this study.
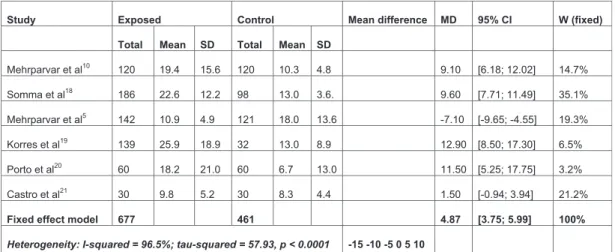
►Figs. 4,5,6,7,8, and9indicate significant values for the other frequencies (4 kHz, 6 kHz, 8 kHz, 10 kHz, 14 kHz, and 16 kHz). The highest result was the frequency of 16 kHz in
Study Exposed Control Mean
difference
MD 95% CI W (fixed)
D S n a e M l a t o T D S n a e M l a t o T
Mehrparvar et al10 120 8.6 11.9 120 8.6 3.7 0.00 [-2.23; 2.23] 13.1%
Somma et al18 186 16.8 9.6 98 10.3 1.2 6.50 [5.10; 7.90] 33.3%
Mehrparvar et al5 142 7.9 3.8 121 13.2 7.5 -5.30 [-6.78; -3.82] 30.0%
Porto et al20 60 12.2 16.8 60 3.8 9.1 8.40 [3.57; 13.23] 2.8%
Castro et al21 30 5.8 3.8 30 6.2 3.2 -0.40 [-2.18; 1.38] 20.7%
Fixed effect model 538 429 0.73 [-0.08; 1.54] 100%
Heterogeneity: I-squared = 97.2%; tau-squared = 31.61, p < 0.0001 -10 -5 0 5 10
Fig. 3 Analysis for the frequency 3KHz.
W (fixed) 95% CI
MD Mean difference Control
Exposed Study
SD Mean Total SD Mean Total
Mehrparvar et al10 120 21.2 13.9 120 9.5 4.4 11.70 [9.09; 14.31] 12.5%
Somma et al18 186 22.1 10.2 98 11.1 1.4 11.00 [9.51; 12.49] 38.1%
Mehrparvar et al5 142 9.4 3.4 121 16.6 10.9 -7.20 [-9.22; -5.18] 20.7%
Korres et al19 139 25.9 17.5 32 9.0 7.1 16.90 [13.09; 20.71] 5.8%
Porto et al20 60 18.2 18.5 60 4.3 8.2 13.90 [8.78; 19.02] 3.2%
Castro et al21 30 7.0 4.7 30 6.3 3.4 0.70 [-1.38; 2.78] 19.7%
100% [4.80; 6.65]
5.72 461
677 Fixed effect model
Heterogeneity: I-squared = 98.3%; tau-squared = 83.63, p < 0.0001 -20 -10 0 10 20
Fig. 4 Analysis for the frequency 4KHz.
W (fixed) 95% CI
MD Mean difference Control
Exposed Study
SD Mean Total SD Mean Total
Mehrparvar et al10 120 22.5 14.8 120 11.0 5.2 11.50 [8.69; 14.31] 14.5%
Somma et al18 186 22.0 10.7 98 12.6 2.7 9.40 [7.77; 11.03] 43.2%
Mehrparvar et al5 142 11.1 5.2 121 20.2 13.5 -9.10 [-11.65; -6.55] 17.6%
Porto et al20 60 24.8 19.0 60 12.5 11.4 12.30 [6.69; 17.91] 3.6%
Castro et al21 30 8.3 4.8 30 7.8 4.4 0.50 [-1.83; 2.83] 21.1%
100% [3.62; 5.76]
4.69 429
538 Fixed effect model
Heterogeneity: I-squared = 97.9%; tau-squared = 75.91, p < 0.0001 -15 -10 -5 0 5 10 15
Fig. 5 Analysis for the frequency 6KHz.
International Archives of Otorhinolaryngology Vol. 20 No. 3/2016
the control group with a confidence gap of 6.95 9.72 and MD of 8.33.
The study done by Somma et al. shows a measurement of the effect (odds ratio) that is larger for most the analyzed frequencies (3 kHz, 4 kHz, 6 kHz, 8 kHz, and 16 kHz) which contributed to a result favorable to the control group. Even though the study from Mehrparvar et al. indicates a greater effect for the study group in the frequencies of 10 kHz and 14 kHz, it was not determinant in thefinal result, which kept favorable to the control group. The
most expressive results were for the frequencies of 16 kHz (MD¼8.33); 4 kHz (MD¼5.75); followed by 8 kHz (MD
¼4.87), 6 kHz (MD¼4.69), and 14 kHz (MD¼3.97). The confidence gaps (CI) were larger for all frequencies analyzed in the study by Porto et al. in the frequencies of 2 kHz, 3 kHz, 4 kHz, 6 kHz, 8 kHz, and 10 kHz, with a variation in the CI from 9 to 16. The study by Korres et al.19presented the largest confidence gaps in the frequencies of 14 kHz and 16 kHz, with a variation between 23 and 20.
W (fixed) 95% CI
MD Mean difference Control
Exposed Study
SD Mean Total SD Mean Total
Mehrparvar et al10
4.8 10.3 120 15.6 19.4
120 9.10 [6.18; 12.02] 14.7%
Somma et al18
3.6. 13.0 98 12.2 22.6
186 9.60 [7.71; 11.49] 35.1%
Mehrparvar et al5
-7.10 13.6
18.0 121 4.9 10.9
142 [-9.65; -4.55] 19.3%
Korres et al19
8.9 13.0 32 18.9 25.9
139 12.90 [8.50; 17.30] 6.5%
Porto et al20
13.0 6.7 60 21.0 18.2
60 11.50 [5.25; 17.75] 3.2%
Castro et al21
4.4 8.3 30 5.2 9.8
30 1.50 [-0.94; 3.94] 21.2%
100% [3.75; 5.99]
4.87 461
677 Fixed effect model
Heterogeneity: I-squared = 96.5%; tau-squared = 57.93, p < 0.0001 -15 -10 -5 0 5 10
15
Fig. 6 Analysis for the frequency 8KHz.
W (fixed) 95% CI
MD Mean difference Control
Exposed Study
SD Mean Total SD Mean Total
Mehrparvar et al10 120 9.8 12.9 120 5.1 4.3 4.70 [2.27; 7.13] 20.8%
Somma et al18 186 27.2 13.3 98 14.7 4.7 12.50 [10.37; 14.63] 27.3%
Mehrparvar et al5 142 5.3 4.5 121 9.8 8.0 -4.50 [-6.11; -2.89] 47.8%
Korres et al19 139 27.9 24.6 32 15.1 18.5 12.80 [5.20; 20.40] 2.1%
Porto et al20 60 23.1 24.6 60 10.8 19.3 12.30 [4.39; 20.21] 2.0%
100% [1.64; 3.86]
2.75 431
647 Fixed effect model
Heterogeneity: I-squared = 97.7%; tau-squared = 83.48, p < 0.0001 -20 -10 0 10 20
Fig. 7 Analysis for the frequency 10KHz.
Mean Control
Exposed Study
difference
W (fixed) 95% CI
MD
SD Mean Total SD Mean Total
Mehrparvar et al10 120 17.4 18.5 120 6.8 8.2 10.60 [6.98; 14.22] 19.2%
Somma et al18 186 41.5 12.2 98 24.7 10.0 16.80 [14.16; 19.44] 36.0%
Mehrparvar et al5
-13.30 12.0
20.4 121 8.2 7.1
142 [-15.83; -10.77] 39.4%
Korres et al19 139 48.2 37.4 32 21.4 26.8 26.80 [15.63; 37.97] 2.0%
Porto et al20
22.9 13.4 60 26.1 31.1
60 17.70 [8.91; 26.49] 3.3%
100% [2.38; 5.55]
3.97 431
647 Fixed effect model
Heterogeneity: I-squared = 98.7%; tau-squared = 295.1, p < 0.0001 -30 -20 -10 0 10
20 30
Fig. 8 Analysis for the frequency 14KHz.
International Archives of Otorhinolaryngology Vol. 20 No. 3/2016
Final Comments
The meta-analysis did not definitely answer the question pro-posed in this study. It indicates that the frequency of 16 kHz (HFA) is more sensitive in the premature identification of hearing loss in people with normal auditory limits (CG) as well as the frequency of 4 kHz (CA), this one being less expressive (difference of 3 in the MD). This published literature analysis indicates that factors that limit the use of HFA include the absence of standards for this exam in the Brazilian legislation and the cost of the device, even though it useful for monitoring 250Hz and 8KHz frequencies. It also shows the need for further research on the frequencies of 4 kHz, 6 kHz, 8 kHz, 10 kHz, 14 kHz, and 16 kHz, for which we recommend controlling for the methodological bias (age group, presbycusis influence, comor-bidity, hearing, gender, noise exposure level at work, time of exposure to noise, and use and type of PPEs). In other words, it is important to define an outline and methodology applied.
References
1 Ogido R, Costa EA, Machado HC. Prevalência de sintomas auditivos
e vestibulares em trabalhadores expostos a ruído ocupacional.
Saúde Pública 2009;43(2):377–380
2 -Sakae TM, Sakae O, Spartalis PB Jr, Moretti GF. Perfil
epidemio-lógico e audioepidemio-lógico dos trabalhadores atendidos pelo Serviço
Social da Indústria de Brusque–Santa Catarina. AMRIGS 2009;
53(2):144–149
3 -Santana MCCP, Brandão KKCP, Goulart BNG, Chiari BM.
Fonoau-diologia e Saúde do Trabalhador: vigilância é Informação para
Ação!. CEFAC 2009;11(3):522–528
4 Leão NL, Dias FAM. Perfil audiométrico de indivíduos expostos ao
ruído atendidos no núcleo de saúde ocupacional de um hospital do
município de Montes Claros, Minas. CEFAC 2010;12(2):242–249
5 Mehrparvar AH, Mirmohammadi SJ, Davari MH, et al. Conventional
Audiometry, Extended High-Frequency Audiometry, and DPOAE for Early Diagnosis of NIHL. Iran Red Crescent Med J 2014;16(1):e9628
6 Ganime JF, Almeida LS, Robazzi MLCC, Valenzuela SS, Faleiro SA. O
ruído como um dos riscos ocupacionais: uma revisão da literatura.
Enferm. Glol 2010;19:1–15
7 Portaria do SSST N° 19, de 9 de abril de 1998 [Internet]: Brasilia:
Ministério do trabalho e do Emprego; 1998 Available at: http:// portal.mte.gov.br/portal-mte/ Accessed Apr 09, 2015
8 Gonçalves CGO, Couto CM, Carraro JM, Leoneli BS. Avaliação da
colocação de protetores auriculares em grupos com e sem
treina-mento. CEFAC 2009;11(2):345–352
9 Ottoni AO, Barbosa-Branco A, Boger ME, Garavelli SL. Study of
the noise spectrum on high frequency thresholds in workers exposed to noise. Braz J Otorhinolaryngol 2012;
78(4):108–114
10 Mehrparvar AH, Mirmohammadi SJ, Ghoreyshi A, Mollasadeghi A,
Loukzadeh Z. High-frequency audiometry: a means for early diagnosis of noise-induced hearing loss. Noise Health 2011;
13(55):402–406
11 Jacob LCB, Stumpf CC, Bitencourt RF, Marques JM, Puppi C,
Gonçalves PT. Avaliação audiológica em indivíduos com neopla-sias expostos a agentes quimioterápicos. Fono Atual 2005;8(31): 12–25
12 Sahyeb DR, Costa Filho OA, Alvarenga KF. Audiometria de alta
frequência: estudo com indivíduos audiologicamente normais.
Rev Bras Otorrinolaringol (Engl Ed) 2003;69(1):93–99
13 The Cochrane Collaboration [Internet]. Cochrane handbook for
systematic reviews of interventions. 2001. [cited Aug 26, 2014]. Available at: http://www.cochrane.org/training/cochrane-hand-book. Accessed Apr 09, 2014
14 Biblioteca Virtual em Saúde (BIREME). DEC’s– Descritores em
Ciências da Saúde. [Internet]. Available at: http://decs.bvs.br/P/ DeCS2013_Alfab.htm. Accessed Jan 16, 2014
15 MacPherson DW. Evidence-based medicine. CMAJ 1995;152(2):
201–204
16 Atallah AN, Trevisani V, Valente O. Tomada de decisões
Terapêu-ticas com Base em Evidências Científicas. AtualizaçãoTerapeutica
-Manual prático de diagnóstico e tratamento. Available at: http:// www.centrocochranedobrasil.org.br/cms/apl/artigos/artigo_540. pdf. Accessed Feb 9, 2015
17 Pereira MG, Galvão TF. Revisão sistemática Extração, avaliação da
qualidade e síntese dos dados para revisão sistemática. Epidemiol
Serv Saúde Brasília 2014;23(3):577–578
18 Somma G, Pietroiusti A, Magrini A, et al. Extended high-frequency
audiometry and noise induced hearing loss in cement workers.
Am J Ind Med 2008;51(6):452–462
19 Korres GS, Balatsouras DG, Tzagaroulakis A, Kandiloros D,
Fereki-dis E. Extended high-frequency audiometry in subjects exposed to
occupational noise. B-ENT 2008;4(3):147–155
20 Porto MA, Gahyva DL, Lauris JR, Lopes AC. Audiometric evaluation
in extended high frequencies of individuals exposed to
occupa-tional noise. Pro Fono 2004;16(3):237–250
21 Castro IFC, Conde CA, Paiva APQF, Oliveira LTN, Bernardi APA.
Estudo do perfil audiométrico em alta freqüência em
trabalhadores expostos a ruído. CEFAC 2004;2(6):203–208
Mean Control
Exposed Study
difference
W (fixed) 95% CI
MD
SD Mean Total SD Mean Total
Mehrparvar et al10
11.4 10.1 120 17.0 39.4
120 29.30 [25.64; 32.96] 14.2%
Somma et al18
6.8 30.2 98
7.9 42.6
186 12.40 [10.64; 14.16] 61.3%
Mehrparvar et al5 142 10.3 10.6 121 31.3 14.1 -21.00 [-24.06; -17.94] 20.3%
Korres et al19
36.1 35.3 32
44.2 64.2
139 28.90 [14.39; 43.41] 0.9%
Porto et al20 60 28.2 23.8 60 10.4 18.6 17.80 [10.16; 25.44] 3.3%
100% [6.95; 9.71]
8.33 431
647 Fixed effect model
Heterogeneity: I-squared = 99.2%; tau-squared = 449.3, p < 0.0001 -40 -20 0 20 40
Fig. 9 Analysis for the frequency 16KHz.
International Archives of Otorhinolaryngology Vol. 20 No. 3/2016