ABSTRACT:Objective: To identify variables predictors of linear growth in preschool children attending public child day care centers of Campina Grande, Paraíba. Methods: A cross-sectional study on a probabilistic sample of 335 children attending child day care centers. Were obtained information about socioeconomic, maternal and children’s characteristics. The height/age (Z-score) was analyzed as continuous dependent variable. Anthropometric data were obtained in compliance with the recommendations of the World Health Organization. The Multicentre Growth Reference Study was used as the reference population. The data were subjected to multiple linear regression analysis using the hierarchical model. Results: Children who slept in rooms with at least two people, households without garbage collection, households with no refrigerator, rural zone, illiterate mothers, mothers of short stature, low birth weight and stay in child day care center at part time were the conditions associated with worse height/age of children. Conclusion: There is a clear diference in linear growth with multicausal characteristic in which the low birth weight, as an expression of adverse history, and the socioeconomic conditions, as an expression of health inequities, proiling the genetic potential of growth.
Keywords: Child day care centers. Child, preschool. Body height. Growth. Nutritional status. Anthropometry.
Linear growth of children attending public
daycare centers in the municipality
of Campina Grande, Paraíba, Brazil
Crescimento linear das crianças assistidas em creches
públicas do município de Campina Grande, Paraíba
Dixis Figueroa PedrazaI
ORIGINAL ARTICLE / ARTIGO ORIGINAL
IUniversidade Estadual da Paraíba– Campina Grande (PB), Brazil.
Corresponding author: Dixis Figueroa Pedraza. Universidade Estadual da Paraíba. Avenida das Baraúnas, 351, Campus Universitário,
Bodocongó, CEP: 58109-753, Campina Grande, PB, Brasil. E-mail: [email protected]
INTRODUCTION
Child malnutrition, including height deicit, is associated with higher morbidity and mortality1,2. Children with growth delay present more risk of severe diarrheic episodes and infectious diseases, including paludism, meningitis, and pneumonia1,3. Most of the deaths of children under ive years old happens through a limited number of conditions, such as neonatal causes and presence of diseases (pneumonia, diarrhea, malaria, mea-sles, HIV/AIDS), and about one-third of these deaths are associated with malnutrition4. All degrees of malnutrition contribute to child mortality in an increasing relation accord-ing to the severity of the anthropometric deicit3.
Growth damage also develop other undesirable consequences, like compromise of psychomotor and mental development, lower school improvement, lower schooling level and productive capacity in the adult age, higher occurrence of non-transmitta-ble chronic diseases and illnesses, and higher risk of obesity in the adult age1-3,5-7. If the effects of child chronic malnutrition are not corrected until the second year of life, they can become permanent and irreparable8,9. In female cases, childhood growth delay determines adult women of low height subject to a higher risk of generating children with low birth weight. These children will have a higher risk of presenting growth delay and producing low-weight newborns, which characterizes the intergeneration effect of malnutrition5.
Children’s lineal growth delay is the result of multiple circumstances and several deter-miners, including malnutrition before intrauterine and postnatal conception6. In order to have a great growth, children need the intake of energy and nutrients in proper amounts, of disease absence and proper care2. Poor nourishment and/or recurrent infections (especially
RESUMO:Objetivos: Identiicar variáveis preditoras do crescimento linear em crianças pré-escolares assistidas nas creches públicas do município de Campina Grande, Paraíba. Métodos: Estudo transversal em amostra probabilística de 335 crianças assistidas em creches. Foram contempladas informações socioeconômicas, maternas e das crianças. A estatura/idade (escore-Z) foi analisada como variável contínua dependente. Os dados antropométricos foram obtidos obedecendo às recomendações da Organização Mundial da Saúde (OMS). Utilizou-se como população de referência a do Multicentre Growth Reference Study. Os dados foram submetidos à análise de regressão linear múltipla utilizando-se o modelo hierarquizado. Resultados: Crianças que dormiam em cômodos com no mínimo mais duas pessoas, domicílios sem coleta de lixo, domicílios sem geladeira, zona rural, mães não alfabetizadas, mães de baixa estatura, baixo peso ao nascer e permanência na creche em tempo parcial foram as condições que se associaram a pior condição de estatura/idade das crianças. Conclusão: Existe um claro diferencial de crescimento linear com coniguração multicausal no qual o baixo peso ao nascer, como expressão de antecedentes adversos, e as condições socioeconômicas, como expressão de iniquidades em saúde, diagramam o potencial genético de crescimento.
respiratory and gastrointestinal diseases), which happen more frequently combined, stand-out as immediate causes of growth delay3,8.
Therefore, a wide range of social and economic conditions is inserted in this context, which makes children’s chronic malnutrition a phenomenon of multifactor origin8. These condi-tions comprise a series of factors that are strictly associated with general life condiThese condi-tions and with the capacity of people to supply their basic needs, such as food, housing, and sanitary assistance3. Factors such as food insecurity and family nutrition, low educational level, lack of access to health public services of quality, and non-healthy environments are the main determiners of height deicit, in which the most damaging efect of poverty is seen in the lineal growth rather than in the body weight2. In Brazil, this complexity has been seen by analyzing the expressive decrease in height deicits, which is explained by the increase of acquisitive power of the most vulnerable families, the improvement of mother’s schooling level, and the expansion of basic health care and of the basic sanitation public network2,3,10.
Thus, children attending public day care centers are beneited from the ofer of food and care in these institutions, but they are similarly vulnerable to the acquisition of infectious processes that can negatively inluence their nutritional status10-14. In addition, these chil-dren are exposed to low height, which is conditioned by the socioeconomic condition of the beneited families, as well as the consequence of problems in the care provided to children, which includes privation/non-satisfaction to speciic rules associated with the quality of food provided, with the structure of the kitchens, and with the safe management of food10,11,15.
The present study aimed at identifying variable predictors of linear growth in preschool children attending public child day care centers of Campina Grande, Paraíba, Brazil.
METHODS
This is a cross-sectional study that is part of the project “Saúde e nutrição das crianças assistidas em creches públicas do município de Campina Grande, Paraíba [Health and nutrition of children attended at public day care centers in the city of Campina Grande, Paraíba, Brazil].” Data collection happened in the period from October to November 2011, in public day care centers in the city of Campina Grande, Paraíba, Brazil, belonging to the Department of Education. A total of 25 day care centers were working in diferent neighborhoods of the city at data collection, and they were generally located in areas of low socioeconomic level. According to the location, 23 day care centers were in the urban area and 2, in the rural area. Based on the age range, 8 day care centers provided care in nurseries (children aged 4–20 months) and 93% of the children were 24-month old or older.
The calculation to estimate the sample size was based on the procedure for proportion description16. The following were considered: an estimated prevalence (p) of height deicit in children under the age of 5 years 7.0%17, a sampling error (d) of 3%, and a 95% coni-dence level (Zα2 = 1.962), using the formula
N * Zα2 * p * q d2 * (N – 1) + Zα2 * p * q n =
in which N is the population total amount, Zα2 = 1.962 (if there is a 95% conidence), p is the expected proportion, q = 1 - p, d is the arbitrary precision (estimation error). The cal-culated value (252) was added in 10% for losses and refusals, with a 1.2 efect of sampling outline, thus totaling a sample of 335 subjects. Proportional sampling sizes were considered for the study of children according to the location area of the day care center (urban, rural), the child’s age (below two years, two years, or older), and the day care center size (small sized: 60 – 79 children, medium-sized: 80 – 99 children, and large-sized: 100 or more children).
For the sample selection, 14 day care centers were chosen by simple random selection, in which 1 was chosen among those institutions located in the rural area and 2 among those with nursery. Subsequently, after the list of children attended in the day care centers was at hand, 15 children aged 24 months or older were systematically chosen by small-sized day care center (3 day care centers), 20 by medium-sized day care center (3 day care centers), 25 by large-sized day care center (5 day care centers), and 35 in the selected day care center in the rural area. In each of the 2 chosen day care centers with nursery, 35 children under the age of 2 years were chosen.
Data collection counted with the participation of a trained team comprising teachers and students from health undergraduation courses or related areas. With regard to this study, in addition to children’s height, data regarding the socioeconomic conditions (sanitary drainage; garbage collection; presence of bathroom; water supply; treatment of drinking water; pos-session of durable goods — TV, DVD player, refrigerator, washing machine, car; number of people in the domicile; number of people sleeping together in the same room as the child; social program beneit; household location); maternal characteristics (work outside home, literacy, number of prenatal appointments, height); and children’s proile (age, gender, birth weight, mother’s perception on health, staying period in day care center) were included.
part of the equipment, with straight neck and chin deviated of the chest. Measurements were performed in duplicate, considering a maximum variation of 0.3 mm, and the inal measurement was the result of the average estimation of two measurements.
The Z-scores of children’s height/age were calculated using the program WHO Anthro 2009. The population from the Multicentre Growth Reference Study was used as a
refer-ence, in compliance with the WHO current recommendations19.
Information regarding socioeconomic condition, maternal data, and mothers’ perception on children’s health was obtained using a structured questionnaire applied to the children’s mothers. Birth date, gender, and birth weight of children were removed from the child’s health notebook. The child’s age was calculated in months, based on the diference between the interview date and birth date. Time of children’s stay in the day care center was a piece of information known in the sampling stage, when the professionals from the day care cen-ters indicated if the children stood in the day care cencen-ters during a part-time or full-time period. Literacy of mothers was considered as the ability of reading, writing, and making written accounts. The mother’s height was obtained following the same conditions and procedures described for children. The low maternal height was established through the cut point of 155.0 cm that corresponds to the 5th percentile of the height-to-age relation, considering the age of 20 years or older20.
With the aim of ensuring typing validation, data were typed with double entrance through the Excel program (Microsoft Inc., United States). After inishing typing, the two databases were crossed with the use of the Validate app of the Epi-Info program, version 6.04b (WHO/CDC, Atlanta, United States), thus enabling the veriication of data consistency and creation of the inal database that was used for statistical analysis. The statistical analy-ses were carried out through the program R, version 2.10.0. In order to test the assumption of variable normality involved in the study, the Shapiro-Wilk’s test was applied.
The height/age (Z-score) was analyzed as a dependent continuous variable. The Student’s
t-test was applied to indicate the diferences among means in the bivariate analyses. All vari-ables with p-value ≤ 0.25 in the bivariate analyses were chosen for the initial inclusion in the analysis of regression. Before multiple lineal regression, in order to analyze the existence of multicollinearity among the independent variables, a matrix was built and the level of correlation was determined through Spearman’s correlation test, in an attempt to exclude collinear variables (r > 0.80) in a way that the correlation matrix could not ind multicollinear-ity. Furthermore, through the χ2 test, possible diferences in the socioeconomic variables were found between the group of children that stood at part-time day care centers and those that stood at full-time periods. The groups were not diferent, which indicates the absence of a plausible confusion if the permanence for a longer time in the day care center were among children with the worst socioeconomic conditions.
1. children variables — proximal level (age, gender, birth weight, mother’s perception on health, day care center staying period)
2. maternal variables — intermediary level (work outside home, literacy, number of prenatal appointments, height/age)
3. socioeconomic variables — distal level (sanitary drainage; garbage collection; presence of bathroom; water supply; treatment of drinking water; possession of durables goods — TV, DVD player, refrigerator, washing machine, car; number of people in the domicile; number of people sleeping together in the same room as the child; social program beneit; household location).
All independent variables were dichotomic, and the categories that were taken as reference were codified with value zero, whereas the risk categories were codified with value one.
Several multivariate models were rolled by beginning with the explanatory variables that belong to the distal level, in which one by one were introduced (forward method), and vari-ables that were statistically associated with height/age remained, with a 10% signiicance level. The same step was repeated for the subsequent levels (intermediary and proximal). The 5% signiicance level was considered to indicate an association.
The Research Ethics Committee of Universidade Estadual de Paraíba approved the project under number 0050.0133.000-11. All mothers whose children were assessed and the prin-cipals of the day care centers signed the free informed consent. Results were published in the relevant instances through meetings with the Department of Education of the city and personal contacts with the children’s parents or responsible ones. Disclosure comprised the city diagnosis, per day care center and children, as well as adequate nutritional and health guidance to the detected problems.
RESULTS
Of the 2,749 children, 2,633 were considered eligible for the study; 60 children were excluded because they were twins, 38 because they were adopted, 8 for being mothers younger than 18 years, and 10 for presenting physical problems that would compromise the anthropometric evaluation. In 14 cases, the selected children did not go to the day care center or were not with their mothers in the day of data collection, 13 mothers refused in taking part of the investigation and it was impossible to perform the anthropometric eval-uation in 9 children, totaling 299 children.
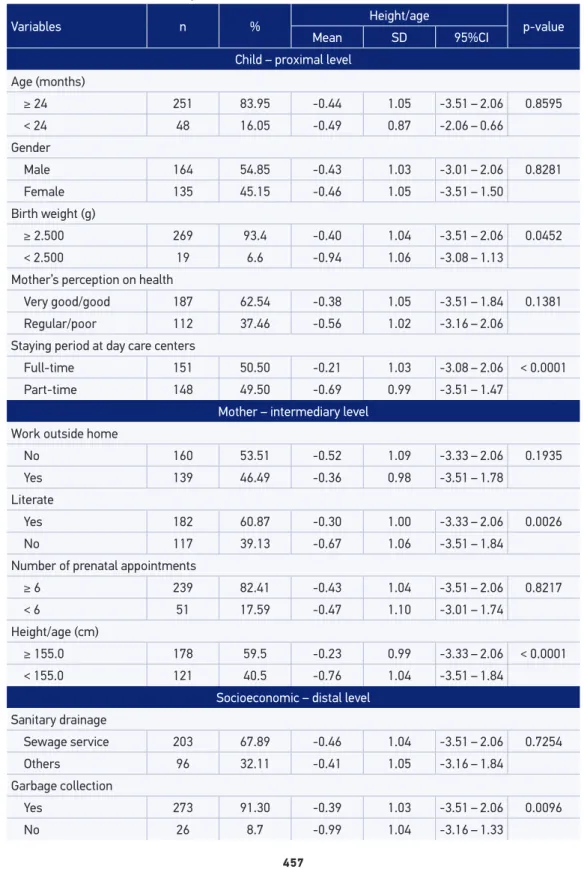
Variables n % Height/age p-value Mean SD 95%CI
Child – proximal level Age (months)
≥ 24 251 83.95 -0.44 1.05 -3.51 – 2.06 0.8595
< 24 48 16.05 -0.49 0.87 -2.06 – 0.66
Gender
Male 164 54.85 -0.43 1.03 -3.01 – 2.06 0.8281
Female 135 45.15 -0.46 1.05 -3.51 – 1.50
Birth weight (g)
≥ 2.500 269 93.4 -0.40 1.04 -3.51 – 2.06 0.0452
< 2.500 19 6.6 -0.94 1.06 -3.08 – 1.13
Mother’s perception on health
Very good/good 187 62.54 -0.38 1.05 -3.51 – 1.84 0.1381
Regular/poor 112 37.46 -0.56 1.02 -3.16 – 2.06
Staying period at day care centers
Full-time 151 50.50 -0.21 1.03 -3.08 – 2.06 < 0.0001
Part-time 148 49.50 -0.69 0.99 -3.51 – 1.47
Mother – intermediary level Work outside home
No 160 53.51 -0.52 1.09 -3.33 – 2.06 0.1935
Yes 139 46.49 -0.36 0.98 -3.51 – 1.78
Literate
Yes 182 60.87 -0.30 1.00 -3.33 – 2.06 0.0026
No 117 39.13 -0.67 1.06 -3.51 – 1.84
Number of prenatal appointments
≥ 6 239 82.41 -0.43 1.04 -3.51 – 2.06 0.8217
< 6 51 17.59 -0.47 1.10 -3.01 – 1.74
Height/age (cm)
≥ 155.0 178 59.5 -0.23 0.99 -3.33 – 2.06 < 0.0001
< 155.0 121 40.5 -0.76 1.04 -3.51 – 1.84
Socioeconomic – distal level
Sanitary drainage
Sewage service 203 67.89 -0.46 1.04 -3.51 – 2.06 0.7254
Others 96 32.11 -0.41 1.05 -3.16 – 1.84
Garbage collection
Yes 273 91.30 -0.39 1.03 -3.51 – 2.06 0.0096
No 26 8.7 -0.99 1.04 -3.16 – 1.33
Variables n % Height/age p-value Mean SD 95%CI
Domicile water supply
Public service 252 84.28 -0.43 1.04 -3.51 – 2.06 0.4378
Others 47 15.72 -0.55 1.04 -2.69 – 1.84
Treatment of drinking water
Yes 245 81.93 -0.41 1.04 -3.51 – 2.06 0.2151
No 54 18.06 -0.6 1.03 -3.01 – 1.66
Bathroom in the domicile
Yes 230 79.59 -0.34 1.06 -3.51 – 2.06 0.0008
No 69 23.07 -0.79 0.91 -3.16 – 1.15
TV
Yes 294 98.33 -0.43 1.03 -3.51 – 2.06 0.2576
No 5 1.67 -1.26 1.39 -3.16 – 0.27
DVD player
Yes 271 90.64 -0.41 1.03 -3.51 – 2.06 0.0512
No 28 9.36 -0.84 1.07 -3.16 – 1.21
Refrigerator
Yes 263 87.96 -0.39 1.03 -3.51 – 2.06 0.0188
No 36 12.04 -0.85 1.06 -3.16 – 1.15
Washing machine
Yes 151 50.5 -0.32 1.04 -3.51 – 2.06 0.0281
No 148 49.5 -0.58 1.02 -3.16 – 2.05
Car
Yes 92 30.77 -0.26 1.09 -3.51 – 2.06 0.0457
No 207 69.33 -0.53 -3.33 – 2.05
Number of people in the domicile
< 6 213 71.23 -0.36 1.01 -3.33 – 2.06 0.0247
≥ 6 86 28.76 -0.67 1.09 -3.51 – 1.74
Number of people that sleep together in the same room as the child
< 3 123 41.13 -0.13 0.91 -2.83 – 2.06 < 0.0001
≥ 3 176 58.86 -0.67 1.07 -3.51 – 1.74
Social program beneit
Yes 221 73.91 -0.53 1.06 -3.51 – 2.06 0.0150
No 78 26.08 -0.21 0.96 -2.83 – 2.05
Household location
Urban 276 92.31 -0.48 1.03 -3.51 – 2.06 0.0960
Rural 23 7.69 -0.07 1.08 -1.78 – 1.84
Table 1. Continuation.
Given the socioeconomic variables, means of the height/age Z-score were lower in cases of children that lived in domiciles without garbage collection, without bathroom, living with six or more people and when three or more people slept together in the child’s room. Possession of some durable goods also presented an association with height/age, and the most vulnerable children were from families that did not have a refrigerator, DVD player, washing machine, and car. Children of families that were beneitted from social programs were also negatively associated with height/age.
Analyses of the combined efects of explanatory variables regarding the height/age index are given in Table 2. Among the socioeconomic variables, children who slept in rooms with at least other two people and children whose domiciles did not have garbage collection, with-out refrigerator, and from the rural region remained statistically signiicant regarding the worst condition of height/age. Illiterate and low-height mothers also represented conditions
Variables
Model 1 Distal
Model 2 Distal + intermediary
Model 3
Distal + intermediary + proximal
β p-value β p-value β p-value
Socioeconomic Number of people sleeping together in the same room as the child
≥ 3 -0.48 0.0000 -0.45 0.0002 -0.39 0.0012
Garbage collection
No -0.64 0.0022 -0.56 0.0089 -0.47 0.0284
Refrigerator
No -0.39 0.0266 -0.36 0.0381 -0.35 0.0457
Household location
Rural 0.48 0.0287 0.52 0.0177 0.46 0.0375
Mother
Literate
No -0.24 0.0522 -0.29 0.0180
Height/age (cm)
< 155.0 -0.52 0.0002 -0.54 0.0002
Child Birth weight (g)
< 2.500 0.40 0.0007
Staying period at day care centers
Part-time -0.49 0.0338
Table 2. Hierarchical lineal regression model of the determining factors of the height/age index (Z-score) from preschool children. Campina Grande, PB, Brazil, 2011.
β: regression coeicient; Model 1: variables that were adjusted one by the other; Model 2: adjusted by Model 1 variables;
that are negatively associated with height/age of their children. Low birth weight and child’s part-time stay in the day care center also remained highly associated with increased nega-tive deviations of height/age, in an adjusted model.
DISCUSSION
The present study results show that day care centers might be a positive option in the physical growth possibility of children belonging to low socioeconomic families. The lon-ger stay in the day care center might favor access to proper nourishment that is provided in the institution, among children whose families cannot ensure food and nutritional safety. In literature, the relation between growth in height and day care center frequency had been previously documented in two review studies21,22. The irst21 included longitudinal studies and the second22, observational studies. The present investigation results are an addition to these studies, and the associations found relect the reality of children, whose staying period in the day care center was not indicated based on socioeconomic diferences.
The present study results emphasize that height deicit is favored in environments with worse socioeconomic and environmental conditions.23. The associations of several negative conditions of the studied children’s socioeconomic situation with low height also recom-mend the need of advancing with improvements in the acquisitive power of the family, in the mother’s schooling level, in health care, and sanitation to obtain gains in the malnutri-tion decline1,2,5. Hence, if we also consider the beneit for children’s physical growth that stay longer at day care centers, we suggest that good infrastructure and assistance condi-tions in these institucondi-tions might ease the negative inluence of socioeconomic condicondi-tions.
We also veriied the signiicant impact that birth weight, mother’s height, and residence area had on the height/age index variation. The interference that birth weight has on physical growth has been continuously seen in literature, thus showing an inverse relation between the two factors12,23-27. In this casuistic, low birth weight relects the restriction of intrauter-ine growth and makes children more vulnerable to postnatal factors that might result in the development of diseases28. A systematic review approaching such large literature indi-cated a higher risk of preterm birth and low weight among mothers of single births with low gestational weight gain29. Hence, it is worth mentioning that the consequences of low birth weight and height deicit in childhood can go beyond due to the negative repercus-sions on health at long term30-32.
The association of mother’s height deicit with the child’s, explained by sharing genetic, socioeconomic, and environmental conditions26,27,was also seen in other recent studies3,5,27,33-35. Birth weight is seen as an important factor in this relation, because low-height women are more subjected to getting pregnant of children with low birth weight, who, in turn, might have higher risks of growth delay5. This has been considered one of the main dilemmas of the contemporary public health27.
National Survey of Demography and Health (PNDS), growth delay was more frequent in the rural area (7.6%) than in the urban area (6.9%)17. Data from Pernambuco State indicated that living in rural areas is another factor associated with height deicit5. These results are important to show that, although Brazil became a country of predominant rural society for an urbanized country36, there are still some necessary interventions that should con-sider speciic problems.
Although no statistical association between the number of prenatal appointments and the height/age index was found in this study, the importance of prenatal care for growth is known. The prenatal adjustment seems important in the mother–child health and in the prevention of fetus complications during intrauterine growth and newborn welfare37,38. The early beginning of prenatal care prevents premature growth and low weight, as well as it promotes the good practice of breastfeeding36. Protection of prenatal adjustment against low birth weights has been inclusively pointed out in systematic review studies39,40. Thus, it is important to emphasize the importance of orientation to the mother and family since prenatal care in order to prevent low birth weight41.
We could not indicate the number of premature children in this study, which could lead to diferent results, since this study involves children aged under two years old who could not have recovered their growth potential, especially children that are small for their gesta-tional age and evolve with catch up failure42. Hence, we should observe the importance of studies regarding such a situation, since the period until the age of two years should rep-resent the target of nutritional interventions to prevent the growth deicit without health damage7. Another limitation could be the intrinsic diiculty of cross-sectional outlines to comprehend dynamic, continuous, and quick growth change processes43. Nonetheless, in order to overcome these limitations, the control performed for confounding variables enables the achievement of legitimate associations and conclusions.
The author reports no conlicts of interest regarding the positions presented herein, therefore there are no connections with institutions of performance or regulation related to day care centers.
CONCLUSION
1. Lima AL, Silva AC, Konno SC, Conde WL, Benicio MH, Monteiro CA. Causes of the accelerated decline in child undernutrition in Northeastern Brazil (1986– 1996–2006). Rev Saúde Pública 2010; 44(1): 17-27. 2. Monteiro CA, Benicio MH, Conde WL, Konno S,
Lovadino AL, Barros AJD, et al. Narrowing socioeconomic inequality in child stunting: the Brazilian experience, 1974–2007. Bull World Health Organ 2010; 88: 305-11. 3. de Onis M, Frongillo EA, Blössner M. Is malnutrition
declining? An analysis of changes in levels of child malnutrition since 1980. Bull World Health Organ 2000; 78(10): 1222-33.
4. Barros FC, Victora CG, Scherpbier R, Gwatkin D. Socioeconomic inequities in the health and nutrition of children in low/middle income countries. Rev Saúde Pública 2010; 44(1): 1-16.
5. Leal VL, Lira PIC, Menezes RCI, Oliveira JS, Sequeira SLA, Andrade SLS, et al. Fatores associados ao declínio do déicit estatural em crianças e adolescentes em Pernambuco. Rev Saúde Pública 2012; 46(2): 234-41. 6. Onis M, Blössner M, Borghi E. Prevalence and trends of stunting among pre-school children, 1990–2020. Pub Health Nut 2012; 15(1): 142-8.
7. Victora C. Los mil días de oportunidad para intervenciones nutricionales. De la concepción a los dos años de vida. Arch Argent Pediatr 2012; 110(4): 311-7.
8. Sánchez-Abanto J. Evolución de la desnutrición crónica en menores de cinco años en el Perú. Rev Peru Med Exp Salud Publica 2012; 29(3): 402-5.
9. Victora C, Adair L, Fall C, Hallal P, Martorell R, Richter L, et al. Maternal and child undernutrition: consequenc es for adult health and human capital. Lancet 2008; 371(9609): 340-57.
10. Bogus CM, Nogueira-Martins MCF, Moraes DEB, Taddei JAA. Cuidados oferecidos pelas creches: percepções de mães e educadoras. Rev Nutr 2007; 20(5): 499-514.
11. Figueroa Pedraza D, Queiroz D, Sales MC. Doenças infecciosas em crianças pré-escolares brasileiras assistidas em creches. Ciênc Saúde Coletiva 2014; 19(2): 501-18.
12. Oliveira JS, Lira PIC, Carvalho AGC, Barros MFA, Lima MC. Fatores associados ao estado nutricional em crianças de creches públicas do município de Recife, PE, Brasil. Rev Bras Epidemiol 2013; 16(2): 502-12. 13. Goulart RMM, Banduk MLS, Taddei JAAC. Uma revisão
das ações de nutrição e do papel do nutricionista em creches. Rev Nutr 2010; 23(4): 655-65.
14. Biscegli TS, Romera J, Candido AB, Santos JM, Candido ECA, Binotto AL. Estado nutricional e prevalência de enteroparasitoses em crianças matriculadas em creche. Rev Paul Pediatr 2009; 27(3): 289-95.
15. Vasconcelos RM, Tancredi RCP, Marin VA. Políticas e normativas aplicadas às creches municipais do Rio de Janeiro. Ciênc Saúde Colet 2013; 18(11): 3281-90. 16. Figueroa Pedraza D, Queiroz D, Menezes TN. Segurança alimentar em famílias com crianças matriculadas em creches públicas do estado da Paraíba, Brasil. Rev Nut 2013; 26(5): 517-27.
17. Brasil. Ministério da Saúde. Pesquisa nacional sobre demograia e saúde da criança e da mulher. Brasília: Ministério da Saúde; 2008.
18. World Health Organization (WHO). Physical status: the use and interpretation of anthropometry. Geneva: WHO; 1995. (WHO - Technical Report Series, 854). 19. World Health Organization (WHO). WHO Child Growth Standards. Length/height-for-age, weight-for-age, weight-for-length, weight-for-height and body mass index-for-age. Methods and development. Geneva: World Health Organization; 2006. 20. National Center for Health Statistic. Growth
Curves; 2000. Disponível em: http://www.cdc.gov/ growthchards. (Acessado em 31 de julho de 2014). 21. Pereira AS, Lanzillotti HS, Soares EA. Frequência à
creche e estado nutricional de pré-escolares: uma revisão sistemática. Rev Paul Pediatr 2010; 28(4): 366-72. 22. Figueroa Pedraza D, Souza MM, Rocha ACD. Fatores
associados ao estado nutricional de crianças pré-escolares brasileiras assistidas em creches públicas: uma revisão sistemática. Rev Nutr 2015; 28(4): 451-64. 23. Figueiroa JN, Alves JGB, Lira PIC, Batista Filho M. Evolução intergeracional da estatura no Estado de Pernambuco, Brasil, entre 1945 e 2006. 2 – aspectos analíticos. Cad Saúde Pública 2012; 28(8): 1468-78. 24. Dallabona A, Cabral SCh, Hõfelman DA. Variáveis
infantis e maternas associadas à presença de sobrepeso em crianças de creches. Rev Paul Pediatr 2010 28(4): 304-13.
25. Toloni MH, Kontantyner T, Taddei JAAC. Fatores de risco para perda ponderal de crianças freqüentadoras de berçários em creches do município de São Paulo. Rev Paul Pediatr 2009; 27(1): 53-9.
26. Sousa CPC, Sousa MPC, Rocha ACD, Figueroa Pedraza. Peril epidemiológico do estado nutricional de crianças assistidas em creches no Estado da Paraíba. Nutrire 2011; 36(1): 111-26.
27. Figueroa Pedraza D, Rocha ACD, Sousa CPC. Crescimento e deiciências de micronutrientes: peril das crianças assistidas no núcleo de creches do governo da Paraíba, Brasil. Ciênc Saúde Coletiva 2013; 18(11): 3379-90. 28. Motta MEFA, Silva GAP, Araújo OC, Lira PIC, Lima MC.
O peso ao nascer inluência o estado nutricional ao inal do primeiro ano de vida? J Pediatr 2005; 81(5): 377-82. 29. Han Z, Lutsiv O, Mulla S, Rosen A, Beyene R, Mcdonald
S. Low gestational weight gain and the risk of preterm birth and low birthweight: a systematic review and meta-analyses. Acta Obstet Gynecolog Scand 2011; 90: 935-54.
30. Figueroa Pedraza D. Evidências do impacto da suplementação múltipla com micronutrientes no crescimento de pré-escolares. Rev Bras Saude Matern Infant 2014; 14(1): 17-37.
31. Bismarck-Nasr EM, Frutuoso MFP, Gamabardella AMD. Efeitos tardios do baixo peso ao nascer. Rev Bras Crescimento Desenvolv Hum 2008; 18(1): 98-103. 32. Barros JWO, Almeida MB, Santos MAM, Santana PR, Campos FA, Leandro CG. Pode o peso ao nascer inluenciar o estado nutricional, os níveis de atividade física e a aptidão física relacionada à saúde de crianças e jovens? Rev Nutr 2011; 24(5): 777-84.
33. Silveira KBR, Alves JRF, Ferreira HS, Sawaya AL, Florencio TMMT. Association between malnutrition in children living in favelas, maternal nutritional status, and environmental factors. J Pediatr 2010; 86(3): 215-20. 34. Menezes RCE, Lira PIC, Leal VS, Oliveira JS, Santana SCS, Sequeira LAS et al. Determinantes do déicit estatural em menores de cinco anos no Estado de Pernambuco. Rev Saúde Pública 2011; 45(6): 1079-87. 35. Felisbino-Mendes MS, Villamor E, Velasquez-Melendez G. Association of Maternal and Child Nutritional Status in Brazil: A Population Based Cross-Sectional Study. PloS ONE 2014; 9(1): e87486.
36. Victora CG, Aquino EML, Leal MC, Monteiro CA, Barros FC, Szwarcwald CL. Saúde no Brasil 2. Saúde de mães e crianças no Brasil: progressos e desaios. Disponível em: http://portal.saude.gov.br/portal/ arquivos/pdf/revista_the_lancet.pdf. (Acesso em 23 de setembro de 2014).
37. Silva EP, Lima RT, Costa MJC, Batista Filho M. Desenvolvimento e aplicação de um novo índice para avaliação do pré-natal. Rev Panam Salud Publica 2013; 33(5): 356-62.
38. Paris GF, Pelloso SM, Martins PM. Qualidade da assistência pré-natal nos serviços públicos e privados. Rev Bras Ginecol Obstet 2013; 35(10): 447-52. 39. Silveira DS, Santos IS. Adequação do pré-natal e peso
ao nascer: uma revisão sistemática. Cad Saúde Pública 2004; 20(5): 1160-8.
40. Pedraza DF, Souza MM, Cristóvão FS, França ISX. Baixo peso ao nascer no Brasil: revisão sistemática de estudos baseados no sistema de informações sobre nascidos vivos. Pediatria Moderna 2014; 50(2): 51-64. 41. Figueroa Pedraza D, Rocha ACD, Cardoso MV. Assistência pré-natal e peso ao nascer: uma análise no contexto de unidades básicas de saúde da família. Rev Bras Ginecol Obstet 2013; 35(8): 349-56. 42. Cardoso-Demartini AA, Bagatin AC, Silva RP,
Boguszewski MCS. Crescimento de crianças nascidas prematuras. Arq Bras Endocrinol Metab 2011; 55(8): 534-40.
43. Figueroa Pedraza D, Rocha ACD, Sales MC. Deiciência de micronutrientes e crescimento linear: revisão sistemática de estudos observacionais. Ciênc Saúde Coletiva 2013; 18(11): 3333-47.
Received on: 10/21/2014