ABSTRACT:Objective: To identify desirable characteristics, including diferent sample sizes and dental caries prevalences, in virtual samples that allow, at the same time, higher values of general agreement percentage (GPA) and Kappa coeicient (κ), under a low conidence interval (CI), in reproducibility studies. Method: A total of 384 statistical simulations of inter-examiner calibration, varying sample size (12, 15, 20, 60, 200 and 500 individuals), caries prevalence (30, 50, 60 and 90%) and percentages of positive (PA) and negative (NA) agreement (30, 50, 60 and 90%) were undertaken. GPA and κ were used to measure reproducibility and deine deviation between them. Results: The sample of 60 individuals, under caries prevalence of 50%, PA and NA of 90%, presented a GPA and Kappa values of 90 and 80%, respectively, a relative small conidence interval (95%CI 0.65 – 0.95) and a GPA/Kappa deviation of 10.00. Conclusion: A virtual sample of 60 individuals, under caries prevalence of 50%, seems feasible to produce a satisfactory interexaminer agreement at epidemiological conditions. However, epidemiological studies to corroborate or refute this assertion are necessary.
Keywords: Sample size. Reproducibility of results. Dental health surveys. Dental caries. Calibration. Epidemiology.
Interexaminer agreement dental caries
epidemiological surveys: the importance
of disease prevalence in the sample
Concordância interexaminador em levantamentos epidemiológicos de
cárie dentária: a importância da prevalência da doença na amostra
Aline Sampieri TonelloI, Renato Pereira da SilvaII, Andréa Videira AssafIII, Gláucia Maria Bovi AmbrosanoIV, Silvia Helena de Carvalho Salles PeresV, Antonio Carlos PereiraIV, Marcelo de Castro MeneghimIV
ORIGINAL ARTICLE / ARTIGO ORIGINAL
IDepartment of Public Health, Universidade Federal do Maranhão – São Luís (MA), Brazil IIDepartment of Nutrition and Health, Universidade Federal de Viçosa – Viçosa (MG), Brazil IIINova Friburgo Dental School, Universidade Federal Fluminense – Nova Friburgo (RJ), Brazil
IVDepartment of Community Dentistry, Piracicaba Dental School, Universidade de Campinas – Piracicaba (SP), Brazil VDepartment of Pediatric Dentistry, Orthodontics and Public Health, Universidade de São Paulo – Bauru (SP), Brazil
Corresponding author: Renato Pereira da Silva. Universidade Federal de Viçosa. Departamento de Nutrição e Saúde, Avenida Peter Henry Rolfs, s/n, CEP: 36570-000, Viçosa, MG, Brazil. E-mail: [email protected]
INTRODUCTION
Oral health surveys are needed to plan and evaluate oral health actions and services. The control of the methodological biases in such surveys must be done. According the World Health Organization (WHO) methodology, previous training and calibration of the exam-iners are the initial and essential steps of oral health surveys. The calibration allows to stan-dardize the interpretation of diagnostic criteria among examiners. The general percentage agreement (GPA) and Kappa statistics have been proposed for this task1.
The GPA is the simplest way to evaluate the agreement among examiner. However, its weakness lies on the precision when a low caries prevalence sample is examined. For this rea-son, Kappa has been the statistical method choice for measuring the reproducibility in oral health surveys2. The Kappa coeicient eliminates agreement due to chance, thus constitut-ing a measurement of real agreement for nominal or ordinal data3. Values of 85% or above for the GPA and of at least 0.80 for Kappa are accepted for epidemiological surveys of dental caries. Such values indicate a precise use for the diagnostic methods among the examiners1.
The WHO recommends a minimal sample size of 20 individuals or above (since they have the whole spectrum of the dental caries disease) for the calibration exercises. No more details about the sample are given1. Besides the age group and environmental conditions during the examinations, the prevalence and annual increment of the disease deserves special attention during the planning and execution of epidemiological studies, especially at the training and calibration stages1-5. These factors, if neglected, may compromise the reproducibility and valid-ity of the diagnostic methods used, especially when the reproducibilvalid-ity values are very low. Spurious results of reproducibility as a high general percentage agreement (GPA) associated with a very low (even negative) Kappa values may be observed in the scientiic literature6. RESUMO:Objetivo: Identiicar características desejáveis, considerando diferentes tamanhos de amostra e prevalências de cárie em amostras virtuais que possibilitem, simultaneamente, altos valores de porcentagem geral de concordância (PGC) e do coeiciente Kappa (κ), sob baixo intervalo de coniança (IC), em estudos de reprodutibilidade. Método: Ao total,384 simulações estatísticas de calibração interexaminador, variando o tamanho da amostra (12, 15, 20, 60, 200 e 500 indivíduos), a prevalência de cárie (30, 50, 60 e 90%) e as taxas de concordâncias positiva (CP) e negativa (CN) (30, 50, 60 e 90%) foram realizadas. Os valores de PGC e κ foram utilizados para mensurar a reprodutibilidade e o desvio entre as respectivas medidas PGC/Kappa. Resultados:A amostra de 60 indivíduos, com prevalência de cárie de 50% e taxas de concordância positiva e negativa de 90%, apresentou um valor de PGC = 90%, Kappa = 80%, um intervalo de coniança (IC95% 0,65 – 0,95) relativamente pequeno e um desvio PGC/Kappa de 10,00. Conclusão: A amostra virtual de 60 indivíduos parece ser viável, em condições epidemiológicas, para produzir uma concordância interexaminadores satisfatória. Contudo, estudos epidemiológicos para corroborar ou refutar esta conclusão são necessários.
For this reason, the aim of this study was to identify desirable characteristics, including diferent sample sizes and dental caries prevalences, in virtual samples that allow, at the same time, higher val-ues of GPA and Kappa coeicient, under a low conidence interval (CI), in reproducibility studies.
METHODOLOGY
Statistical computer simulations of interexaminer calibration, varying caries prevalence (30, 50, 60 and 90) in hypothetical samples of diferent sizes (12, 15, 20, 60, 200 and 500 indi-viduals), in addition to varying the percentages of positive (30, 50, 60 and 90%) and neg-ative (30, 50, 60 and 90%) agreements in these samples were obtained. Therefore, a total of 384 simulations, between a gold standard examiner and an examiner, both virtual, were performed using ‘The SAS System 9.0 for Windows’ (SAS Institute Inc., Cary, NC, USA).
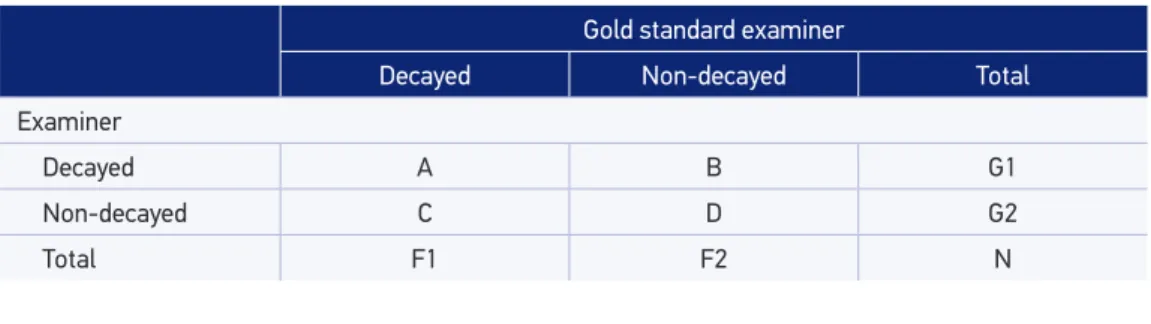
A contingency table (square matrix: nXn) is necessary for Kappa calculation. For study pur-poses, a contingency table 2X2, with clinical conditions dichotomized in “decayed” (cavitation or marginal leakage around dental restorations) and “non-decayed”, was considered (Table 1). This dichotomy makes some sense in Dentistry when more sensible diagnostic methods are used.
The positive agreement refers to the percentage of the cases in cell “A” of a contingency table 2X2, considering the calibration between a gold standard examiner and the examiner. The cells “B” and “C” expresses the disagreement, while the cell “D” express the negative agreement between such examiners (Table 1).
The Kappa statistics is obtained by the formula:
κ = (Po – Pe)/(1 – Pe).
Where:
Po = proportion of agreements observed = (A+D)/N; Pe = proportion of agreements expected = (F1G1+F2G2)/N2.
Prevalence (|A–D|/N) and bias (|B–C|/N) rates inluence Kappa values5,6.
Although many positive and negative agreement values/rates were obtained during the simulations, rates of 90% were stipulated as the ideal condition to obtain both high GPA
Gold standard examiner
Decayed Non-decayed Total
Examiner
Decayed A B G1
Non-decayed C D G2
Total F1 F2 N
and Kappa values for such agreements. The deviation between the GPA and Kappa values (module) is given by the formula: |GPA – κ|.
RESULTS
The smallest deviations between the GPA and Kappa (κ) values, for calculation of the inter-examiner reproducibility, as a function of prevalence of the disease in the sample, sample size, considering the positive (PA) and negative (NA) agreements of 90% are expressed in Table 2.
The best GPA/Kappa ratio (highest GPA and Kappa values, deviation ≤ 10, low 95%CI and sample size) was found for the sample of 60 individuals under a caries prevalence of 50% (Table 2).
The greatest deviations between the GPA and Kappa values are listed below in Table 3.
Table 2. Smallest deviations between general agreement percentage and Kappa (κ), according to disease prevalence.
PA: Positive agreement; NA: Negative agreement; GAP: general agreement percentage.
Prevalence (%)
Sample
(n) PA* NA**
Contingency table GPA (%)
κ
(%) 95%CI
Deviation |module|
A B C D
30 15 90 90 4 0 1 9 92.86 83.72 0.53 – 1.00 |9.14|
30 12 90 90 3 0 1 8 91.67 80.00 0.43 – 1.00 |11.67|
30 200 90 90 54 6 14 126 90.00 77.06 0.68 – 0.87 |12.94|
30 500 90 90 135 15 35 315 90.00 77.06 0.71 – 083 |12.94|
30 60 90 90 16 2 4 38 90.00 76.92 0.60 – 0.94 |13.08|
30 20 90 90 5 1 1 13 90.00 76.19 0.45 – 1.00 |13.81|
50 20 90 90 9 1 1 9 90.00 80.00 0.54 – 1.00 |10.00|
50 60 90 90 27 3 3 27 90.00 80.00 0.65 – 0.95 |10.00|
50 200 90 90 90 10 10 90 90.00 80.00 0.72 – 0.88 |10.00|
50 500 90 90 225 25 25 225 90.00 80.00 0.75 – 0.85 |10.00|
50 15 90 90 7 1 1 7 87.50 75.00 0.43 – 1.00 |12.50|
50 12 90 90 5 1 1 5 83.34 66.67 0.24 – 1.00 |16.67|
60 12 90 90 6 1 0 4 90.91 81.36 0.47 – 1.00 |9.55|
60 60 90 90 32 4 2 22 90.00 79.45 0.64 – 0.95 |10.55|
60 200 90 90 108 12 8 72 90.00 79.34 0.71 – 0.88 |10.66|
60 500 90 90 270 30 20 180 90.00 79.34 0.74 – 0.85 |10.66|
60 20 90 90 11 1 1 7 90.00 79.17 0.52 – 1.00 |10.83|
PA: Positive agreement; NA: Negative agreement; GAP: general agreement percentage.
Table 3. Greatest deviations between general agreement percentage and Kappa (κ), acoording to general agreement percentage values.
Prevalence (%)
Sample
(n) PA* NA**
Contingency table GPA (%)
κ
(%) 95%CI
Deviation |module|
A B C D
90 15 90 30 12 1 1 0 85.71 -7.69 -0.18 – 0.03 |93.40|
90 12 90 30 10 1 1 0 83.33 -9.09 -0.22 – 0.03 |92.42|
90 15 60 30 8 5 1 0 57.14 -13.51 -0.37 – 0.10 |70.65|
90 200 60 30 108 72 14 6 57.00 -4.37 -0.01 – 0.05 |61.37|
90 500 60 30 270 180 35 15 57.00 -4.37 -0.10 – 0.02 |61.37|
90 60 60 30 32 22 4 2 56.66 -3.17 -0.20 – 0.14 |59.83|
90 12 60 30 6 4 1 0 54.55 -17.02 -0.46 – 0.12 |71.57|
30 200 30 60 18 42 56 84 51.00 -9.38 -0.23 – 0.04 |60.38|
30 500 30 60 45 105 140 210 51.00 -9.38 -0.18 – -0.01 |60.38|
30 15 30 60 1 3 4 6 50.00 -13.95 -0.63 – 0.35 |63.95|
30 12 30 60 1 3 3 5 50.00 -12.50 -0.66 – 0.41 |62.50|
30 60 30 60 5 13 17 25 50.00 -11.94 -0.36 – 0.12 |61.94|
30 20 30 60 2 4 6 8 50.00 -8.70 -0.51 – 0.33 |58.70|
60 60 60 30 22 14 17 7 48.34 -9.93 -0.35 – 0.15 |58.27|
90 60 50 30 27 27 4 2 48.33 -6.16 -0.22 – 0.09 |54.49|
60 200 60 30 72 48 56 24 48.00 -10.17 -0.24 – 0.03 |58.17|
60 500 60 30 180 120 140 60 48.00 -10.17 -0.24 – 0.03 |58.17|
90 200 50 30 90 90 14 6 48.00 -7.44 -0.16 – 0.01 |55.44|
90 500 50 30 225 225 35 15 48.00 -7.44 -0.13 – -0.02 |55.44|
90 15 50 30 7 7 1 0 46.67 -13.21 -0.38 – 0.11 |59.88|
60 15 60 30 5 4 4 2 46.66 -11.11 -0.61 – 0.39 |57.77|
50 15 30 60 2 5 3 5 46.66 -9.09 -0.57 – 0.39 |55.75|
50 15 60 30 5 3 5 2 46.66 -9.09 -0.57 – 0.39 |55.75|
60 12 60 30 4 3 3 1 45.45 -17.86 -0.74 – 0.38 |63.31|
90 12 50 30 5 5 1 1 45.45 -17.86 -0.50 – 0.14 |63.31|
DISCUSSION
Kappa (κ) statistics is an index that measures the reproducibility of examiners concern-ing categorical data, beconcern-ing widely used in biomedical sciences. Kappa values vary from -1 (total interexaminer disagreement), passing through 0 (agreement merely by chance), up to +1 (total interexaminer agreement). Assuming the value of -1, Po is lower than Pe. A Kappa value of 0, denotes an agreement merely by chance, where Po = Pe. For the Kappa value equal to +1, Po is higher than Pe3,7.
Because it expresses agreement among examiners beyond the chance, the Kappa val-ues are slightly lower than the GPA valval-ues. Nevertheless high GPA valval-ues associated with very low values (or even negative) Kappa values may be found in reproducibility studies. This fact deserves special attention by the scientiic community. A negative Kappa value is not always a relection of mathematical, typographic or computational errors or misuse of a diagnostic test. This may relect its dependency of the trait of disease prevalence in the examined sample6,8.
The situation described above can be avoided when the sample for reproducibility studies is well designed. However, even when there is some methodological care, signiicant difer-ences between the GPA and Kappa values may be found. This fact can be worsened by not selecting individuals prior to the calibration phase. A clear example of this occurs in rela-tion to the stage of intraexaminer recalibrarela-tion during the ield phase, by selecting 5–10% of individuals in the sample, as recommended by the WHO manual of examiners1. Even in this case, there is no recommendation of previous selection and distribution of individu-als according to their respective disease prevalence in order to obtain a controlled sample. Therefore, this may also generate a low caries prevalence in this group and thus compro-mise the results of reproducibility.
Whenever possible, larger sample sizes with disease prevalence near 50% are always desirable8,9. Larger sample sizes provide slower conidence intervals and may allow to the examiner a full view of the disease spectrum, compensating the efects of unreliability.
In the present study, the paradox of “high GPA and low Kappa”6 was evident for the samples of 12 and 15 individuals under a dental caries prevalence of 90%. Nevertheless, in all the situations in which the deviation between the GPA and Kappa values was high, the ratio between the value of Po and that of Pe was determinant. Very close values of Po and Pe are responsible for this paradox. Whereas, the higher the value of Po associated with a lower value of Pe, the smaller the GPA/Kappa deviation. This condition is attained when the values of cells A and D are higher than the values of cells B and C, favoring the achieve-ment of a positive and negative agreeachieve-ments above 90%6,10.
both of the reproducibility measurements. In these samples, the GPA value was higher than 85%, while the Kappa value was “almost perfect”, value and classiication recommended by WHO1. However, the 95%CI was high for both situations.
An ideal sample (without dubious cases) is statistically desirable, but unfeasible in real settings. Therefore, an experienced epidemiologist (non-participant of the survey) is necessary to select individuals to compose samples and to conduct the calibration sessions in epidemiological surveys. The true prevalence of the attribute in an ideal sample is obtained by an equanimous distribution of “diseased” (cell A) and “non-diseased” (cell D) individuals6. The control of the cells A and D is directly related to the value of Po. A Po higher than Pe, determines high GPA and Kappa values and a smaller deviation between them. A very low or very high value propensity of positive classiication (P+=(F1+G1)/2) also contributes to a low Kappa value8.
The estimate of sample size and statistical power of the diagnostic methods are gen-erally neglected in epidemiological studies7. Usually, reproducibility studies are performed with samples of 50 or less subjects11, which may compromise, to some degree, the statisti-cal power of the method used. This problem is more serious when the outcome variable is dichotomous, being aggravated by a low prevalence of the attribute in the studied pop-ulation/sample5,8,12. In Dentistry the sample sizes for reproducibility studies has ranged between 10 and 25 individuals. No details about this number having been provided. Another peculiarity in Dentistry is that the caries outcomes are categorical, non-dichotomous, with various clinical conditions coexisting in a single individual1. This is a natural and additional source of variations among examiners.
Satisfactory GPA and Kappa values were obtained with relative small samples (12 and 15 individuals). However, a sample of 12 individuals, for example, represents 336 teeth/1,680 dental surfaces examined. The GPA/Kappa deviation for such samples may relect the dis-tribution of the A and D cells, because the respective conidence intervals were not consid-ered. Considering the lower conidence interval and sample size, the best reproducibility and GPA and Kappa ratio were found for the sample of 200 individuals (5,600 teeth/28,000 dental surfaces) under caries prevalence of 50%, positive and negative agreements of 90%. The results about reproducibility from the sample of 60 individuals (1,680 teeth/8,400 den-tal surfaces), under same methodological conditions, is similar to the results of the sample of 200 individuals. The advantage of the sample of 60 individuals in relation to the 200 indi-viduals is its feasibility, fewer indiindi-viduals are needed.
The present results were obtained by statistical simulations in virtual samples (designed for such purpose) with dichotomous clinical outcomes. Therefore, such results may not exactly represent data from a real setting of epidemiological surveys. Although this issue has been studied by many authors, the study calls readers attention about how such prob-lems can afect the reproducibility in epidemiological dental caries surveys. Anyway, such results contributed to clarify some issues that have been raised around the Kappa Statistics expressed in the literature.
CONCLUSION
A sample of 60 individuals, whose caries prevalence was 50%, produced low deviation between GPA and Kappa, under a relatively small conidence interval. Such sample is virtually applicable at epidemiological conditions to produce good results of reproducibility. Therefore, epidemiological studies that corroborate/refute this assertion are necessary to verify its feasi-bility under ield conditions. Previous and careful selection of individuals to compose samples in reproducibility studies should be implemented by community health researchers.
1. World Health Organization (WHO). Oral health surveys: basic methods. 4th ed. Geneva: WHO; 1997.
2. Peres MA, Traebert J, Marcenes W. Calibration of examiners for dental caries epidemiology studies. Cad Saúde Pública 2001; 17(1): 153-9.
3. Cohen J. A coeicient of agreement for nominal scales. Educ Psychol Measur 1960; 20(1): 37-46.
4. Frias AC, Antunes JLF, Narvai PC. Reliability and validity of oral health surveys: dental caries in the city of Sao Paulo, 2002. Rev Bras Epidemiol 2004; 7(2): 144-54. 5. Sim J, Wright CC. The kappa statistic in reliability
studies: use, inter pretation, and sample size requirements. Phys Ther 2005; 85(3): 257-68. 6. Feinstein AR, Cicchetti DV. High agreement but low
Kappa: I. The problems of two paradoxes. J Clin Epidemiol 1990; 43(6): 543-9.
7. Rigby AS. Statistical methods in epidemiology. Towards an understanding of the kappa coeicient. Disabil Rehabil 2000; 22(8): 339-44.
8. Gwet K. Inter-rater reliability: dependency on trait prevalence and marginal homogeneity. Statistical
Methods For Inter-Rater Reliability Assessment 2002; 2: 1-9.
9. Hoehler FK. Bias and prevalence efects on kappa viewed in terms of sensitivity and speciicity. J Clin Epidemiol 2000; 53(5): 499-503.
10. Cicchetti DV, Feinstein AR. High agreement but low Kappa: II. Resolving the paradoxes. J Clin Epidemiol 1990; 43(6): 551-8.
11. Donner A. Sample size requirements for the comparison of two or more coeicients of inter-observer agreement. Stat Med 1998; 17(10): 1157-68.
12. Viera AJ, Garret JM. Understanding interobserver agreement: the Kappa statistic. Fam Med 2005; 37(5): 360-3. 13. Assaf AV, Zanin L, Meneghim MC, Pereira AC,
Ambrosano GMB. Comparison of reproducibility measurements for calibration of dental caries epidemiological surveys. Cad Saúde Pública 2006; 22(9): 1901-7.