Undernutrition among Honduran children
12–71 months old
Penelope Nestel,
1Alejandro Melara,
2Jorge Rosado,
3and Jose O. Mora
4In 1996, the Ministry of Health of Honduras conducted a national micronutrient survey that included anthropometric measurements to determine the nutrition status of children 12–71 months old. Among the 1 744 children who participated, 38% of them were stunted, includ-ing 14% who were severely stunted; 24% were underweight, of which 4% were severely un-derweight; and 1% were wasted, of which 0.1% were severely wasted. The country can be di-vided into three groupings based on the level of stunting and underweight: 1) lowest prevalence: Tegucigalpa, San Pedro Sula, and medium cities; 2) medium prevalence: other urban areas, the rural north, and the rural south; and 3) highest prevalence: the rural west. Using logistic regression analysis, the important determinants of stunting were found to be: mother/caretaker’s and father’s schooling, source of water, the dominion (geographic location and strata) in which the child lived, and the “possession score” for ownership of such items as a radio, television, refrigerator, stereo system, and electric iron. The predictors for under-weight were micronutrient status, diarrhea, maternal/caretaker’s schooling, type of toilet, and possession score. Historical data indicate that the national prevalence of chronic undernutri-tion has changed little over the last 10 years despite the number of naundernutri-tional food and nutriundernutri-tion plans implemented and the significant improvements in health services. It is possible that these positive interventions have been offset by the slow progress in economic development. Future nutrition interventions should take into account household-level perceived needs and priorities in order to set realistic nutrition targets.
ABSTRACT
Since the 1970s, the levels of under-nutrition in many countries of Latin America and the Caribbean have de-clined. In those two areas, available per capita daily energy intake in-creased from about 2 300 kcal in 1960
to 2 700 kcal in 1990. Underweight de-clined from 17% in 1975 to 12% in 1989, after which is has remained con-stant (1). Much of the improvement in nutrition status took place in the 1970s, but the improvement was not uniform across the countries. The limited im-provement in nutrition status during the 1980s could have been due to the economic crisis that affected Latin America and the Caribbean.
Using national-level data, Mora and Dary (1) compared the prevalence of undernutrition in 20 countries in Latin America and the Caribbean. Their find-ings showed that Honduras had the
second-highest prevalence of chronic undernutrition or stunting, after Haiti, and the fourth-highest prevalence of underweight, after Guatemala, Haiti, and Guyana.
In Honduras undernutrition in chil-dren has long been documented to be a problem of public health importance. The first national nutrition survey, car-ried out in 1966, found children were both lighter and shorter than the refer-ence standards then widely used, the so-called Iowa reference curves (2). The high prevalence of physical growth re-tardation was still prevalent at the time of the second national nutrition survey,
1 International Life Sciences Institute, Washington,
D.C., United States of America.
2 Ministry of Health, Tegucigalpa, Honduras. 3 National Institute of Nutrition, Mexico City,
Mexico.
4 International Science and Technology Institute
in 1987. The survey showed that of chil-dren 12–59 months old, 44% were stunted, 24% were underweight, and 2% were wasted (3). In the 1991 na-tional survey, similar values were found for that same age group: 43% were stunted, 21% were underweight, and 2% were wasted (4).
Using data from the 1996 national micronutrient survey, this paper ex-amines the association between nutri-tion status of preschool children and several nonbiological factors (geo-graphic, social, and economic ones) and several biological factors (health and age-specific ones). The paper also identifies some risk factors that predis-pose children to being undernour-ished and that could be considered for improved targeting of nutrition and health care interventions.
METHODS
In this survey we used the 1988 Mas-ter Sampling Frame (MSF) developed by the General Office of Statistics and Censuses, which was updated in Tegu-cigalpa and the city of San Pedro Sula in 1991–1992 to include the new periur-ban areas. The MSF was divided into six strata or “dominions.” Three of them were urban: 1) the capital city of Tegucigalpa, 2) the city of San Pedro Sula (SPS) and medium-sized cities (ones with a population between 20 000 and 50 000, e.g., La Ceiba, Comayagua, Choloma, Puerto Cortés, La Lima, Danlí, Choluteca, and El Progreso), and 3) other urban areas—cities with a pop-ulation of between 2 000 and 20 000 people and in which there was piped water; access by road, rail, or regular boat; a primary school; mail or tele-phone service; and electricity, a sewage system, or a health center. The other three dominions were rural areas, with villages and towns containing fewer than 2 000 people. The three rural do-minions—north, south, and west— matched the political boundaries of de-partments but excluded all urban communities in their respective areas. The rural south included the depart-ments of Choluteca and Valle; the rural west, the departments of Ocotepeque,
La Paz, Lempira, and Intibucá; and the rural north, the departments of Yoro, Olancho, Santa Bárbara, Copán, Atlán-tida, El Paraíso, Francisco Morazán, Colón, and Cortés. The survey covered the whole country except the depart-ments of Islas de la Bahía and Gracias a Dios, which are isolated and have a very low population density.
Among the nutrition indices of in-terest, vitamin A deficiency (VAD) was likely to be the rarest event; thus, this was the criterion used to deter-mine the sample size. The prevalence of low plasma retinol was expected to be between 18% and 20%, for which 308 children per dominion would be required to provide prevalence data with a 95% confidence interval and a sampling error of 5%. This number would take into account a 20% attri-tion rate for whatever reason. A two-stage sampling procedure was used, in which clusters were first selected and then houses within those clusters were chosen. For logistical reasons, 22 clus-ters were selected in each domain, using systematic selection from a ran-dom start with probability propor-tional to the number of households, based on the 1988 census data. Within each cluster, 22 households were ran-domly selected in Tegucigalpa, 19 in San Pedro Sula and medium-sized cities, 16 in other urban areas, 17 in the rural south, 14 in the rural west, and 18 in the rural north.
A household was defined as a person living alone or a group of people living together and sharing a common pot of food. An eligible household was one in which there was at least one child be-tween the age of 12 and 71 months. Re-spondents were women who took care of the child daily, and included both mothers and caretakers. Data were col-lected by three field teams. Each team consisted of five members: a supervi-sor, two phlebotomists, and two viewers. Within each team, an inter-viewer and phlebotomist worked as a pair. All the field staff had 2 weeks of training, which included standardiza-tion of anthropometric measurements. The questionnaire was pretested twice in an urban area and twice in a rural area before finalization. Field work was
conducted between July and October 1996.
Data collected included standard household social and economic vari-ables; morbidity (cough, runny nose, or diarrhea with ≥ 3 or more watery stools/day) in the preceding 15 days (2 weeks), including the day of the sur-vey; and pharmaceutical supplement use among children 12–71 months old. Child age was obtained from birth cer-tificates or baptism records. Children were weighed to the nearest 100 g, using a Salter hanging scale (United Nations Children’s Fund, Copen-hagen, Denmark), which was cali-brated daily. Height was measured to the nearest 0.1 cm, using a wooden anthropometer. Nutrition indicators were calculated using the U.S. Centers for Disease Control Anthropometric Software Package (Atlanta, Georgia, United States of America), which is based on the growth curves of the Na-tional Center for Health Statistics. Children with zscores below –2 were considered undernourished, in line with standards of the World Health Organization (WHO) (5). The exclu-sion criteria for anthropometric values that are recommended by the WHO (6) were used, i.e., 4 z-score units from the observed mean zscore for height/age, weight/age, and weight/height, with a maximum height/age zscore of +3.
samples were packed in dry ice and sent by air.
Plasma retinol was determined spectrophotometrically following the method of Dary and Arroyave (7). Subclinical VAD was defined using the cut-off level of the WHO (8), of < 20 µg/dL. The spectrophotometric method is not sufficiently specific for values below 20 µg/dL (Dary, per-sonal communication), so separating the prevalence of severe deficiency from moderate and mild VAD was not possible. Children were defined at being at risk of VAD if their plasma retinol was between 20 and 30 µg/dL. Children with a plasma retinol level of 30 µg/dL or higher were considered to have normal vitamin A status.
The concentration of AAGP, which peaks after 48 hours and remains high for about 120 hours before beginning to fall (9), was used as the marker of infection. It was determined using the Behring TurbiTime System (Behring, Marburg, Germany), an immunotur-bidimetric assay in which human AAGP forms a precipitin with a spe-cific antiserum. No guidelines cur-rently exist for defining the presence of infection; based on data in the liter-ature (10), a “high” AAGP level was defined as greater than 1.0 g/L.
Hemoglobin (Hb) measurements were made on a drop of venous blood using a portable photometer (Hemo-Cue, Ängelholm, Sweden). Anemia was defined as having an Hb level below 11 g/dL at sea level (11). Hb levels were adjusted for altitude using the formula proposed by Yip5:
ad-justed Hb = Hb – (–0.032 3 altitude + 0.022 3 altitude2), where altitude = elevation in 1 000-foot units or in units of 1 000 m 3 3.3.
Data were entered in Epi Info ver-sion 6 (U.S. Centers for Disease Con-trol and Prevention, Atlanta, Georgia, United States) and exported to SPSS PC files. Analysis was done using SPSS for Windows version 5 (SPSS Inc,
Chi-cago, Illinois, United States). A proba-bility level of less than 0.05 was used to define statistical significance. In the bivariate analyses, the sample was weighted by the normalized sample weights, which was the product of the inverse of the sample weight, the household response rate, and the indi-vidual interview response rate. Sample sizes are presented as weighted obser-vations. Logistic regression models were developed to predict stunting and underweight. In each model, the category in the bivariate analysis most positively associated with not being undernourished was generally used as the reference category. For ease of un-derstanding, the ratios of the odds in the logistic regressions have been transformed into the ratios of probabil-ities or relative risks.
A technical committee set up by the Ministry of Health of Honduras re-viewed all documents and survey pro-cedures. Written informed consent was obtained from all mothers/caretakers. Ethical approval for the survey was ob-tained from the Human Subjects Com-mittee of Johns Hopkins University.
RESULTS
A total of 2 413 households were vis-ited. The response rate was 96.7%, and 52.2% of households were eligible, that is, had children 12–71 months old. Of the eligible households, 94.5% were successfully interviewed. Eighty-six percent of the children’s data were ob-tained from their mothers, 11% from caretakers who had their own children, and 4% from caretakers who did not have any children. Anthropometric, Hb, plasma retinol, and AAGP data were available for 98.3%, 93.8%, 88.7%, and 91.3% of children, respectively.
Demographic and socioeconomic status
Overall, the mean and standard deviation of household size was 6.5 52.6 people. Households were larger
(P< 0.02) in the rural south (mean = 7.0) and rural west (mean = 7.0) than
else-where (mean, 6.1–6.6). The mean and standard deviation number of eligible women per household was 1.1 6 0.3, and there was no difference between dominions. The mean and standard de-viation number of eligible children per household was 1.5 6 0.8 and, again, there was no difference between the do-minions. The mean and standard devi-ation age of mothers/caretakers with children 12–71 months old was 31.1 6 10.9 years, and the mean and standard deviation age of the partner of moth-ers/caretakers was 36.1 6 10.7 years. Neither mother/caretaker’s age nor her partner’s age varied by dominion.
There was no difference between dominions in the gender of the chil-dren (51.3% boys, 48.7% girls) or in their mean age (40.2 6 17.2 months), indicating that the sample was not bi-ased by these parameters.
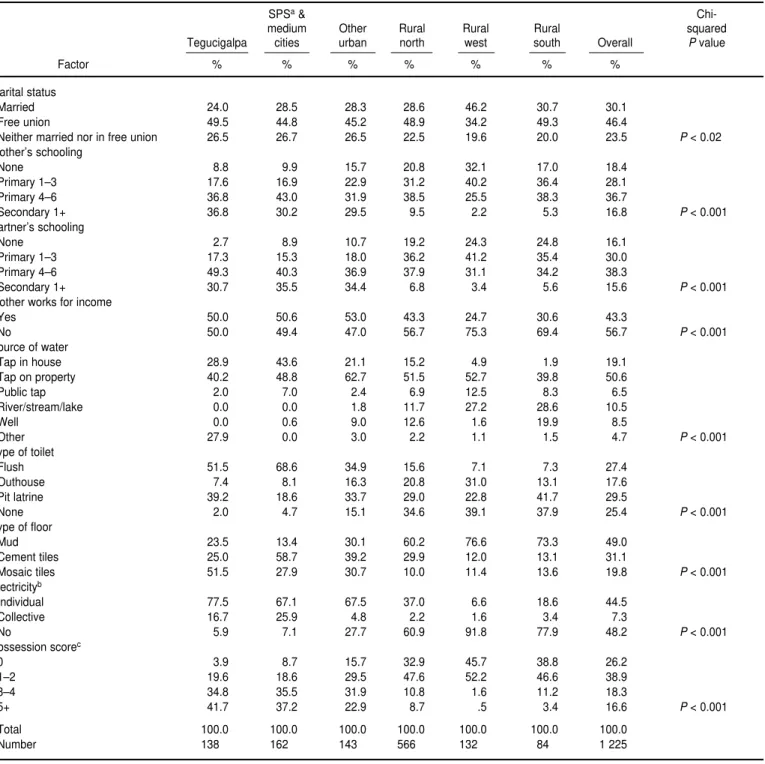
Thirty percent of mothers/caretak-ers were married, 46% were in a free union, and 24% were neither in a free union nor married (Table 1). Com-pared with the other dominions, more mothers/caretakers in the rural west were married, and more mothers/ caretakers in the urban areas were not in a free union or married.
Overall, 18% of mothers/caretakers had never been to school, 65% had at-tended at least some primary school, and the remaining 17% had attended secondary school (Table 1). The lowest level of school attendance was in the rural west, where 32% of mothers/ caretakers had not been to school. Even in the urban areas, only about one out of three mothers/caretakers had attended at least grade 1 of sec-ondary school. The overall pattern for the schooling of the partners of moth-ers/caretakers was similar to that for the mothers/caretakers. However, in the rural south more partners than mothers/caretakers had not been to school than in the other dominions.
Besides their household responsi-bilities, 43% of mothers/caretakers worked for an income, a pattern that was more evident in the urban areas than in the rural ones (Table 1). Ninety-eight percent of the partners of mothers/caretakers worked, with no difference between dominions. Most
5 Yip R. Altitude and hemoglobin elevations:
TABLE 1. Percent distribution of demographic and social and economic factors by dominion, national micronutrient survey, Honduras, 1996
SPSa&
Chi-medium Other Rural Rural Rural squared
Tegucigalpa cities urban north west south Overall Pvalue
Factor % % % % % % %
Marital status
Married 24.0 28.5 28.3 28.6 46.2 30.7 30.1
Free union 49.5 44.8 45.2 48.9 34.2 49.3 46.4
Neither married nor in free union 26.5 26.7 26.5 22.5 19.6 20.0 23.5 P< 0.02
Mother’s schooling
None 8.8 9.9 15.7 20.8 32.1 17.0 18.4
Primary 1–3 17.6 16.9 22.9 31.2 40.2 36.4 28.1
Primary 4–6 36.8 43.0 31.9 38.5 25.5 38.3 36.7
Secondary 1+ 36.8 30.2 29.5 9.5 2.2 5.3 16.8 P< 0.001
Partner’s schooling
None 2.7 8.9 10.7 19.2 24.3 24.8 16.1
Primary 1–3 17.3 15.3 18.0 36.2 41.2 35.4 30.0
Primary 4–6 49.3 40.3 36.9 37.9 31.1 34.2 38.3
Secondary 1+ 30.7 35.5 34.4 6.8 3.4 5.6 15.6 P< 0.001
Mother works for income
Yes 50.0 50.6 53.0 43.3 24.7 30.6 43.3
No 50.0 49.4 47.0 56.7 75.3 69.4 56.7 P< 0.001
Source of water
Tap in house 28.9 43.6 21.1 15.2 4.9 1.9 19.1
Tap on property 40.2 48.8 62.7 51.5 52.7 39.8 50.6
Public tap 2.0 7.0 2.4 6.9 12.5 8.3 6.5
River/stream/lake 0.0 0.0 1.8 11.7 27.2 28.6 10.5
Well 0.0 0.6 9.0 12.6 1.6 19.9 8.5
Other 27.9 0.0 3.0 2.2 1.1 1.5 4.7 P< 0.001
Type of toilet
Flush 51.5 68.6 34.9 15.6 7.1 7.3 27.4
Outhouse 7.4 8.1 16.3 20.8 31.0 13.1 17.6
Pit latrine 39.2 18.6 33.7 29.0 22.8 41.7 29.5
None 2.0 4.7 15.1 34.6 39.1 37.9 25.4 P< 0.001
Type of floor
Mud 23.5 13.4 30.1 60.2 76.6 73.3 49.0
Cement tiles 25.0 58.7 39.2 29.9 12.0 13.1 31.1
Mosaic tiles 51.5 27.9 30.7 10.0 11.4 13.6 19.8 P< 0.001
Electricityb
Individual 77.5 67.1 67.5 37.0 6.6 18.6 44.5
Collective 16.7 25.9 4.8 2.2 1.6 3.4 7.3
No 5.9 7.1 27.7 60.9 91.8 77.9 48.2 P< 0.001
Possession scorec
0 3.9 8.7 15.7 32.9 45.7 38.8 26.2
1–2 19.6 18.6 29.5 47.6 52.2 46.6 38.9
3–4 34.8 35.5 31.9 10.8 1.6 11.2 18.3
5+ 41.7 37.2 22.9 8.7 .5 3.4 16.6 P< 0.001
Total 100.0 100.0 100.0 100.0 100.0 100.0 100.0
Number 138.0 162.0 143.0 566.0 132.0 84.0 1 225
aSPS = San Pedro Sula.
b“Individual” electrical power supplies a single household; “collective” electrical power serves several households sharing and paying for a single electrical line. cA score of 1 point each was applied to ownership of a radio, TV, refrigerator, stereo system, electric iron, blender, and telephone.
of the partners worked in agriculture (48%) or as independent skilled labor-ers (24%).
Overall, 76% of households ob-tained water from some kind of a tap (Table 1). That included 19% with tap
water in the house, 51% with a tap on their property, and the remainder with a tap in the street. More households in SPS and medium cities had tap water in the house than elsewhere. In con-trast, more than 25% of households in
Seventy-five percent of households had an adequate sanitary system to dispose of excreta, of which 27% had a flush toilet and 47% had a pit latrine or outhouse (Table 1). Outhouses were more common in the rural west, the rural south, and rural north. As ex-pected, more households in the larger metropolitan areas had a flush toilet; this was especially true in SPS and medium cities.
Close to one-half of all households had a mud floor (Table 1); that was much more common in the rural areas. Most households in Tegucigalpa had mosaic tiled floors, while those in SPS and medium cities tended to have ce-ment tile floors. Overall, 48% of house-holds did not have electricity. This was more often the case in the rural areas, where 92% of households in the rural west, 78% in the rural south, and 61% in the rural north did not have electricity (Table 1).
Households were asked whether they owned a variety of possessions. Of the households, 67% owned a radio, 41% a television, 23% a refrigerator, 15% a stereo system, 36% an electric iron, 19% a blender, and 5% a tele-phone. A score of one was applied to each item owned and the sum was called the “possession score.” Because all these items except a radio typically operate from a local community electri-cal system, the ability of this possession variable to capture differences in house-hold economic status was limited. Nev-ertheless, Table 1 shows that 26% of households did not own any of those items, 39% owned one or two, 18% owned three or four, and 17% owned five or more of them. Over one-half of households in the urban areas owned three or more of the items. Households in the rural west were the least likely to own the items listed. Given that few households in the rural areas had elec-tricity, this finding was expected.
Child morbidity
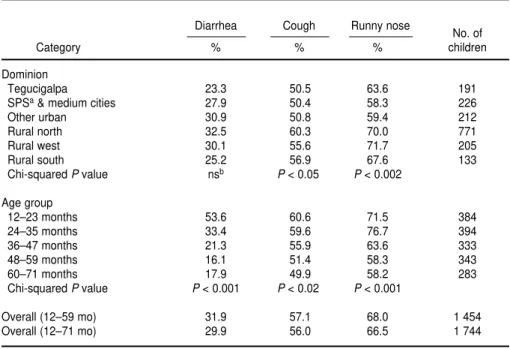
Overall, among children 12–71 months old, 30% reportedly had had diarrhea in the 2 weeks preceding the survey (Table 2). Among children 12–59 months old, 32% reportedly had
had diarrhea in that period. Table 2 also shows 56% of children 12–71 months old reportedly had had a cough and 66% a runny nose in the pre-ceding 2 weeks. In addition, 24% of children had a recent history of infec-tion, based on an elevated AAGP level. Having a runny nose and cough but not diarrhea varied by dominion, with the prevalence being higher in the rural dominions than in the urban ones.
There were no gender differences in the prevalence of any of the three mor-bidities. There were, however, signifi-cant age-related patterns for all three morbidities (Table 2). For example, among children 12–23 months old, the prevalence of diarrhea was over 50%. However, this prevalence steadily de-clined until the age range of 48–59 months, after which it leveled off at under 20%. Similar but smaller de-clines in the prevalence of cough and runny nose were also found for older children (Table 2).
Nutrition status of children
Of Honduran children 12–71 months old, 38.5% were stunted, 24.5% were
underweight, and 1.5% were wasted (Table 3). The prevalence of stunting and underweight were about 17 and 11 times, respectively, the levels expected in a well-nourished healthy population, according to the WHO growth stan-dards. In contrast, the level of wasting was within the expected range.
The data also show that 13.6% of the children were severely stunted and 4.0% of the children were severely un-derweight. The prevalence of severe wasting was 0.1% (Table 3). These data indicate levels of severe underweight and severe stunting were very high, respectively 40 and 136 times the lev-els expected in a well-nourished healthy population. The prevalence of severe stunting peaked in the age range of 36–47 months. On the other hand, the prevalence of severe under-weight was already high by the age of 12–23 months, and declined after the age range of 36–47 months (Table 3).
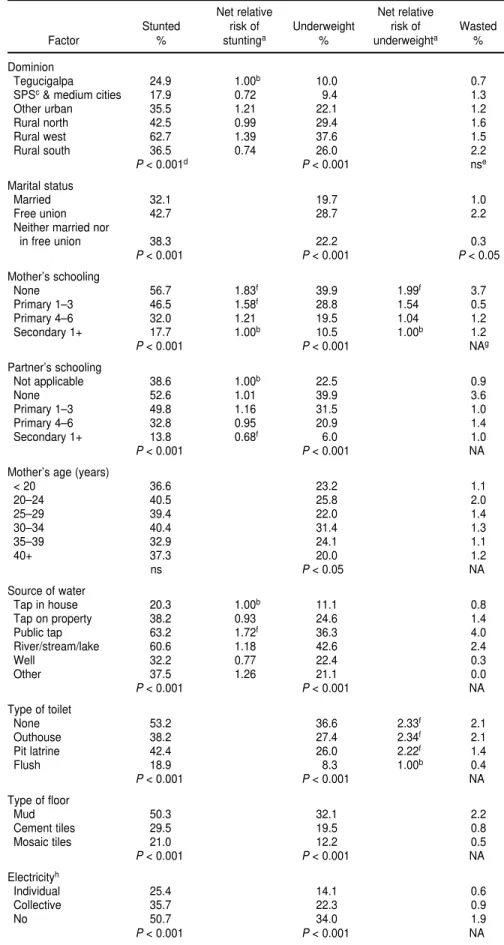
There were noticeable dominion dif-ferences in nutrition status (Table 4). Stunting was highest in the rural west, where more than 60% of children were stunted, a figure at least 20 percentage points higher than in the other
domin-TABLE 2. Percentage of children 12–71 months of age with diarrhea, cough, and runny nose in the preceding 2 weeks by dominion and age group, national micronutrient survey, Honduras, 1996
Diarrhea Cough Runny nose
No. of
Category % % % children
Dominion
Tegucigalpa 23.3 50.5 63.6 191
SPSa& medium cities 27.9 50.4 58.3 226
Other urban 30.9 50.8 59.4 212
Rural north 32.5 60.3 70.0 771
Rural west 30.1 55.6 71.7 205
Rural south 25.2 56.9 67.6 133
Chi-squared Pvalue nsb P< 0.05 P< 0.002
Age group
12–23 months 53.6 60.6 71.5 384
24–35 months 33.4 59.6 76.7 394
36–47 months 21.3 55.9 63.6 333
48–59 months 16.1 51.4 58.3 343
60–71 months 17.9 49.9 58.2 283
Chi-squared Pvalue P< 0.001 P< 0.02 P< 0.001
Overall (12–59 mo) 31.9 57.1 68.0 1 454
Overall (12–71 mo) 29.9 56.0 66.5 1 744
ions. Thirty-eight percent of children in the rural west were underweight, again a proportion higher than in any of the other dominions. Indeed, Honduras can be divided into three groups based on the prevalence of stunting and un-derweight: 1) lowest prevalence, in Tegucigalpa and SPS and medium cities; 2) medium prevalence, in other urban areas, the rural north, and the rural south; and 3) the highest preva-lence, in the rural west. This pattern was also found for severe stunting and severe underweight (data not shown).
Among the socioeconomic variables studied, the age of the mother/care-taker’s partner was not associated with nutrition status. Similarly, whether the mother/caretaker or her partner worked for an income was not associ-ated with nutrition status. In contrast, children were less likely to be chroni-cally undernourished if their mother/ caretaker was married or if she or her partner had attended secondary school (Table 4). Fewer children whose moth-ers/caretakers were over 40 years old were underweight.
Having tap water in the house and having a flush toilet were associated with lower levels of chronic undernu-trition. Other indicators that reflect higher social and economic status were associated with better nutrition status. These included having a tiled floor, electricity in the house, or a greater number of possessions (Table 4). Many of these social and economic
factors, however, not only interact with each other but also with domin-ion. This interaction needs to be taken into account when assessing risk fac-tors for undernutrition.
As for biological factors, there were no age- or gender-specific patterns in the prevalence of undernutrition for children 12–71 months old. Children who had had diarrhea in the preceding 2 weeks were more likely to be chroni-cally or acutely undernourished than those who had not (Table 4). Cough and a runny nose were also associated with a higher level of underweight but not stunting or wasting. A recent his-tory of these illnesses may reflect the short-term cumulative association that repeated bouts of these infections have with retarded growth, and vice versa.
Overall, among children 12–71 months old, having received iron sup-plements in the preceding 6 months was protective against chronic under-nutrition. A similar finding was ob-served for underweight among children who had ever received vitamin A and among those who had been dewormed using antihelminth therapy in the pre-ceding 6 months. These findings could reflect the direct association between supplementation and nutrition status or the indirect association with better use of health care facilities. Underweight was also associated with being anemic (Hb below 11 g/dL), as well as with being both anemic and vitamin A defi-cient (plasma retinol below 20 µg/dL).
Risk factors for stunting and underweight
The socioeconomic and health vari-ables identified as important in the bi-variate analyses were used in a logistic regression model to determine their net effects on stunting and under-weight. In Table 4, the ratios or relative risks (RRs) included are only those that were significant in the logistic re-gression model; where there are no values in the table, the variables were no longer significant after controlling for the other variables in the model.
For stunting among Honduran chil-dren 12–71 months old the important determinants were mother/caretaker’s and father’s schooling, source of water, possession score, and dominion (Table 4). For mother/caretaker’s schooling, having attended at least grade 1 of sec-ondary school was the reference cate-gory, with a numerical value of 1.00.
In comparison to children whose mother/caretaker had attended at least grade 1 of secondary school, there was an 83% higher relative risk of stunting among children whose mother/care-taker had never been to school, a statis-tically significant difference. Among children whose mother/caretaker had only attended grade 1, 2, or 3 of pri-mary school, the relative risk was 58% higher, again a statistically significant difference. Children whose mother/ caretaker had attended primary grade 4, 5, or 6 were 21% more likely to be TABLE 3. Percentage of children 12–71 months of age severely and moderately stunted, underweight, and wasted by age group, national micronutrient survey, Honduras, 1996
Stunteda Underweighta Wasteda
Severe Moderate Total Severe Moderate Total Severe Moderate Total Number
Age group % % % % % % % % %
12–23 months 12.7 21.2 33.9 5.4 21.7 27.1 0.2 3.5 3.7 381
24–35 months 13.0 26.8 39.8 4.5 21.4 25.9 0.0 1.0 1.0 389
36–47 months 18.5 21.5 40.0 5.3 18.1 23.4 0.1 0.1 0.2 331
48–59 months 12.8 25.0 37.8 3.0 17.2 20.2 0.0 0.3 0.3 342
60–71 months 10.8 31.1 41.9 0.7 24.8 25.5 0.0 1.7 1.7 282
Chi-squared Pvalue P< 0.02 P< 0.02 NAb
Overall 13.6 24.9 38.5 4.0 20.5 24.5 0.1 1.4 1.5 1 725
stunted, but this difference was not sta-tistically significant.
Children from households in which the mother’s partner had attended at least grade 1 of secondary school were 32% less likely to be stunted than chil-dren whose mother’s partner did not live with them (reference category).
Children from households that got water from a public tap were 72% more likely to be stunted than those from households that had water piped to the home, even after controlling for other social and economic factors. The house-hold possession score, which was a proxy for wealth, also predicted stunt-ing. In comparison to children from households with five or more posses-sions, children from households that had no possessions were 3.25 times as likely to be stunted. For children from households with one or two posses-sions, the net relative risk was 2.43.
Dominion was significantly associ-ated with the net relative risk of stunt-ing; children in the rural west were at 39% greater risk of being stunted than those in Tegucigalpa.
None of the biological variables stud-ied was a good predictor of stunting.
For underweight among children 12–71 months old, the predictive non-biological and non-biological factors were micronutrient status, diarrhea, mater-nal/caretaker’s schooling, type of toi-let, and possession score (Table 4). Children with a normal plasma retinol (> 20 µg/L) but a low hemoglobin level (< 11 g/dL) were 28% more likely to be underweight than children hav-ing both a normal plasma retinol level and a normal hemoglobin level. Chil-dren with concurrent low hemoglobin and plasma retinol levels were 95% more likely to be underweight than children with neither deficiency. Diar-rhea, which has an immediate effect on energy balance, increased the risk of being underweight by 32%.
In comparison to children from households with a possession score of 5 or more, children from house-holds with a possession score of 0 had a net relative risk of underweight of 2.38. For children from households with a possession score of 1 or 2, the relative risk was 1.80. Having a flush
TABLE 4. Percentage of children 12–71 months of age stunted, underweight, and wasted by background factors, national micronutrient survey, Honduras, 1996
Net relative Net relative
Stunted risk of Underweight risk of Wasted
Factor % stuntinga % underweighta %
Dominion
Tegucigalpa 24.9 1.00b 10.0 0.7
SPSc& medium cities 17.9 0.72 9.4 1.3
Other urban 35.5 1.21 22.1 1.2
Rural north 42.5 0.99 29.4 1.6
Rural west 62.7 1.39 37.6 1.5
Rural south 36.5 0.74 26.0 2.2
P< 0.001d P< 0.001 nse
Marital status
Married 32.1 19.7 1.0
Free union 42.7 28.7 2.2
Neither married nor
in free union 38.3 22.2 0.3
P< 0.001 P< 0.001 P< 0.05
Mother’s schooling
None 56.7 1.83f 39.9 1.99f 3.7
Primary 1–3 46.5 1.58f 28.8 1.54 0.5
Primary 4–6 32.0 1.21 19.5 1.04 1.2
Secondary 1+ 17.7 1.00b 10.5 1.00b 1.2
P< 0.001 P< 0.001 NAg
Partner’s schooling
Not applicable 38.6 1.00b 22.5 0.9
None 52.6 1.01 39.9 3.6
Primary 1–3 49.8 1.16 31.5 1.0
Primary 4–6 32.8 0.95 20.9 1.4
Secondary 1+ 13.8 0.68f 6.0 1.0
P< 0.001 P< 0.001 NA
Mother’s age (years)
< 20 36.6 23.2 1.1
20–24 40.5 25.8 2.0
25–29 39.4 22.0 1.4
30–34 40.4 31.4 1.3
35–39 32.9 24.1 1.1
40+ 37.3 20.0 1.2
ns P< 0.05 NA
Source of water
Tap in house 20.3 1.00b 11.1 0.8
Tap on property 38.2 0.93 24.6 1.4
Public tap 63.2 1.72f 36.3 4.0
River/stream/lake 60.6 1.18 42.6 2.4
Well 32.2 0.77 22.4 0.3
Other 37.5 1.26 21.1 0.0
P< 0.001 P< 0.001 NA
Type of toilet
None 53.2 36.6 2.33f 2.1
Outhouse 38.2 27.4 2.34f 2.1
Pit latrine 42.4 26.0 2.22f 1.4
Flush 18.9 8.3 1.00b 0.4
P< 0.001 P< 0.001 NA
Type of floor
Mud 50.3 32.1 2.2
Cement tiles 29.5 19.5 0.8
Mosaic tiles 21.0 12.2 0.5
P< 0.001 P< 0.001 NA
Electricityh
Individual 25.4 14.1 0.6
Collective 35.7 22.3 0.9
No 50.7 34.0 1.9
toilet was protective against being underweight. Children from house-holds that did not have a flush toilet were at more than double the risk of being underweight than those from households with a flush toilet. Finally, maternal education was protective
against underweight. Children whose mother/caretaker had not attended school were at double the risk of being underweight compared with those whose mother/caretaker had at-tended at least grade 1 of secondary school.
DISCUSSION
The findings from this national sur-vey reflect that, overall, the socioeco-nomic situation of households in rural areas was worse than that in urban ones and, among the rural areas, living conditions in the south and west were more difficult than in the north. These findings were consistent with existing data and reflect the lack of basic ser-vices, which is a consequence of the in-equitable distribution of resources ver-sus the needs of various segments of the population. Decisionmakers at both the national and local level need to realize that these health inequities will not necessarily be resolved until there is a more equal distribution of re-sources or services.
Symptoms of respiratory infection were present in over one-half of the children between 12 and 71 months of age. Diarrhea was less prevalent, but it still affected 30% of children. In con-trast, the 1997 Family Health and Epi-demiology Survey (12) found that the prevalence of diarrhea among children under 5 years of age had declined from 30.2% to 19.3% between 1987 and 1996. Data on diarrhea are affected by such factors as how the question is asked, and the season. This may ac-count for the different results found in the two surveys. For example, while the 1996 micronutrient survey was car-ried out after the rains, between July and October, the Family Health and Epidemiology Survey was conducted between February and August, during and immediately after the rains.
Overall, data from the micronutrient survey showed that morbidities de-clined with age. For example, more children under 3 years old had had di-arrhea, cough, or a runny nose in the preceding two weeks than was true for older children. The high prevalence of diarrhea among the younger children could have been related to food prepa-ration and feeding practices and to increased exposure to pathogens as children become increasingly mobile throughout their first 2–3 years of life. Children may become more immune to infections as they get older because their living environment predisposes Possession score
0 59.5 3.25f 41.6 2.38f 2.5
1–2 41.8 2.43f 25.7 1.80f 1.5
3–4 20.5 1.36 9.1 0.79 0.0
5+ 13.5 1.00b 9.1 1.00b 0.9
P< 0.001 P< 0.001 NA
Diarrhea last 2 weeks
Yes 44.8 33.2 1.32f 2.8
No 36.0 20.9 1.00 0.9
P< 0.001 P< 0.001 P< 0.005
Cough last 2 weeks
Yes 40.5 26.4 1.2
No 36.2 22.2 1.8
ns P< 0.05 ns
Runny nose last 2 weeks
Yes 40.1 26.2 1.2
No 35.6 21.4 1.8
ns P< 0.05 ns
Received Fe last 6 mo
Yes 32.6 21.1 1.5
No 41.2 26.1 1.4
P< 0.001 P< 0.05 ns
Ever received vitamin A
Yes 39.6 24.0 1.6
No 42.5 33.0 1.8
ns P< 0.05 NA
Antihelminth last 6 mo
Yes 36.1 21.0 1.0
No 40.3 27.2 1.8
ns P< 0.005 ns
Micronutrient status
VADiand IDAj 53.6 47.1 1.95e 1.6
VAD only 53.2 33.3 0.96 1.8
IDA only 39.3 25.9 1.28b 2.3
Neither VAD nor IDA 34.2 19.6 1.00b 1.0
P< 0.001 P< 0.001 NA
Overall 38.5 24.5 1.4
Number 1 725 1 628 1 725 1 516 1 725
aThe relative risks included are only those that were significant in the logistic regression model; where there are no values in
the table, the variables were no longer significant after controlling for the other variables in the model.
bOverall P< 0.05. cSPS = San Pedro Sula.
dThroughout, level of significance based on chi-squared test. ens = not significant.
fP< 0.05 compared with reference category.
gNA = not applicable; cell numbers too small for a valid chi-squared test.
h“Individual” electrical power supplies a single household; “collective” electrical power serves several households sharing and
paying for a single electrical line.
iVAD = vitamin A deficiency. jIDA = iron deficiency anemia. TABLE 4. (Continued)
Net relative Net relative
Stunted risk of Underweight risk of Wasted
them to a gradual increase in the colo-nization of various bacteria and viruses in the intestinal gut, which compete with each other and determine the presence of infection. Targeting health education messages to mothers with children under 3 years of age may be an important option to consider.
Nearly two out of five children were stunted, a further one out of four was underweight, and a very few were wasted. These were all indications that undernutrition in children 12–71 months old was chronic. Undernutri-tion, however, was not associated with age, which indicated that by the age of 12 months the nutritional damage of poor infant feeding practices coupled with morbidity had already affected child growth negatively. It also sug-gested that during their preschool years, Honduran children did not have the opportunity for catch-up growth to compensate for the nutri-tional harm imposed in infancy.
Logistic regression analyses showed that chronic undernutrition was largely determined by parental school-ing and factors generally associated with poverty. The results for maternal education show the beneficial effects of maternal schooling beyond primary grade 3 per se on the risk of stunting and underweight of children. The lower risk of stunting among children whose mother’s partner’s had been to secondary school may have been a re-flection of a paternal interest in child nutrition, rather than higher income, given that other proxies for wealth were already in the model.
The finding that children from households obtaining water from pub-lic taps were at greater risk of being stunted suggests this water may be contaminated, predisposing children to repeated bouts of infection and trapping them in a vicious cycle of undernutrition-infection that compro-mises their growth. Having piped water in the home also reflect higher income levels and/or that the environ-mental sanitation in these homes was better. It is well known, for example, that where water is not readily avail-able, food hygiene is frequently poor, which increases the risk of pathogen
contamination and exposure to ill-nesses. Indeed, having a flush toilet in the home greatly reduced the risk of being underweight. Because wealth was already controlled for through possession score, this result probably reflected the importance of environ-mental hygiene on underweight.
Among the determinants for risk of being underweight were a recent his-tory of diarrhea, which directly affects body weight, and micronutrient status (more so anemia than subclinical VAD). These data suggested that both the quantity of the diet and its quality were inadequate. In contrast, none of the biological variables studied were good predictors of stunting. This was expected, given that stunting is the cu-mulative effect of poor nutrition and that most of the biological indicators were based on recent events.
Although living in a particular do-minion was a risk factor for stunting, it did not by itself cause stunting. Thus, the dominion must have been acting as a proxy for other factors that were not measured in the survey and that were associated with chronic poor nu-trition, such as access to food, feeding practices, child care practices, and par-asitic infestations. It should be noted, however, that the rural west includes the departments of Lempira, Intibucá, and La Paz, where the Lenca ethnic group, known for their short stature, reside.
Since 1987 in Honduras, four nation-ally representative surveys have col-lected height and weight data on chil-dren under 5 years of age. Trend analysis done by Grummer-Strawn6
has shown that, while there has been a slight reduction in the prevalence of stunting over the last 10 years, the na-tional prevalence remains very high and there has been no change in the prevalence of underweight. Histori-cally, wasting or acute undernutrition has not been a public health problem. There have been small changes in the very high level of chronic
undernutri-tion in children over the past ten years. This is intriguing, given the number of programs implemented and other changes that have occurred. These in-clude several national food and nutri-tion plans (although possibly not im-plemented very effectively); large amounts of resources spent on nutri-tion programs, particularly food distri-bution activities for women and chil-dren; and significant improvements in health services as reflected in increased immunization coverage (at least 80% coverage for each immunogen), in-creased diarrheal disease control, re-duced infant mortality (29/1 000 live births in 1996), decreased under-5 mor-tality (35/1 000 live births in 1996), and improved breast-feeding practices (13).
On the other hand, the observed trends in nutrition are possibly ex-pected when compared with the eco-nomic indicators (13). Honduras is one of the poorest countries in the Region of the Americas, with a per capita gross national product (GNP) of $US 600 in 1995. The annual per capita GNP growth rate was only 1.1% between 1965 and 1980 and decreased to 0.1% between 1985 and 1995. Between 1985 and 1995 the inflation rate was 14%. An estimated 47% of the population was living on less than $1.00 per day during the 1990–1996 period. Taken together, these data show that the social and eco-nomic constraints that families face are daunting and that the constraints’ im-pact on nutrition status cannot be com-pletely overcome by just improved ac-cess to health care.
The Ministry of Health of Honduras is implementing an Integrated Child Care Program, in which growth moni-toring is the central component. The training component and the informa-tion/education/communication com-ponent of the program are based on knowledge provided by existing epi-demiological and qualitative surveys, which include biochemical, dietary, and other nutrition-related data. About 70% of households have good access to health care, and there are significant ef-forts toward strengthening health care delivery at the primary level. However, for the program to be a success, it will be important for the Ministry of Health
6 Grummer-Strawn, L. Trends in the nutritional
to understand what households per-ceive their priorities to be, how nutri-tion and health consideranutri-tions fit into these priorities, and how the perceived priorities can be achieved within the context of the existing constraints that households face. The effectiveness of in-terventions needs to be monitored and measured in terms of community per-ceptions of priorities. Otherwise, com-munity “ownership” of the program is unlikely, and it is doubtful that
objec-tives will be achieved, even though ser-vices are, in principle, available.
Acknowledgments. The survey was implemented by the Ministry of Health in collaboration with the Inter-national Eye Foundation. Technical and financial assistance was provided through the Opportunities for Mi-cronutrient Interventions (OMNI)
Proj-ect of the U.S. Agency for International Development, under contract HRN-C-00-93-00025-08. Dr. Omar Dary’s labo-ratory at the Institute of Nutrition of Central America and Panama con-ducted the retinol and AAGP assays. Thanks are due to the field teams and households who made the survey pos-sible and to Dr. Frances Davidson of the U.S. Agency for International De-velopment, Washington, D.C., for sup-port and helpful comments.
1. Mora JO, Dary O. Deficiencia de vitamin A y acciones para su prevención y control en América Latina y el Caribe, 1994. Bol Oficina Sanit Panam 1994;117(6):519–528.
2. Interdepartmental Committee for National Defense/Instituto de Nutrición de Centro América y Panamá. Nutritional evaluation of the population of Central America and Panama. Washington, DC: U.S. Department of Health, Education, and Welfare; 1972. (DHEW Publication No HSM72-8120). 3. Barahona F, Soto J, O’Connor G, Madariaga
A. Encuesta nacional de epidemiología y salud familiar. Datos preliminares. Teguci-galpa: Ministerio de Salud Pública de Hon-duras; 1987.
4. Honduras, Ministry of Health. Epidemiology and Family Health Survey, 1991/92. Teguci-galpa: MOH; 1994.
5. World Health Organization. Measuring change in nutritional status. Geneva: WHO; 1989.
6. World Health Organization. Physical status: the use and interpretation of anthropometry, report of a WHO expert committee. Geneva: WHO; 1995. (WHO Technical Report Series 854).
7. Dary O, Arroyave G. Sugar fortification with vitamin A: analytical methods for the control and evaluation of sugar fortification of vita-min A. Washington, DC: U.S. Agency for In-ternational Development/Opportunities for Micronutrient Interventions; 1996.
8. World Health Organization. Indicators for as-sessing vitamin A deficiency and their appli-cation in monitoring and evaluating interven-tion programs. Geneva: WHO; 1994. 9. Fleck A. Acute phase response: implications
for nutrition and recovery. Nutrition 1988;2: 109–117.
10. Filteau SM, Morris SS, Abbott RA, Tomkins AM, et al. Influence of morbidity on serum retinol of children in a community-based
study in northern Ghana. Am J Clin Nutr 1993;58(2):192–197.
11. World Health Organization. Nutritional ane-mia. Geneva: WHO; 1972. (WHO Technical Report Series No. 3).
12. Honduras, Ministerio de Salud. Encuesta na-cional de epidemiología y salud familiar, 1996. Tegucigalpa: Ministerio de Salud; 1997. 13. United Nations Children’s Fund. The state of
the world’s children 1998. New York: UNICEF; 1998.
Manuscript received on 14 March 1998. Revised version accepted for publication on 15 April 1999.
REFERENCES
Para determinar el estado nutricional de los niños de 12 a 71 meses de edad, el Minis-terio de Salud de Honduras realizó en 1996 una encuesta nacional sobre micronutrien-tes en la que se incluyeron mediciones antropométricas. De los 1 744 niños que parti-ciparon, 38% presentaban retraso del crecimiento, grave en 14%; 24% bajo peso, grave en 4%, y 1% emaciación, grave en 0,1%. El país se puede dividir en tres zonas en fun-ción del nivel de retraso del crecimiento y bajo peso: 1) la de baja prevalencia, formada por Tegucigalpa, San Pedro Sula y ciudades medianas; 2) la de prevalencia interme-dia, formada por otras zonas urbanas y las zonas rurales del norte y del sur, y 3) la de alta prevalencia, integrada por las zonas rurales del oeste. Mediante un análisis de re-gresión logística se identificaron los siguientes factores como determinantes impor-tantes del retraso del crecimiento: el nivel de escolaridad de las madres/cuidadoras y de los padres, las fuentes de agua, la localización geográfica de la residencia del niño y la “puntuación de posesiones”, referida a la posesión de aparatos como radios, tele-visores, refrigeradores, equipos de música o planchas eléctricas. A su vez, los factores que predijeron el bajo peso fueron el estado de los micronutrientes, la diarrea, el nivel de escolaridad de las madres/cuidadoras, el tipo de instalación sanitaria y la “pun-tuación de posesiones”. Los datos históricos indican que la prevalencia nacional de desnutrición crónica ha cambiado poco en los últimos 10 años, pese a la importante mejoría de los servicios de salud y a la puesta en marcha de varios planes nacionales de alimentación y nutrición. Es posible que estas intervenciones positivas hayan sido contrarrestadas por los lentos progresos del desarrollo económico. Las futuras inter-venciones nutricionales deberían tomar en consideración las necesidades y priorida-des percibidas a nivel doméstico, con el fin de fijar objetivos nutricionales realistas.
RESUMEN