A descriptive epidemiology of leisure-time
physical activity in Brazil, 1996–1997
Carlos A. Monteiro,
1Wolney L. Conde,
1Sandra M. Matsudo,
2Victor R. Matsudo,
2Isabela M. Bonseñor,
3and Paulo A. Lotufo
3Objectives. To describe the prevalence, frequency, type, motivation for, and demographic and socioeconomic distribution of leisure-time physical activity (LTPA) among adults in Brazil. Methods. The data source for our study was the Brazilian Living Standards Measurement Survey (LSMS) (Pesquisa sobre Padrões de Vida), which was conducted in 1996 and 1997. This survey studied a multistage stratified probabilistic sample of 4 893 households, which in-cluded 11 033 persons who were 20 years of age or older. The surveyed households were se-lected in the two most populous Brazilian regions, the Northeast and the Southeast, where in total 70% of all Brazilians live. The selected persons responded to a series of questions con-cerning their leisure-time physical activities.
Results. Only 13% of the Brazilians surveyed reported performing at least a minimum of 30 minutes of LTPA on one or more days of the week, and only 3.3% reported doing the recom-mended minimum of 30 minutes on 5 or more days of the week. In younger age groups, men were more active than were women. However, this difference sharply decreased with increasing age, and by the age range of 40 to 45 years the prevalence of LTPA was similarly low in both genders. Men reported engaging in more team sports, and women reported more walking/jog-ging activities, but walking/jogwalking/jog-ging was relatively more common in both genders when physi-cal activity was performed on 5 or more days of the week. Recreation was by far the leading rea-son given by men to engage in LTPA, while recreation, health concerns, and even esthetic concerns were all relevant for women. In both genders, health concerns tended to be relatively more important for those exercising more days of the week. Also in both genders, increasing age was associated with more frequent LTPA, more walking/jogging than team sports, and more health concerns reasons than reasons related to recreation. Among both men and women there was a strong association between LTPA and socioeconomic status, measured either by income or schooling, independent of age, region, and urban or rural place of residence.
Conclusions. The prevalence of adult LTPA in Brazil was much lower than the levels that have been reported for developed countries. However, the demographic and social distribution of LTPA in Brazil followed a pattern similar to the one usually observed in developed nations, where men tend to be more active than women, increasing age limits LTPA, and higher so-cioeconomic status is associated with more LTPA. Our data will provide a baseline to evalu-ate the impact on LTPA of “Agita Brasil” (“Move, Brazil”), an initiative to encourage physi-cal activity that was implemented in the country after 1997.
Physical fitness, exercise, sports, age factors, Brazil.
ABSTRACT
Key words
1 University of São Paulo, School of Public Health
and Center for Epidemiological Research in Health and Nutrition, Department of Nutrition, São Paulo, São Paulo, Brazil. Send correspondence to: Carlos A. Monteiro, University of São Paulo, School of Public Health and Center for Epidemiological
Re-search in Health and Nutrition, Department of Nu-trition, Ave. Dr. Arnaldo, 715–01246-904, São Paulo, São Paulo, Brazil; e-mail: carlosam@ usp.br
2 Centro de Estudos do Laboratório de Aptidão
Física de São Caetano do Sul and Programa Agita São Paulo, São Paulo, São Paulo, Brazil.
3 University of São Paulo, School of Medicine,
Although physical activity has tra-ditionally been considered a healthy behavior by human societies, strong scientific evidence documenting the various benefits of physical activity is relatively recent. Various epidemio-logical studies have demonstrated that physically active individuals both live longer than sedentary individuals and are less likely to develop various chronic diseases, including ischemic heart disease, arterial hypertension, type 2 diabetes, osteoporosis, colon cancer, anxiety, and depression (1–3). Findings from epidemiological studies have been consistent, with experimen-tal studies showing that physical ac-tivity has favorable effects on lipid metabolism, blood pressure, body composition, glucose intolerance, sen-sitivity to insulin, bone density, and immunological and psychological functions (1, 3). In the United States of America, sedentary behavior is re-sponsible for approximately 12% of all deaths (4) and about one third of all deaths caused by ischemic heart dis-ease, colon cancer, and diabetes (5). Recent estimates from Finland indicate that 22% to 39% of the burden of car-diovascular disease in the population there could be alleviated by eliminat-ing a sedentary lifestyle, an effect higher than the one expected from stopping smoking (3).
Systematic reviews of findings from population studies that have evalu-ated the association between physical activity and risks of morbidity and mortality have shown, in most cases, a dose-response effect and a maximal health benefit when sedentary individ-uals are compared with moderately active individuals (1, 6). Considering this fact and recognizing the difficul-ties in achieving adherence using tra-ditional approaches that focus on vig-orous exercise for an extended period of time, the Centers for Disease Con-trol and Prevention of the United States of America and the American College of Sports Medicine stated that all adults should accumulate on most days of the week (and preferably all the days of the week) at least 30 min-utes of physical activity of moderate intensity, such as walking rapidly for 3
to 4 km (1). This orientation was adopted by health authorities of the United States (2) and by health cam-paigns in several other countries, in-cluding Brazil (7). The positive effect of 30 minutes of moderate physical ac-tivities on most days of the week has been confirmed by several longitudi-nal studies (8–14), including at least one clinical trial (15).
However, with the use of modern technologies that drastically reduce physical activity at work, at home, and even during leisure time, a sedentary lifestyle appears to be the rule in most developed countries (16, 17). Estimates of the prevalence of sedentary life-styles in developed countries are usu-ally based on population studies that ask individuals about the duration, frequency, and intensity of physical activity performed during leisure moments (18). In the United States, 38.3% of the adults do not report any type of leisure-time physical activity (LTPA), and 21.1% report less than the recommended minimum of 30 minutes of mild to moderate physical activity per day on 5 or more days of the week or 20 minutes of vigorous physical activity at least 3 days per week (19). Estimates for European countries show that approximately 32% of adults do not perform any type of physical activity during leisure time (ranging from 12% in Sweden to 61% in Portugal) and that another 25% do not go beyond 3 hours of exercise per week (3).
A review of several studies (not en-tirely comparable) that were con-ducted in the United States suggests there was some increase in LTPA be-tween the 1960s and the 1980s (20). Time trends during the 1990s in that country, provided by the Behavioral Risk Factor Surveillance System, point to a very slow increase in the propor-tion of adults sufficiently active dur-ing their leisure time, from 24.3% in 1990 to 25.4% in 1998 (21). However, a decrease in the general level of activity in the population in the United States cannot be ruled out due to the pro-gressive decline in the physical activ-ity expended for work, commuting, and other routine daily activities (22).
Population studies conducted in the United States indicate that LTPA in adults is influenced by age, gender, years of formal education, and income, (19, 23) as well as by retirement status (24).
In Brazil, as in other developing countries, population studies on pat-terns of physical activity have been scarce and of limited representative-ness (25, 26). The first national house-hold survey in Brazil to include physi-cal activity was the Living Standards Measurement Survey (LSMS) (Pesquisa sobre Padrões de Vida). That survey was conducted from March 1996 to Febru-ary 1997 by the Brazilian Institute of Geography and Statistics (Instituto Brasileiro de Geografia e Estatística), which is the Brazilian agency responsi-ble for official statistics, in collabora-tion with the World Bank. The objec-tive of this study was to describe the prevalence, frequency, type, motiva-tion, and socioeconomic and demo-graphic distribution of leisure-time physical activity in the Brazilian adult population studied by the LSMS.
METHODS
Study population and sampling
households were randomly selected within each selected census tract. Five geographical strata were considered in each region: three strata for households located in metropolitan areas (cities with at least one million inhabitants), one stratum for urban nonmetropolitan households, and one stratum for rural households. Due to budget constraints and also following the experience of World Bank LSMSs conducted in other countries, the sample size in Brazil was fixed at 480 households per geographi-cal stratum and at 4 800 households for the entire survey. In the metropolitan and the urban nonmetropolitan strata, 60 census tracts were drawn from each stratum, and 8 households were drawn from each census tract. In the rural strata, 30 census tracts were drawn from each stratum and 16 households were drawn from each census tract. The final sample included 4 893 households and 11 033 individuals 20 years of age or older (5 234 men and 5 799 women).
Data collection
All those 11 033 individuals studied by the LSMS in Brazil answered a ques-tionnaire about physical activity during leisure time. The questionnaire was structured, with no open questions and with precoded alternative answers. The questionnaire included six questions: (1) Do you engage in any physical exer-cise or sport?; (2) What kind of exerexer-cise or sport do you perform? (Please mark the most frequent group: soccer/ volley/basketball, walking/jogging, gym/muscular exercise, swimming, other sports.); (3) Do you perform exer-cise or a sport every week?; (4) How many days per week? (Please include all exercise and sports.); (5) How many minutes or hours in each day? (Please include all exercise and sports.); (6) What is your main reason for en-gaging in exercise or sport? (recreation, health/medical counseling, esthetics/ beauty, other reason). Other informa-tion obtained by the LSMS in Brazil and that was relevant to this study included age, sex, rural or urban place of resi-dence, number of years of schooling, and per capita family income (all
sources of family income divided by the number of individuals in the fam-ily). The response rate was 100% for all of these questions except family in-come, which approximately 95% of the respondents answered.
Data analysis
In this study we defined “leisure-time physical activity” as performing a minimum of 30 minutes of one or more physical exercises or sports in one or more sessions on at least one day per week. We classified individu-als reporting LTPA according to the number of days per week they per-formed LTPA (1 or 2 days per week, 3 or 4 days per week, and 5 or more days per week), main type of exercise/ sport, and main reason for doing it. We defined “recommended LTPA” as a minimum of 30 minutes per day of any physical exercise or sport done on 5 or more days of the week.
The prevalence of any LTPA and the prevalence of LTPA done on 1 or 2 days, 3 or 4 days, and 5 or more days per week were estimated for the total adult population and for the strata cre-ated based on the demographic vari-ables (sex, age, region, and area of res-idence) and socioeconomic variables (income and number of years of schooling). Formal education was cat-egorized in quartiles (0–2 years of schooling, 3–4 years, 5–8 years, and 9 or more years). Monthly per capita family income was also categorized in quartiles: 0–107.9 reais (R$), R$ 108– 223.9, R$ 224–452.9, and R$ 453 or
more (one R$ was close to US$ 1.00 during the study period). The associa-tion between demographic and socio-economic variables and the practice of LTPA was evaluated using logistic re-gression and crude and adjusted odds ratios for LTPA (27). The statistical sig-nificance of the associations was veri-fied by the Wald test. Tests for linear trend were used when appropriate, considering age, income, and years of schooling as continuous variables. All statistical analyses were performed using the “svytab” commands from the Stata software program (28). These commands account for the sampling weights and the sampling design ef-fects on standard errors and confi-dence intervals that result from the complex sample design employed by the survey.
RESULTS
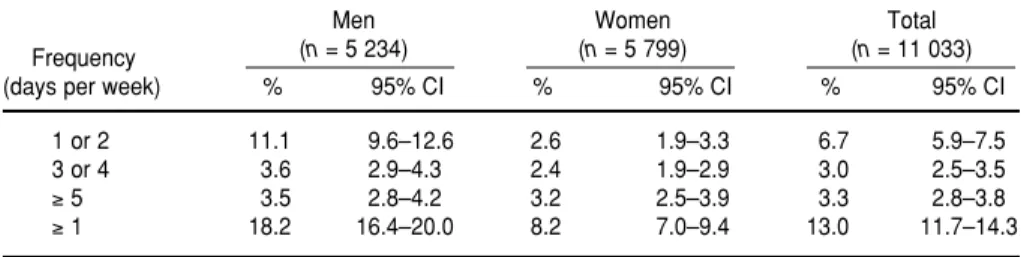
LTPA (a minimum of 30 minutes of any physical exercise or sport on at least one day per week) was reported by 13.0% of the Brazilian adults sur-veyed: 18.2% among men and 8.2% among women. Recommended LTPA (a minimum of 30 minutes on 5 or more days per week) was reported by only 3.5% of men and 3.2% of women. The majority of men who reported performing exercise/sports said they did so 1 or 2 days per week, while women who performed exercise/ sports were equally distributed in the categories of 1 or 2 days per week, 3 or 4 days per week, and 5 or more days per week (Table 1).
TABLE 1. Prevalence (% and 95% confidence interval (CI)) of leisure-time physical activity (at least 30 minutes in a day) according to the frequency (days per week) among persons 20 years old and older, Brazil, 1996–1997
Men Women Total
Frequency (n= 5 234) (n= 5 799) (n= 11 033)
(days per week) % 95% CI % 95% CI % 95% CI
1 or 2 11.1 9.6–12.6 2.6 1.9–3.3 6.7 5.9–7.5
3 or 4 3.6 2.9–4.3 2.4 1.9–2.9 3.0 2.5–3.5
≥5 3.5 2.8–4.2 3.2 2.5–3.9 3.3 2.8–3.8
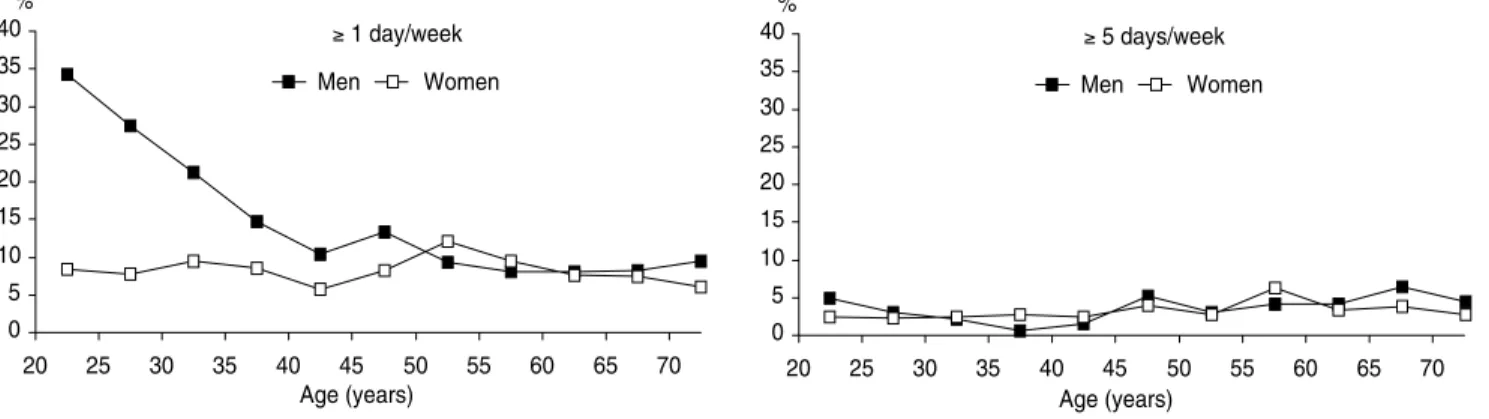
The prevalence of LTPA according to age groups is shown in Figure 1. LTPA among men declined sharply with age, falling from nearly 35% among men in the age range of 20–25 years to around 10% among those 40– 45 years old and older (Figure 1). LTPA among women was quite stable up to the range of 40–45 years (around 10%), reached 15% among those in the range of 50–55 years, and then de-clined slowly in the older age ranges.
Recommended LTPA (at least 30 minutes per day on 5 or more days per week) declined among men from ap-proximately 5% for those 20–25 years old to nearly zero for those 35–40 years old, returned to 5% for those 45–50 years old, and stayed at that level in older age groups. For women, the rec-ommended LTPA prevalence was sta-ble, around 3%, up to the age range of
40–45 years, reached 7% for those 55– 60 years old, and then declined in older age groups.
The leisure-time physical activities performed most often by men were team sports (soccer, volleyball, and basketball) (63.3%) and by women were walking/jogging (64.6%) (Table 2). The second most common activity for men was walking/jogging (24.0%) while for women it was gym/muscu-lar exercise (20.1%). For both men and women, team sports were reported most often among individuals report-ing LTPA on only 1 or 2 days of the week, while walking/jogging was re-ported most often among those report-ing LTPA on 5 or more days per week. The main reason given by men to perform LTPA was recreation (78.8%), although health concerns were rela-tively common among men reporting
5 or more days of LTPA (34.8%) (Table 3). Recreation (44.6%), and health con-cerns (32.3%) were the main reasons given by women to engage in LTPA, and health concerns again tended to be mentioned more often when LTPA was reported on 5 or more days per week. Reasons related to esthetic con-cerns were more important to women than men (16.8% vs. 3.9%, respec-tively). In both sexes, esthetic reasons were more common among individu-als reporting LTPA 3 or 4 days per week.
Recreation was by far the main rea-son given by men and women to per-form team sports (Table 4). Recreation and health concerns led the reasons given by men and women for per-forming walking/jogging. Recreation, esthetics, and health concerns, in that order, were the main reasons given by
FIGURE 1. Prevalence (%) of leisure-time physical activity (at least 30 minutes in a day) according to number of days per week, by age groups, among persons 20 years old and older, Brazil, 1996–1997
0 5 10 15 20 25 30 35 40
20 25 30 35 40 45 50 55 60 65 70
%
Age (years)
Men Women
≥ 1 day/week
0 5 10 15 20 25 30 35 40
20 25 30 35 40 45 50 55 60 65 70
%
Age (years)
Men Women
≥ 5 days/week
TABLE 2. Distribution (%) of individuals reporting leisure-time physical activity according to the main type of physical activity by number of days per week (D/W) among persons 20 years old and older, Brazil, 1996–1997a
Men Women
1 or 2 3 or 4 ≥5 ≥1 1 or 2 3 or 4 ≥5 ≥1
D/W D/W D/W D/W D/W D/W D/W D/W
Activity/Total (n= 644) (n= 222) (n= 214) (n= 1 080) (n= 159) (n= 165) (n= 192) (n= 516)
Soccer/Volleyball/Basketball 83.1 45.0 19.6 63.3 13.8 2.5 2.8 6.2
Walking/Jogging 7.7 33.1 66.2 24.0 49.3 59.1 81.3 64.6
Gym/Muscular exercise 4.5 12.6 10.1 7.2 24.3 29.1 9.7 20.1
Swimming 1.7 4.4 1.2 2.1 10.5 6.1 4.6 6.9
Other activity 3.1 5.0 3.0 3.4 2.2 3.2 1.6 2.3
Total 100.0 100.0 100.0 100.0 100.0 100.0 100.0 100.0
men and women for performing gym/ muscular exercise.
For both men and women, increas-ing age was associated with the report of more days of LTPA per week, more walking/jogging, and less team sports (Table 5). In terms of the main reason for performing LTPA, increasing age was associated with more concern with health and less focus on recreation.
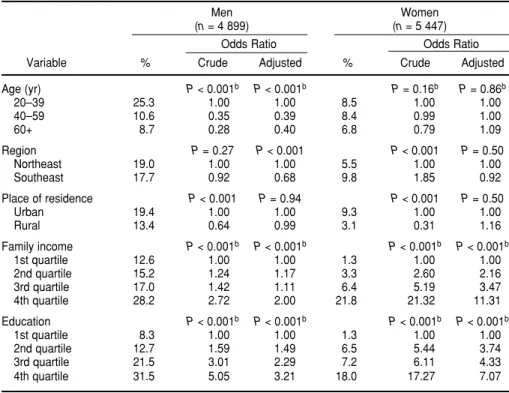
The independent influence of demo-graphic and socioeconomic variables on the probability of engaging in any LTPA (a minimum of 30 minutes on at least one day of the week) was ex-pressed through adjusted odds ratios (Table 6). For men, LTPA decreased with age, was lower for individuals living in the more developed South-east of Brazil, was independent of urban or rural residence, and in-creased with family income and even more so with formal education. For women, LTPA was independent of age, region, and place of residence, but increased strongly with both family in-come and formal education.
The influence of demographic and socioeconomic variables on the proba-bility of recommended LTPA (a mini-mum of 30 minutes on 5 or more days per week) is shown in Table 7. With men, increasing age was positively as-sociated with performing the recom-mended LTPA. Recomrecom-mended LTPA was also strongly and linearly associ-ated with formal education but not with family income. Among men there was a lower probability of performing the recommended LTPA in the rural milieu. Among women, there was a
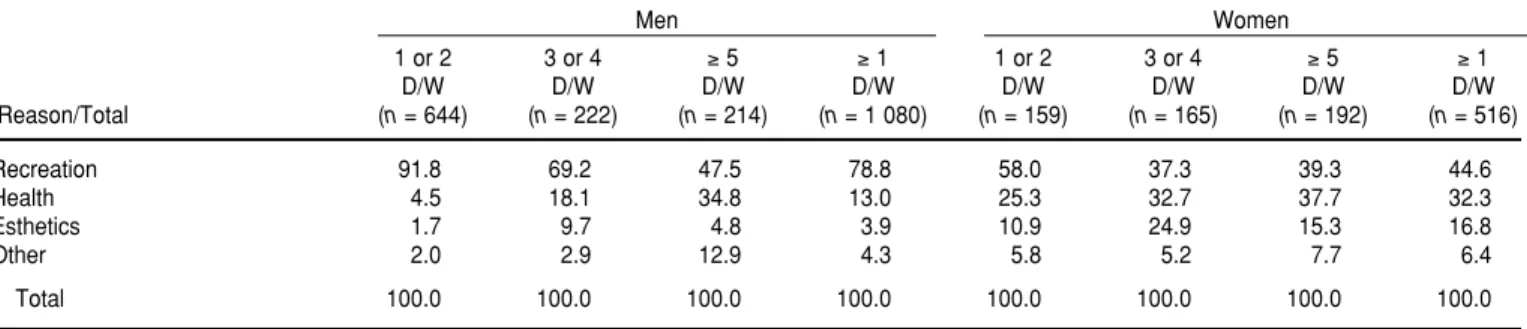
TABLE 3. Distribution (%) of individuals reporting leisure-time physical activity, according to the main reason for performing the activity, by number of days/week (D/W), among persons 20 years old and older, Brazil, 1996–1997a
Men Women
1 or 2 3 or 4 ≥5 ≥1 1 or 2 3 or 4 ≥5 ≥1
D/W D/W D/W D/W D/W D/W D/W D/W
Reason/Total (n= 644) (n= 222) (n= 214) (n= 1 080) (n= 159) (n= 165) (n= 192) (n= 516)
Recreation 91.8 69.2 47.5 78.8 58.0 37.3 39.3 44.6
Health 4.5 18.1 34.8 13.0 25.3 32.7 37.7 32.3
Esthetics 1.7 9.7 4.8 3.9 10.9 24.9 15.3 16.8
Other 2.0 2.9 12.9 4.3 5.8 5.2 7.7 6.4
Total 100.0 100.0 100.0 100.0 100.0 100.0 100.0 100.0
aLeisure-time physical activity = a minimum of 30 minutes of physical activity on at least one day of the week.
TABLE 4. Distribution (%) of individuals reporting leisure-time physical activity according to the main reason for performing it, by the type of the activity, among persons 20 years old and older, Brazil, 1996–1997a
Men Women
Soccer/ Gym/ Soccer/ Gymnastics/
Volleyball/ Walking/ Muscular Volleyball/ Walking/ Muscular Basketball Jogging exercise Basketball Jogging exercise Reason/Total (n= 682) (n= 264) (n= 77) (n= 30) (n= 330) (n= 111)
Recreation 97.5 43.1 40.7 85.3 41.7 38.3
Health 1.5 40.7 19.1 5.8 36.8 26.0
Esthetics 0.6 6.0 22.5 0.0 14.9 30.9
Other 0.5 10.3 17.6 8.8 6.6 4.8
Total 100.0 100.0 100.0 100.0 100.0 100.0
aLeisure-time physical activity = a minimum of 30 minutes of physical activity on at least one day of the week.
TABLE 5. Distribution (%) of individuals reporting leisure-time physical activity according to frequency, type of activity, and reason for performing it, by age groups, among persons 20 years old and older, Brazil, 1996–1997a
Men Women
20–39 40–59 60+ 20–39 40–59 60+
Leisure time years years years years years years
physical activity (n= 795) (n= 212) (n= 73) (n= 262) (n= 188) (n= 66)
Frequency (days/week)
1 or 2 68.5 47.6 17.8 38.1 26.8 18.8
3 or 4 19.6 18.1 23.9 30.5 27.8 31.6
≥5 11.9 34.3 58.4 31.4 45.4 49.6
Type
Soccer/Volleyball/Basketball 74.6 36.0 8.7 10.1 1.2 0.0
Walking/Jogging 13.2 48.2 84.6 53.2 74.7 80.0
Gym/Muscular exercise 7.7 8.3 2.2 21.4 17.6 18.8
Swimming 1.7 3.6 2.5 12.1 4.3 0.0
Other 2.7 4.0 2.0 3.1 2.2 1.3
Reason
Recreation 87.7 59.9 34.1 55.1 34.1 26.2
Health 6.0 24.6 52.0 14.3 47.8 69.9
Esthetics 3.3 7.1 3.8 22.3 13.3 3.9
Other 3.0 8.4 10.1 8.2 4.7 0.0
positive association between recom-mended LTPA and increasing age, family income, and formal education.
DISCUSSION
Our analysis of the 1996–1997 LSMS survey in Brazil showed that only 13.0% of the adult population surveyed re-ported performing any regular physical activity during their leisure time (a min-imum of 30 minutes on at least one day per week), with still fewer individuals— just 3.3%—reporting performing the minimum recommended level of 30 minutes daily for 5 days per week. Men seemed to be more active than women at younger ages, but due to a sharp de-cline in male physical activity with in-creasing age, the prevalence of LTPA was equivalent for the two genders after 50 years of age. Men preferred team sports, while women preferred activi-ties such as walking/jogging. However, walking/jogging led in the subgroup of men and women who performed phys-ical activity on 5 or more days per week. Recreation was by far the main reason given by men for engaging in LTPA, and recreation, health, and esthetic con-cerns were important among women. However, in both genders, health con-cerns were relatively common when physical activity was performed on 5 or more days per week. Also for both sexes, increasing age was associated with physical activity on more days of the week, more walking/jogging than team sports, and more reasons related to health concerns than to recreation. Also for both sexes the association be-tween LTPA and both income and ed-ucation was strongly positive, inde-pendent of age, region, and place of residence.
We see as possible limitations of this study aspects related to the sample representativeness, the assessment of physical activity patterns through re-call questionnaires, and our not having considered physical activities other than ones done during leisure time.
The survey sampling process was rig-orously probabilistic but, as described before, included only two of the five re-gions in the country. However, a
rea-TABLE 6. Prevalence (%) of leisure-time physical activity according to demographic and so-cioeconomic variables, among persons 20 years old and older, Brazil, 1996–1997a
Men Women
(n= 4 899) (n = 5 447)
Odds Ratio Odds Ratio
Variable % Crude Adjusted % Crude Adjusted
Age (yr) P<0.001b P<0.001b P= 0.16b P= 0.86b
20–39 25.3 1.00 1.00 8.5 1.00 1.00
40–59 10.6 0.35 0.39 8.4 0.99 1.00
60+ 8.7 0.28 0.40 6.8 0.79 1.09
Region P= 0.27 P<0.001 P<0.001 P= 0.50
Northeast 19.0 1.00 1.00 5.5 1.00 1.00
Southeast 17.7 0.92 0.68 9.8 1.85 0.92
Place of residence P<0.001 P= 0.94 P<0.001 P= 0.50
Urban 19.4 1.00 1.00 9.3 1.00 1.00
Rural 13.4 0.64 0.99 3.1 0.31 1.16
Family income P<0.001b P<0.001b P<0.001b P <0.001b
1st quartile 12.6 1.00 1.00 1.3 1.00 1.00
2nd quartile 15.2 1.24 1.17 3.3 2.60 2.16
3rd quartile 17.0 1.42 1.11 6.4 5.19 3.47
4th quartile 28.2 2.72 2.00 21.8 21.32 11.31
Education P<0.001b P<0.001b P<0.001b P <0.001b
1st quartile 8.3 1.00 1.00 1.3 1.00 1.00
2nd quartile 12.7 1.59 1.49 6.5 5.44 3.74
3rd quartile 21.5 3.01 2.29 7.2 6.11 4.33
4th quartile 31.5 5.05 3.21 18.0 17.27 7.07
aLeisure-time physical activity = a minimum of 30 minutes of physical activity on at least one day of the week. bTest for linear trend.
TABLE 7. Prevalence (%) of recommended leisure-time physical activity according to de-mographic and socioeconomic variables among persons 20 years old and older, Brazil, 1996–1997a
Men Women
(n= 4 899) (n = 5 447)
Odds Ratio Odds Ratio
Variable % Crude Adjusted % Crude Adjusted
Age (yr) P< 0.01b P< 0.001b P = 0.08b P< 0.05b
20–39 3.0 1.00 1.00 2.7 1.00 1.00
40–59 3.6 1.22 1.34 3.8 1.44 1.34
60+ 5.1 1.72 2.65 3.4 1.28 1.60
Region P= 0.85 P< 0.01 P< 0.001 P= 0.85
Northeast 3.4 1.00 1.00 1.9 1.00 1.00
Southeast 3.5 1.02 0.62 3.9 2.10 1.04
Area P< 0.001 P< 0.001 P< 0.001 P= 0.95
Urban 4.2 1.00 1.00 3.7 1.00 1.00
Rural 0.9 0.22 0.30 0.9 0.25 0.98
Family income P< 0.001b P< 0.01b P< 0.001b P< 0.001b
1st quartile 2.1 1.00 1.00 0.3 1.00 1.00
2nd quartile 2.5 1.15 0.83 1.2 3.71 3.02
3rd quartile 2.5 1.19 0.66 3.0 9.22 6.09
4th quartile 7.2 3.55 1.44 8.2 27.00 14.62
Education P< 0.001b P< 0.001b P< 0.001b P< 0.001b
1st quartile 1.7 1.00 1.00 0.7 1.00 1.00
2nd quartile 2.2 1.34 1.43 2.5 3.57 2.27
3rd quartile 3.4 2.07 2.15 3.5 5.17 3.47
4th quartile 6.9 4.39 3.67 6.1 9.26 3.78
sonable representativeness can be ex-pected since the two regions have 70% of the country’s total population. In ad-dition, the three regions not included in the sample (North, South, and West) have values of per capita gross domes-tic product that are between the ex-treme low and high values found in the Northeast and Southeast regions, re-spectively (29).
The LSMS survey questions on physical activity were very simple and well accepted by the studied individu-als, with a response rate of 100% for these questions. This speaks in favor of the internal validity of the instrument that we used to assess LTPA. There-fore, we doubt that there was a heavy bias in our estimates due to not di-rectly measuring physical activity. It is worth mentioning that a physi-cal activity rephysi-call questionnaire of much higher complexity, the Interna-tional Physical Activity Questionnaire, showed high reliability and validity when applied to adult Brazilians (30). The major limitation of this study, or, to be more precise, the major limita-tion to correctly interpreting the study findings, was not including in the LSMS an assessment of physical activities other than those performed during leisure time, especially ones related to commuting and work. Of course, in-dividuals involved in high-energy-expenditure occupations and/or who must walk long distances from home to work should not be classified as seden-tary people simply because they do not engage in physical activity during their leisure time. In 1997 approximately 60% of all Brazilian adults were economi-cally active and, among them, 30% were working in occupations likely to require high energy expenditures such as ag-riculture (24%) and construction (6%) (29). That is, assessments of active or sedentary lifestyles that ignore physical activity during work could possibly erroneously classify almost 20% of the adult population of Brazil as being sedentary. It is clear that any future population-based study on physical ac-tivity in Brazil should assess both leisure-time physical activities as well as physical activities done during work and commuting.
It is difficult to compare our results with those from other population-based studies describing the epidemi-ology of LTPA due to the scarcity of studies, particularly in developing countries, as well as the frequent dif-ferences in the methods used to assess physical activity.
A population-based survey done in the city of Rio de Janeiro in 1996—the same period as our study—also re-ported a very low prevalence of LTPA (26). That survey reported that ap-proximately 75% of the adult popula-tion of Rio de Janeiro never or almost never did any type of physical activity during their leisure time, which is close to our estimate of 87% of indi-viduals not performing a minimum of 30 minutes of physical activity at least one day per week. The survey in Rio de Janeiro also showed that nearly 10% of the adults there said they regu-larly engaged in physical activity dur-ing their leisure time; that figure is midway between our study’s estimate for LTPA done at least one day per week (13.0%) and LPTA done at least 3 days per week (6.3%). The survey conducted in Rio de Janeiro identified other important characteristics that re-inforced the high level of sedentary lifestyles in that population, including: (a) occupations with moderate to high energy expenditure requirements were reported by fewer than 20% of the men and fewer than 5% of the women, (b) approximately 60% of the men and 80% of the women with occupations needing low energy expenditures (or who were not engaged in the labor force) did not perform exercise/sports during leisure time, and (c) the adults reported spending an average of 3 to 4 hours per day watching television or using a computer.
The survey conducted in Rio de Janeiro found that young men were more active than young women (26). This difference tended to disappear after 40 years of age due to a pro-nounced decline in physical activity among men, a finding similar to what we observed in our survey of Brazil. Also as in our study, in Rio de Janeiro having more education was strongly associated with LTPA.
The prevalence of physical activity during leisure time seems much lower in Brazil than in developed countries. The proportion of Brazilian adults not engaging in LTPA (87%) appears to be two to three times as high as the fig-ures reported for the United States of America and European countries (19, 31). Adults in Brazil who perform exercise/sports 5 or more days per week (3.3%) represent about one tenth of what is described for those devel-oped countries (19, 31). However, the demographic and socioeconomic dis-tribution of LTPA in Brazil appears to have similarities to the patterns de-scribed for developed societies, where men tend to be more active than women, increasing age limits LTPA, and higher socioeconomic status is as-sociated with LTPA (19, 31).
1. Pate RR, Pratt M, Blair SN, Haskell WL, Macera CA, Bouchard C, et al. Physical activ-ity and public health: a recommendation from the Centers for Disease Control and the Amer-ican College of Sports Medicine. JAMA 1995; 273:402–407.
2. United States of America, Department of Health and Human Services. Physical activity and health: a report of the Surgeon General. Atlanta, Georgia: National Center for Chronic Disease Prevention and Health Promotion; 1996.
3. Vuori IM. Health benefits of physical activity with special reference to interaction with diet. Public Health Nutr 2001;4(2B):517–528. 4. Hahn RA, Teustsch SM, Rothenberg RB,
Marks JS. Excess deaths from nine chronic diseases in the United States, 1986. JAMA 1990;264:2654–2659.
5. Powell KE, Blair SN. The public health bur-dens of sedentary living habits: theoretical but realistic estimates. Med Sci Sports Exerc 1994; 26:851–856.
6. Haskell WL. Health consequences of physical activity: understanding and challenges re-garding dose-response. Med Sci Sports Exerc 1994;26:649–660.
7. Matsudo V, Matsudo S, Andrade D, Araujo T, Andrade E, de Oliveira LC, et al. Promotion of physical activity in a developing country: the Agita São Paulo experience. Public Health Nutr 2002;5:253–261.
8. Manson JE, Hu FB, Rich-Edwards JW, Colditz GA, Stampfer MJ, Willet WC, et al. A prospec-tive study of walking as compared with vig-orous exercise in the prevention of coronary heart disease in women. N Engl J Med 1999; 341:650–658.
9. Andersen LB, Schnohr P, Schroll M, Hein HO. All-cause mortality associated with physical activity during leisure time, work, sports, and cycling to work. Arch Intern Med 2000;160: 1621–1628.
10. Ellekjaer H, Holmen J, Ellekjaer E, Vatten L. Physical activity and stroke mortality in women. Ten-year follow-up of the Nord-Trondelag health survey, 1984–1986. Stroke 2000;31:14–18
11. Lee IM, Rexrode KM, Cook NR, Manson JE, Buring JE. Physical activity and coronary heart disease in women: is “no pain, no gain” passé? JAMA 2001;285:1447–1454.
12. Wagner A, Simon C, Evans A, Ferrieres J, Montaye M, Ducimetiere P, et al. Physical ac-tivity and coronary event incidence in North-ern Ireland and France: the Prospective Epi-demiological Study of Myocardial Infarction (PRIME). Circulation 2002;105:2247–2252. 13. Sacco RL, Gan R, Boden-Albala B, Lin IF,
Kargman DE, Hauser WA, et al. Leisure-time physical activity and ischemic stroke risk: the Northern Manhattan Stroke Study. Stroke 1998;29:380–387.
14. Leon AS, Myers MJ, Connett J. Leisure time physical activity and the 16-year risks of mor-tality from coronary heart disease and all-causes in the Multiple Risk Factor Interven-tion Trial (MRFIT). Int J Sports Med 1997;18: S208–S215.
15. Pereira MA, Kriska AM, Day RD, Cauley JA, LaPorte RE, Kuller LH. A randomized walk-ing trial in postmenopausal women: effects on physical activity and health 10 years later. Arch Intern Med 1998;158:1695–1701. 16. James WPT. A public health approach to the
problem of obesity. Int J Obesity 1995;19:S37– S45.
17. Blair SN, Booth M, Gyarfas I, Iwane H, Marti B, Matsudo V, et al. Development of public policy and physical activity initiatives inter-nationally. Sports Med 1996;21(3):157–163. 18. Kriska AM, Caspersen CJ. Introduction to a
collection of physical activity questionnaires. Res Q Exerc Sport. 1997;71:S47–S52. 19. Schoenborn CA, Barnes PM. Leisure-time
physical activity among adults: United States, 1997–1998. Hyattsville, Maryland: National Center for Health Statistics; 2002. (Advanced Data from Vital and Health Statistics, no. 325). 20. Stephens T, Caspersen CJ. The demography of physical activity. In: Bouchard C, Shephard RJ, eds. Physical activity, fitness, and health: international proceedings and consensus statement. Champaign, Illinois, United States: Human Kinetics; 1994. Pp. 204–213. 21. Centers for Disease Control and Prevention.
Physical activity trends — United States, 1990–1998. MMWR 2001;50(9):166–169. 22. Pratt M, Macera CA, Blanton C. Levels of
physical activity and inactivity in children and adults in the United States: current evi-dence and research issues. Med Sci Sports Exerc 1999;31(11 Suppl):S526–S533.
23. Stephens T, Jacobs D, White C. A descriptive epidemiology of leisure-time physical activ-ity. Public Health Rep 1985;100:147–158. 24. Evenson KR, Rosamond WD, Cai J,
Diez-Roux AV, Brancati FL. Influence of retirement on leisure-time physical activity: the Athero-sclerosis Risk in Communities Study. Am J Epidemiol 2002;155:692–699.
25. Da Silva RC, Malina RM. Nível de atividade física em adolescentes do Município de Niterói, Rio de Janeiro, Brasil. Cad Saude Pub-lica 2000;16:1091–1097.
26. Gomes VB, Siqueira KS, Sichieri R. Atividade física em uma amostra probabilística da pop-ulação do Município do Rio de Janeiro. Cad Saude Publica 2001;17(4):969–976.
27. Kirkwood BT. Essentials of medical statistics. London: Blackwell Scientific Publications; 1988.
28. Stata Corp. Stata statistical software: release 5.0. College Station, Texas, United States: Stata Corporation; 1997.
29. Brasil, Instituto Brasileiro de Geografia e Es-tatística. Síntese de indicadores sociais, 1998. Rio de Janeiro: IBGE; 1999.
30. Matsudo S, Araújo T, Matsudo V, Andrade D, Andrade E, Oliveira L, et al. Questionário Internacional de Atividade Física (IPAQ): es-tudo de validade e reprodutibilidade no Brasil. Rev Bras Ativ Fis Saude 2001;6(2):5–18. 31. Martinez-Gonzalez MA, Varo JJ, Santos JL, De Irala J, Gibney M, Kearney J, et al. Prevalence of physical activity during leisure time in the European Union. Med Sci Sports Exerc 2001; 33:1142–1146.
32. Brundtland GH. Address by Dr Gro Harlem Brundtland Director-General to the Fifty-Fifth World Health Assembly, Geneva, Monday, 13 May 2002. Geneva: World Health Organiza-tion; 2002.
33. Matsudo SM, Matsudo VR, Araujo TL, An-drade DR, AnAn-drade EL, Oliveira LC de, et al. The Agita São Paulo program as a model for using physical activity to promote health. Rev Panam Salud Publica 2003;14(4):265–272.
Manuscript received 27 November 2002. Revised version accepted for publication on 19 March 2003.
Objetivos. Describir la prevalencia, frecuencia, tipo, motivación y distribución de-mográfica y socioeconómica de la actividad física en horas libres (AFHL) entre adul-tos en el Brasil.
Métodos. La fuente de datos para nuestro estudio fue la Encuesta para la Medición del Nivel de Vida (EMNV) en el Brasil, que se llevó a cabo en 1996 y 1997. Mediante esta encuesta se estudió una muestra probabilística multietápica y estratificada de 4 893 hogares que abarcó a 11 033 personas de 20 años de edad o mayores. Los hoga-res encuestados se seleccionaron en la dos regiones más pobladas del Brasil, el Noroeste y el Sureste, donde viven 70% de todos los habitantes del Brasil. Las per-sonas seleccionadas contestaron una serie de preguntas acerca de sus actividades físi-cas en horas libres.
Resultados. Sólo 13% de los brasileños encuestados indicaron que hacían un mín-imo de 30 minutos de AFHL un día de la semana o más, y únicamente 3,3% indicó que lo hacía como mínimo 30 minutos durante 5 días de la semana o más, que es la cantidad recomendada. Entre las personas más jóvenes se encontró que los hombres eran más activos que las mujeres. No obstante, esta diferencia descendió notable-mente a medida que aumentó la edad, de tal manera que en el grupo de 40 a 45 años la prevalencia de AFHL era igualmente baja en ambos sexos. Los hombres indicaron que participaban en deportes en equipo, mientras que las mujeres dijeron que partic-ipaban en actividades tales como caminar o trotar (jogging), pero estas últimas fueron las actividades más comunes en ambos sexos en aquellos casos en que la actividad física se practicaba 5 días a la semana o más. El recreo fue, con mucho, la razón que los hombres citaron con mayor frecuencia para explicar por qué practicaban AFHL, mientras que el recreo, la salud y hasta razones estéticas fueron citados como aspec-tos importantes por las mujeres. En ambos sexos la salud fue un motivo más impor-tante entre las personas que practicaban alguna actividad física durante un mayor número de días a la semana. También se observó en ambos sexos un aumento de la frecuencia de AFHL conforme aumentaba la edad, con una mayor tendencia a cami-nar o a trotar que a practicar deportes y con una mayor preocupación por la salud que por el recreo. Tanto entre los hombres como entre las mujeres se observó una fuerte asociación entre la AFHL y el estado socioeconómico, medido ya sea en términos de ingresos o de escolaridad, independientemente de la edad, la religión, o la residencia en una zona urbana o rural.
Conclusiones. La prevalencia de AFHL en la población adulta del Brasil fue mucho más baja que la notificada en países en desarrollo. Sin embargo, la distribución de-mográfica y social de la AFHL en el Brasil tuvo un patrón similar al observado habit-ualmente en países desarrollados, donde los hombres tienden a ser más activos que las mujeres, la mayor edad limita la AFHL, y un mayor nivel socioeconómico se aso-cia con más AFHL. Nuestros datos servirán de base para evaluar los efectos de la AFHL de “Agita Brasil” (“Muévete, Brasil”), iniciativa en pro de la actividad física que se puso en marcha en el país después de 1997.
RESUMEN