i
GIS CAPACITY BUILDING FOR RISK MANAGEMENT TO HELP
DEVELOPING COUNTRIES.
Case of climate change problem in Amhara rural region (Ethiopia)
ii
GIS CAPACITY BUILDING FOR RISK MANAGEMENT TO HELP
DEVELOPING COUNTRIES
Case of climate change problem in Amhara rural region (Ethiopia)
Dissertation supervised by
Prof. Dr. Joaquin Huerta Department of Information Systems,
Universitat Jaume I (UJI) Castellon, Spain.
Co-supervisors
Prof. Dr. Marco Painho
Instituto Superior de Estatística e Gestão de Informação (ISEGI) Universidade Nova de Lisboa,
Lisbon, Portugal. &
MSc. Mr. Pau Aragó
Department of Information Systems, Universitat Jaume I (UJI)
Castellon, Spain.
iii
ACKNOWLEDGMENTS
I am very grateful to the European Commission and the Erasmus Mundus Consortium (Westfälische Wilhelms-Universität Münster, Germany; Universitat Jaume I Castelló, Spain and Universidade Nova de Lisboa, Portugal) for giving me the great opportunity to undertake this course, making my studies and stay as comfortable as they were during these eighteen months. Many thanks to the staff of the three partner universities for ensuring a smooth run of the entire program.
I would like to thank my supervisor Prof. Dr. Joaquin Huerta for giving me the idea to start this work and the opportunity to live an amazing experience in Ethiopia during my thesis research period. I am pleased to extend my gratitude to my co-supervisor Prof. Dr. Marco Painho for sharing his knowledge and valuable advice both during my semester in Lisbon and my thesis work, and also to Pau Aragó for his kind support and useful suggestions to bring the research into shape in the last months.
I am also grateful to Prof. Dr. Michael Gould for his ideas and feedback in the last stage of my work.
I am thankful to the UJI‟s Instituto Interuniversitario de Desarrollo Local and the Bahir Dar University team in Ethiopia for counting on me in this challenging work and sharing their thoughts with me, from which I learnt a lot.
My gratitude goes to my classmates for sharing their knowledge and giving me support during this time away from home. It has been a wonderful experience where we all have become good friends.
iv
GIS CAPACITY BUILDING FOR RISK MANAGEMENT TO HELP
DEVELOPING COUNTRIES
Case of climate change problem in Amhara rural region (Ethiopia)
ABSTRACT
v
KEYWORDS
Developing countries
Climate change
Risk management
Food insecurity
Cooperation
Training
Capacity building
Ethiopia
Spatial Data Infrastructures
Open Source technologies
Geographical Information Systems
vi
ACRONYMS
AECID– Agencia Española de Cooperación Internacional para el Desarrollo
BDU– Bahir Dar University
CAD – Computer-Aided Design
CAES– College of Agriculture & Environmental Sciences
CCA – Climate Change Adaptation
CBDRR– Community Based Disaster Risk Reduction
DEM– Digital Elevation Model
DRMSD – Disaster Risk Management and Sustainable Development
DRR– Disaster Risk Reduction
ERCS– Ethiopian Red Cross Society
FAO – Food and Agriculture Organization
FOSS– Free Open Source Software
FSF – Free Software Foundation
GHI– Global Hunger Index
GI– Geographical Information
GIS– Geographical Information Systems
GPL– General Public License
GPS– Global Positioning System
ICT - Information and Communications Technology
IIDL– Institut Interuniversitari de Desenvolupament Local
LC – Land Cover
NGOs– Non-Governmental Organizations
NSDI – National Spatial Data Infrastructures
OGC– Open Geospatial Consortium
OS– Open Source
vii RCRC – Red Cross/Red Crescent
SDI – Spatial Data Infrastrutures
UJI– Universitat Jaume I
UN-ISDR – United Nations - International Strategy for Disaster Reduction
VCA– Vulnerability and Capacity Assessment WCS –Web Coverage Service
WFS –Web Feature Service
viii
INDEX OF THE TEXT
Page no.
ACKNOWLEDGMENTS ... iii
ABSTRACT ...iv
KEYWORDS ... v
ACRONYMS ...vi
INDEX OF THE TEXT ... viii
INDEX OF TABLES ... x
INDEX OF FIGURES ... xi
1 INTRODUCTION ... 1
1.1 Problem definition ... 2
1.2 Motivation and rationale ... 2
1.2.1 Relationship with IIDL and BDU ... 3
1.2.2 Relationship with RC/RC Climate Centre and ERCS ... 3
1.2.3 Background and study area ... 4
1.3 Aim and objectives ... 9
1.4 Thesis structure ... 11
2 HUMANITARIAN COOPERATION AND RISK ASSESSMENT... 12
2.1 Inter-university Cooperation Program ... 12
2.2 Disaster and risk management ... 14
3 METHODOLOGY AND WORK PLAN ... 18
3.1 Analysis of GIS situation ... 20
3.2 GIS Action Plan ... 23
3.3 GIS laboratory at BDU ... 24
3.3.1 Hardware ... 25
3.3.2 Software ... 26
3.3.3 Capacity building ... 33
3.4 Data ... 40
3.4.1 Data availability ... 40
3.4.2 Data collection ... 41
3.5 Risk Mapping: Soil erosion Use Case ... 43
3.6 Spatial Data Infrastructure ... 51
ix
3.6.2 SDI establishment at BDU ... 54
4 DISCUSSION, RECOMMENDATIONS AND FURTHER WORK. ... 62
5 CONCLUSIONS ... 66
BIBLIOGRAPHIC REFERENCES ... 69
APPENDICES ... 72
Appendix A: GIS seminar at Bahir Dar University ... 72
Appendix B: GIS seminar advertisement and certificate of completion ... 93
Appendix C: Workplan ... 95
Appendix D: In the News ... 96
Appendix E: GIS software comparison by License, source & operating system support .. 97
Appendix F: comparison of the principal FOS Desktop GIS projects ... 98
Appendix G: Field Pictures (agricultural and pastoral practices) ... 99
x
INDEX OF TABLES
Table 1. SWOT matrix for GIS capaciti building project) ... 19 Table 2. Differences between proprietary and FOS software (Weis 2006)... 27 Table 3. Evaluation of gvSIG project and comparison with GRASS
xi
INDEX OF FIGURES
Figure 1. Global Map of Hunger Index of 2011 (IFPRI)... 5
Figure 2. Map of regions in Ethiopia Types of geospatial software used in a SDI... 7
Figure 3: Map of woredas (districts) in the region of Amhara ... 8
Figure 4. Average monthly rainfall in Ebinat woreda (2002-2008)...8
Figure 5. Disaster management diagram (IFRCRCS)...15
Figure 6. Flowchart diagram. GIS plan process (SmartDraw)... ....19
Figure 7. Facilities in the GIS current lab at BDU (personal pictures)...24
Figure 8. Delivery of technical equipment from UJI to BDU team, Bahir Dar. (personalictures)...26
Figure 9. gvSIG official site for the Community (www.gvsig.org)...33
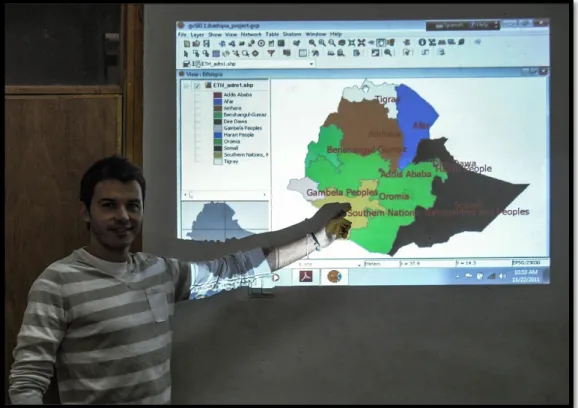
Figure 10. Visual analysis with gvSIG during GIS workshop. BDU. November 2011... 37
Figure 11. Google Earth screenshot during GIS capacity building action...37
Figure 12. GIS capacity building and equipment provision to BDU team (BDU, November 2011)...38
Figure 13. GPS data collection training schema. (NYS GIS Strategic Plan 2008)...39
Figure 14. Strategy selection exercise at Fogera rural community. (DDR/CCA training, January 2012)...43
Figure 15. Selected woredas over the LC map of Amhara region... 45
Figure 16 Land Cover Classification ...46
Figure 17: LC map clipped with the selected woredas...46
Figure 18. Visualization of the cultivated areas...47
Figure 19. Digital Elevation Model for the north region of Ethiopia...48
Figure 20. Slopes map of the region. ...49
Figure 21 Slope map within the area of interest...49
Figure 22. Participants during a training DRR/CCA workshop in Fogera (January 2012, tablet pictures)...50
Figure 23Types of geospatial software used in a SDI...55
Figure 24Map creation within the GeoCommons interface...58
Figure 25. Metadata creation within the GeoCommons interface...58
1
1
INTRODUCTION
Agriculture has always been the source of subsistence for Ethiopian people and is the backbone of the national economy, employing most of the population. However, due to the poor, traditional and backward agricultural performance, millions of people still face food shortage, famine and malnutrition.
Most parts of Ethiopia suffer also from natural resources degradation that adversely affected food and agricultural productivity. In the Ethiopian rural region of Amhara, where this research is focused, the variable atmospheric conditions and are particularly affecting the local agriculture system and the consequences might be irreversible. To feed a fast growing population, agricultural productivity increase is highly required through the combination of scientific knowledge with traditional know-how. In that sense, technological advances can be nowadays more and more helpful although they highly depend on research and research in turn depends on training and education. Training is the key to the whole process and hence, it takes up a large part of the work presented. (BDU, 2010)
Red Cross Climate Center organization and Bahir Dar University are working in the affected area focusing in a farmer to farmer learning model in order to promote the farmers adaptation to climate change.
The work described in this thesis is just a small part of a major cooperation project where various stakeholders are involved. Red Cross Climate Center organization, Bahir Dar University and Universitat Jaume I are collaborating with the common goal to improve that situation. Our challenge is to analyze how local organizations can use and benefit of GIS technologies for disaster management, food security and related issues.
2
1.1
P
ROBLEM DEFINITIONIn Ethiopia, chronic food insecurity affects 44% of the population, according to the estimates for 2006 there were 35 million undernourished people (FAO, 2009). With more than 80% of the population living in rural areas (Central Statistical Agency of Ethiopia, 2008), entailing high structural food insecurity, Ethiopia has strong agricultural potential. However, the Plan for Accelerated and Sustained Development to End Poverty of the Ministry of Finance and Economic Development emphasizes that although productivity has increased in recent years, production is still well below the desired level.
Recurrent drought, degradation of natural resources and rapid population growth are among the main causes of declining per capita food production (FAO, 2006). The northern rural region of Amhara is not an exception to the problem, and several international and local organizations are working to improve the situation in that area.
Given the potential of geospatial technologies to monitor analysis and manage spatial data, the question that arises is how those kind of technologies can help on improving such a situation. In order to start an analysis of the needs and integrate GIS technologies on this process spatial data are needed. However, the lack of data related to risks and food security in Ethiopia is one of the greatest handicaps today. Thus, the collection of data is an important task of this project. On that purpose, a technical training needs to be developed with the local team as target, having in mind that they are specialist in risk management, but they are not in the use of GIS technologies and tools. The establishment of a GIS laboratory that involves the participation of people at risk may be the starting point of a big revolution.
1.2
M
OTIVATION AND RATIONALEIn the election of the present study several aspects have been taken into account:
The practical application of knowledge acquired in the academic phase of the Master, especially in subjects related to GIS Applications, Digital Cartography, Remote Sensing or Computer Science.
3 The topic of the research, which belongs to the student's interest field in which
he would like to focus his future career.
The existing synergy within the Universitat Jaume I (UJI), that permitted the collaboration between different departments.
1.2.1
Relationship with IIDL and BDU
This work is a collaboration between various actors: in one hand, the Institute of New Imaging Technologies and the Local Development Interuniversity Institute (IIDL), both belonging to UJI; on the other hand, the Bahir Dar University (BDU). This partnership has been possible through an Inter-university Cooperation Program (PCI) which is funded by the Agencia Española de Cooperación Internacional para el Desarrollo (AECID) and also assisted by the UJI International Cooperation Program.
Taking advantage of the existing synergies within the UJI, a collaboration with the IIDL was set up. This Institute was already working on a big cooperation project in the same area of action than ours, with the objective of reducing the food insecurity in the north regions of Ethiopia. The project title is: Strengthening the Centre for Research and Community Service in Disaster Risk Management to improve food security and agricultural productivity in the Amhara Regional State, Ethiopia. It is composed by four different activities, as it is explained in the next section. One of those activities is the training of local staff in the GIS field. That was the main reason to decide to join efforts and work together, helping them in the GIS activity that should be developed.
1.2.2
Relationship with RC/RC Climate Centre and ERCS
The Red Cross/Red Crescent (RC/RC) Climate Centre, with basis in the Netherlands, was established in 2002 to develop tools and strategies to integrate the new challenges and opportunities presented by climate change into the humanitarian work of the RC/RC. Its aim is to reduce the vulnerability of people to the impacts of climate change and extreme weather events. (Qadir, 2009)
4
issue of how to include GIS capabilities in the humanitarian processes in order to improve the decision making and therefore reduce the risks related with climate issues. P. Suarez‟s work as researcher and consultant focuses on the integration of climate information into decision making for reducing vulnerability in Africa, and he is also in charge of the coordination of audiovisual work and projects in North and East Africa, where Ethiopia is located.
Both UJI and RC/RC began to think of ideas and actions willing to help to improve the situation from a technological point of view. Several videoconference meetings were held and some guidelines regarding the type of actions to take were decided. Taking into account the small amount of economic resources available and the fact that various organizations will participate in the project, the idea of using free open source software came out for the first time.
In this regard, as a link with the UJI team in the study area will act, together with the BDU, the Ethiopian Red Cross Society (ERCS). The ERCS was established by government decree in 1935, after the second Ethio-Italian war, beginning its involvement in humanitarian services. Today, the ERCS has 11 regional offices, 27 zone branches, 50 woreda branches and over 1500 kebeles all over the country. This network enables the national society to run activities and deliver services at all levels.
The clear understanding of local realities and needs by the ERCS permits to develop relevant programmes that have real impact on the communities. The ERCS manages and implements four core programs; being the Food Security & Disaster Preparedness/Response the more related with the present research work.A change in climatic conditions as a result of environmental degradation has proven to have a humanitarian impact on food security, access to clean water, increased vulnerability to diseases and shelter. Hence, the ERCS realizes the necessity and importance of disaster preparedness and response in times of natural catastrophes (ERCS website).
1.2.3
Background and study area
5 Figure 1. Global Map of Hunger Index of 2011 (IFPRI )
The International Food Policy Research Institute (IFPRI) has recently published the Global Map of Hunger Index of 2011, shown in Figure 4 above. The GHI is based on three indicators: the proportion of undernourished population; the prevalence of underweight in children; the under-five mortality rate. Ethiopia occupies the position 77 out of 81 being in an “alarming” situation and it is, indeed, the world‟s most food aid dependent country (Clay et al., 1998).
Administrative divisions
Ethiopia is divided into 9 ethnically-based administrative regions (kililoch) or Regional States. The kililoch are subdivided in 68 zones. These zones are subdivided in around 550 woredas. A woreda is equivalent to a district, managed by a local government. The woredas are composed of a number of kebele, the smallest unit of local government (neighbourhoods).
Geography and climate
6
generally southwest to northeast and is surrounded by lowlands, steppes, or semi-desert. The great diversity of terrain determines wide variations in climate, soils, natural vegetation, and settlement patterns (Qadir , 2009).
Ethiopian climate varies according to the different topographical regions. The central plateau has a moderate climate with minimal seasonal temperature variation. The mean minimum during the coldest season is 6° C, while the mean maximum rarely exceeds 26° C. Temperature variations in the lowlands are much greater, and the heat in the desert and Red Sea coastal areas is extreme. Heavy rainfall occurs in most of the country during June, July, and August. The High Plateau also experiences a second, much milder, rainy season between December and February. Average annual precipitation on the central plateau is roughly 122 cm and it decreases in the northern provinces. Severe droughts affected the country in 1982–84, 1987–88, and 1991. (Encyclopedia of the Nations, 2011). To those, we can add the current drought of 2011, considered the worst in the last sixty years (Reuters, 2011).
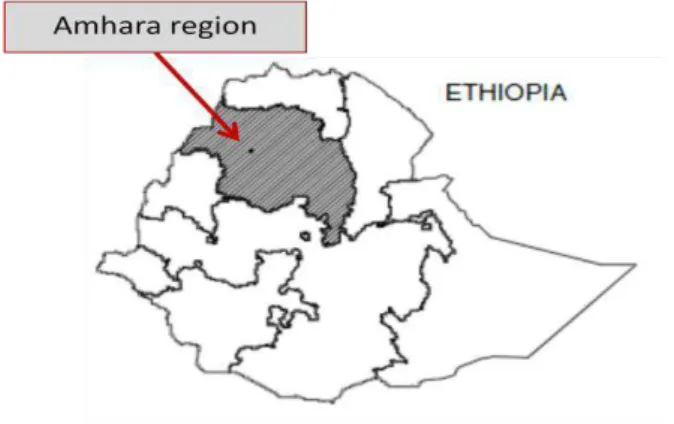
Amhara region
The Amhara region is one of the nine ethnically-based administrative regions of Ethiopia and is located in the north western and north central part of the country. It covers an area of about 170,000 square kilometres and has a population of about 17.2 million (according to the 2007 census). The region is very poor with standard of living indicators that are quite low. Only 28% of the population has access to potable water, 17.5% of the inhabitants fall into the lowest wealth quintile and the infant mortality rate is extremely high.
The Amhara Region has very complex terrain with altitude ranges from under 500 to 4620 meters above sea level. About 25% of the region comprises the northwestern lowlands, the vast stretch of lower river valleys and deep gorges with altitude ranges from 500-1500 meters above sea level. More than 50% of the region constitutes the mid highlands areas between 1500-2500 meters above sea level. The remaining 25% are the extensive high plateaus and mountains (2500-4620 meters altitude). Most rivers and streams originate from these highlands and drain most areas of the region.
7
30ºC and mean annual rainfall ranges from 400-900 mm. Areas between 1501-2500 meters altitude are cooler sub-temperate areas with mean annual temperature ranging from 16-21ºC and mean annual rainfall ranges from 1000-1600 mm. Areas above 2500, are even cooler with mean annual temperatures ranging from 7-15ºC and have an on average above 1200 mm annually (Qadir, 2009).
Drought and seasonal flood are the main hazards which affect hundreds of thousands of people living in the middle and lower courses of the rivers as well as around Lake Tana in this region.
Figure 2. Map of regions in Ethiopia.
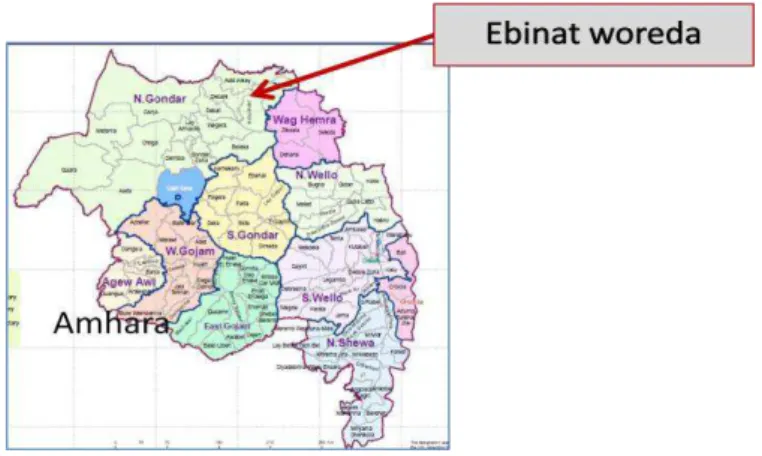
Ebinat woreda
8 Figure 3. Map of woredas (districts) in the region of Amhara.
The figure below shows average precipitation based on station data collected from the National Meteorological Services Agency (NMSA). However, a very short data record was available and therefore this graph is not very representative.
Figure 4. Average monthly rainfall in Ebinat woreda (2002-2008).
Fogera woreda
9
animal diseases are other disastrous events. The major causes of floods in the area are overflow of Rib river and increase in the water level of Lake Tana. Fogera was heavily affected by the floods in the past two decades caused by the overflowing of Lake Tana.
Future impacts
It is estimated that the temperature has been increasing annually at the rate of 0.2°C over the past five decades. This has led to a decline in agricultural production and biodiversity, shortage of food and increases in human health problems, rural-urban migration and dependency on external support. Factors compounding the impact of climate change in Ethiopia are rapid population growth, land degradation, widespread poverty, dependency on rained agriculture, lack of awareness by policy and decision-makers about climate change and lack of appropriate policies and legislation. (Qadir, 2009)
1.3
A
IM AND OBJECTIVESTo address the above mentioned problem, the overall goal of the thesis is to reduce the risk of climate change-induced disasters and food insecurity by optimizing the awareness and utilization of geospatial data in a proper way by the local community. Therefore contribute to the development of the rural areas in the Ethiopian region of Amhara by promoting the use of GIS technologies in order to help to increase agricultural productivity.
To achieve this goal, the following specific objectives have been formulated. Related to GIS:
Analysis the gaps and constraints to effectively utilizing data and information within a GIS to inform decision-making, defining the specific conditions and needs in the region.
10 Contribute to increase the awareness of the available geographical and map
information among the local community in the region of Amhara.
Lead training courses/workshops of GIS software at BDU so that they can manage the geographical information in a better way, improve their knowledge on this field and spread it to other actors, with the aim that the applications of GIS competencies could be useful for facing food security issue.
To promote the creation of a future joint teaching e-learning program on GIS and food security.
Help to implement a simple Spatial Data Infrastructure with the existing data in the region in order to improve the access to them, using Open Source technologies as a priority.
To support BDU in the introduction of activities for rural community development, such as hazard/vulnerability mapping and data collection to promote food security in the Amhara Region, with the participation of local representatives (small farmers and associations) who will act as multipliers in their communities.
At the same time, other objectives are tangential to GIS:
Strengthen BDU‟s Centre for Research and Community Service in Disaster Risk Management
Help in the integration of humanitarian issues into the work of the GIS team at BDU by strenghten the collaboration between them and the ERCS.
Contribute to the development of the region of Amhara, making geo-information work for the local development by helping decision making.
11
1.4
T
HESIS STRUCTUREThe thesis structure is divided into five main chapters. The present chapter explains the problem faced and the objectives of the research work. The rest of the thesis is arranged as follows:
Chapter 2 is allocated to describe the Inter-universitary Cooperation Project being held and the relationship of the different actors involved on the project. Some background and literature review about Risk Management is described as well.
Chapter 3 starts analysing the current situation regarding GIS in the study area and then illustrates the methodology used to improve the weak points, with focus on the establishment of a GIS laboratory at the Bahir Dar University. The necessary steps followed to achieve this goal are described, starting with the required equipment, the choice of a specific GIS application, briefly reviewing various existing GIS software, and following by the development of the GIS training. Straight after, the spatial data availability and data collection is described, continuing with the explanation of a real use case that has been carried out. Finally, this chapter shows the further step of implementing a SDI to optimize the data access, giving some definitions and principles on that.
Chapter 4 presents a discussion about the whole process and findings, giving recommendations for future work. Chapter 5 concludes the research work by discussing whether the objectives have been accomplished or not.
12
2
HUMANITARIAN COOPERATION AND RISK
ASSESSMENT
In order to address the problem properly a literature review process has been carried out and a background description of both humanitarian and technical aspects of big relevance for the present study are given next.
2.1
I
NTER-
UNIVERSITYC
OOPERATIONP
ROGRAMAs stated, the present Master research is part of a major cooperation project held by the IIDL, attached to UJI. This Institute is working on a Inter-university Cooperation Program (PCI) that includes four main activities, being one of those the GIS training of the local staff at BDU in Ethiopia. In the next paragraph, the PCI is described.
According to The Food Insecurity in the World report by FAO there is still a long way to go to achieve the second aim of the first Millennium Development Goal of halving the percentage of people suffering from hunger between 1990 and 2015.
The collectives in situation of structural vulnerability include, among others, small farmers and agricultural workers, a significant fact for an essentially rural country such as Ethiopia. In view of this situation and the experience acquired with a previous PCI in 2009, the College of Agriculture & Environmental Sciences (CAES) at BDU and the IIDL at UJI, organized a participatory workshop at BDU (June 2010) to continue working together, by means of a new PCI.
The general objective established for the PCI is to contribute to improve food security and agricultural productivity in the Amhara Region by strengthening BDU‟s Centre for Research and Community Service in Disaster Risk Management, promoting its competences in teaching, research and university extension, with the aim to consolidate a joint BDU/UJI academic group on local risk management.
13
of various departments from the two universities and with a group of specialists in the different areas.
Regarding schedule, a four year intervention has been planned (2011-2014) starting with teacher training, the introduction of activities and the acquisition of equipment required to achieve the objectives. The PCI work plan is organised around four Work Groups corresponding to each of the activities:
Work Group 1. Research to increase agricultural production.
Work Group 2. GIS capacity building.
Work Group 3. Training and advice to community bodies (local level).
Work Group 4. Networking with development actors.
Work Group 5. Gender mainstreaming
The Activity 2, GIS capacity building, is actually the bulk of this thesis research. This activity includes the following actions:
- Periodical workshop on GIS at BDU for teachers and students from the CAES, increasing in complexity every year.
- Training visits to UJI: a teacher from BDU‟s Department of Risk Management and Development visits UJI each year.
- Acquisition of GIS equipment and technologies for the laboratory.
- E-learning seminar on GIS and food security, whose beneficiaries will be the students from BDU's Master‟s Degree in Disaster Risk Management and Development and possibly UJI students as well.
14
As a parallel fact, and in response to the growing need to build disaster-resilient communities, it has been established a postgraduate program in Disaster Risk Science and Sustainable Development (DRSSD) at BDU that includes the institutionalisation of risk management as the key to minimising the vulnerability of people living in low productivity agricultural areas. In addition, there is a plan to promote the use of Information and Communications Technology (ICT) for e-learning, research and knowledge dissemination and exchange, in order to boost the Centre capacity to offer support services to community representatives and risk management specialists.
2.2
D
ISASTER AND RISK MANAGEMENTThe RC/RC National Societies work with communities to reduce risk, mitigate the effects of, prepare to respond, respond to and recover from disasters.
Disaster Management can be defined as the organization and management of resources and responsibilities for dealing with all humanitarian aspects of emergencies, in particular preparedness, response and recovery in order to lessen the impact of disasters (IFRC, 2010).
The first people to respond to a disaster are those living in the local community. The RC/RC National Societies therefore focus on community-based disaster preparedness, which assists communities to reduce their vulnerability to disasters and strengthen their capacities to resist them.
15 Figure 5. Disaster management diagram (International Federation of Red Cross and Red Crescent
Societies)
Assessing Risk, Hazard and Vulnerability
The risk assessment is a methodology to determine the nature and extent of a risk by analysing potential hazards and evaluating existing vulnerabilities that could pose a potential threat or harm to people, property, livelihoods and the environment on which they depend (UN/ISDR, 2004). Risk assessments typically include physical, social, economic and environmental factors and consequences.
Hazard and vulnerability assessments utilize formal procedures that include the collection of primary data, monitoring of hazard and vulnerability factors, data processing, mapping and social survey techniques.
Hazard assessments aim to identify the probability of the occurrence of potentially damaging physical events or human activities that may cause loss of life, injury, damage, disruption or environmental degradation (UN/ISDR, 2004).
16
Risk can be regarded in terms of the likelihood of an event occurring and the impact (or consequence) of the event if it occurs (ISO 31000, 2009). Conventionally, risk is expressed by the notation (UN/ISDR, 2004):
Risk = Hazards x Vulnerability
Related to the risk management, Vulnerability and Capacity Assessment (VCA)
uses various participatory tools to gauge people‟s exposure to and capacity to resist natural hazards (IFRC, 2011). It is an integral part of disaster preparedness and contributes to the creation of community-based disaster preparedness programmes at the rural and urban level. VCA enables local priorities to be identified and appropriate action taken to reduce disaster risk and assists in the design and development of programmes that are mutually supportive and responsive to the needs of the people most closely concerned. The aims of VCA are to:
assess risks and hazards facing communities and the capacities they have for dealing with them;
involve communities, local authorities and humanitarian and development organizations in the assessment from the outset;
draw up action plans to prepare for and respond to the identified risks;
identify risk-reduction activities to prevent or lessen the effects of expected hazards, risks and vulnerabilities.
VCA is complementary to national and sub-national risk, hazard, vulnerability and capacity mapping exercises that identify communities most at risk. A VCA is then undertaken in these communities to diagnose the specific areas of risk and vulnerability and determine what action can be taken to address them.
As VCA is a participatory process, National Societies can develop realistic activities that are better suited to local needs and priorities. As one National Society member stated after undertaking a VCA: “Before, we used to work for people, but now we
work with them.” (IFRC, 2011).
17
communities in Amhara were told to map and rank the risks that affect them through several mapping participatory exercises and the results in order of priority were as follows:
1. Drought
2. Human health problems (malaria and diarrhea) 3. Livestock diseases
4. Reduced productivity of livestock due to climate changes 5. Lack of access to improved crop species
6. Absence of a high school
7. Lack of adequate agricultural implements 8. Shortage of potable water
9. Lack of roads that connect with neighbouring kebeles 10. Shortage of cultivatable land
18
3
METHODOLOGY AND WORK PLAN
As a GIS specialist, my role in this project will consist on analyse the situation and give the required technical assistance to the BDU and ERCS staff. That is, to find the most efficient ways of using G.I. from the different types and options of geospatial technologies that exist and to build the necessary capacity so they can be applied in the local communities.
The main duties and time has been spent on the analysis of the GIS needs for the GIS lab, the design of the system and process to establish this lab, the preparation and implementation of the training actions, the technical support and the coordination of GIS components.
However, it is a complex issue to work from Spain trying to deal with a problem happening more than 5000 kilometres far away. Even if a frequent contact is held between the different actors, there is always something missing. Therefore, some decisions regarding how to reach out efforts were taken. In one hand, it was decided that the different activities to develop had to reach a consensus within the BDU, which is physically located in the affected region, placed in fact at the capital city of Amhara, thus nobody better than BDU team to be the focus of those activities. The second issue was about a possible visit of the UJI team to the affected region. It was thought as a necessary action to actually work with efficiency. Finally, the visit was planned and the dates were fixed. A multidisciplinary team from UJI was planned to travel to Bahir Dar and rural areas of Amhara in order to check directly in the field what the situation was. It was expected to be a good opportunity to meet the BDU project coordinators and responsible. This team was composed by the PCI coordinator, Rosana Peris, the technical coordinator Isabel Gimenez, and myself as a GIS specialist.
19
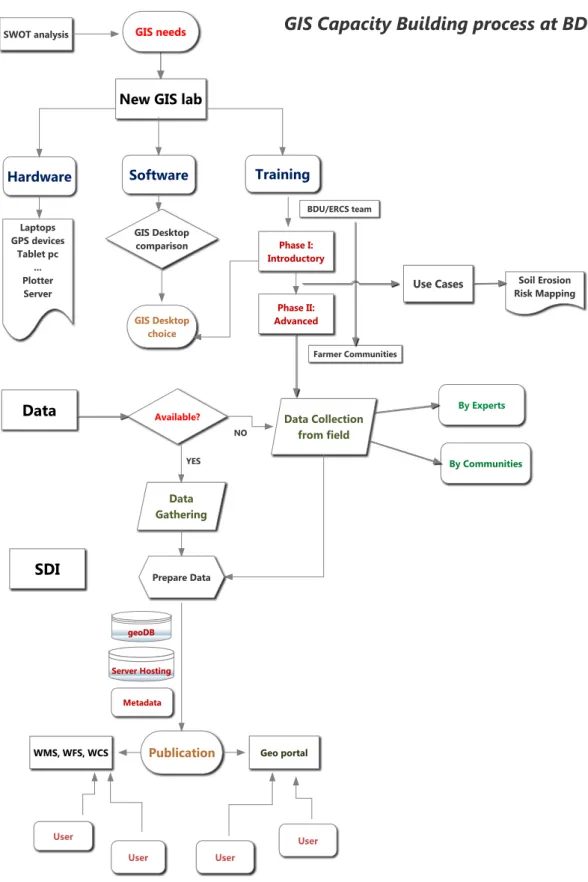
adequated to the actual situation. A flowchart diagram with the process can we found next:
Figure 6. Flowchart diagram. GIS plan process.
20
3.1
A
NALYSIS OFGIS
SITUATIONIn order to describe the situation regarding GIS capacity at BDU and in Amhara region in general a SWOT matrix has been built.
SWOT analysis is a strategic planning method used to evaluate the Strengths, Weaknesses/Limitations, Opportunities, and Threats involved in a project. It
involves specifying the objective of the project and identifying the internal and external factors that are favourable and unfavourable to achieve that objective.
Strengths: characteristics of the project team that give it an advantage over
others
Weaknesses (Limitations): characteristics that place the team at a
disadvantage relative to others
Opportunities: external chances to improve performance in the
environment
Threats: external elements in the environment that could cause trouble for
the project
Identification of SWOTs is essential because subsequent steps in the process of planning for achievement of the selected objective may be derived from the SWOTs. The SWOT analysis is often used in academia to highlight and identify strengths, weaknesses, opportunities and threats. It is particularly helpful in identifying areas for development (Wikipedia, 2011).
Strengths
Local team is keen to
collaborate and it is willing to improve
English is well spoken in the country
New GIS lab already built It already exist a Training
program for rural communities
Weakness
Lack of proper internet connection Uncoordinated departments Slow communication
Very old facilities
Lack of awareness on GIS Lack of spatial data
Communication channels between Rural Communities and BDU are not well established
Opportunities
New technologies market growth trend despite of global crisis
Open Source technologies not
Threats
Reduction of funds for cooperation projects in the future
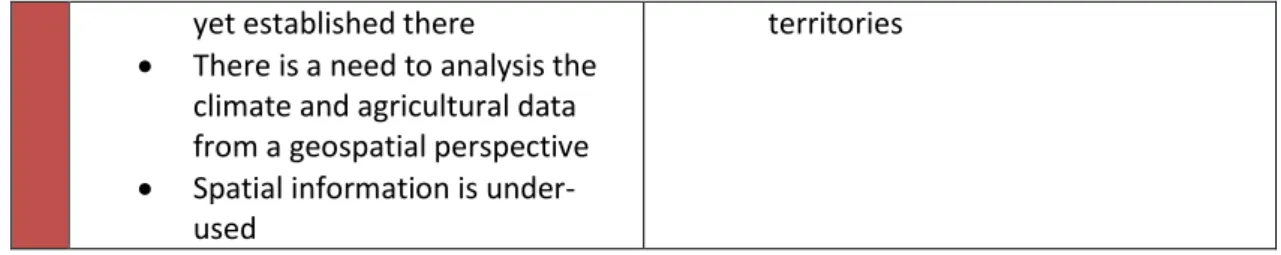
21 yet established there
There is a need to analysis the climate and agricultural data from a geospatial perspective Spatial information is
under-used
territories
Table 1. SWOT matrix for GIS capacity building project.
One of the main strengths of the project is that the team at BDU is keen and open to collaboration and they are quite open to new ideas and actions by UJI part. We can see that they really are willing to improve their situation, not only at the level of University but also with regard to the rural areas that they work with.
Also, a positive point is the language spoken. English is well spoken by most of them and in general in the whole country, except in some specific rural areas where only Amharic or local languages are spoken.
While Risk Reduction and Disaster Management is a discipline well known at BDU and they count on wide expertise, regarding GIS there is a lack of training and their knowledge on this field is very limited.
Regarding the GIS facilities, the new GIS lab is already built at the moment of our visit to BDU. Nevertheless, it is not still ready to use. In terms of hardware and software the work is almost done but there is still much work to do regarding data collection and capacity building. Indeed, one of the biggest gaps of the project is the lack of spatial data available. Therefore, the training to the BDU team for the collection of data in the field by using the new GIS equipment has been started.
From an institutional point of view, a training program to help rural communities has already been set up at BDU. However, the communication channels between those communities and the BDU team is not yet properly established and it lacks of the effectiveness that is expected to achieve.
22
several factors: lack of facilities, more relaxed way of life, etc. In that point it is worth to remark the very old facilities existing at BDU and specially the lack of proper internet connection, reduced to a couple of cable connexions inside the instructors offices. That makes communication and access to online resources almost impossible for the main public.
Opportunities of the project could be the fact that the technological market is nowadays in a growth trend despite of the world global crisis. In that sense, it is expected an explosion of the internet and the new technologies in Ethiopia (and Africa in general) in a few years as it happened in Europe or US in the past two decades (James, 2007).
Regarding OS technologies, they are not strongly established in the region for the moment, but we believe those technologies can be very helpful in such a context so our intention is to promote them when possible.
Moreover, the need to monitor, visualize and analyse the climate and agricultural data from a geospatial perspective is a fact. To geo-locate the real attributes existing in the field and make analysis and decisions based on them has become a must from a humanitarian and institutional point of view. However, the spatial information is currently under-used.
Three serious threats are present in the project. In one hand, the global crisis in the first world is causing a important reduction of funds for cooperation projects in the future. In fact, in our own country, Spain, those funds have been reduced and almost disappeared in many cases, (Intered, 2011).That is actually an important break to the development and continuity of the project.
A second threat might be the worsening of the climate situation. The current drought in the Horn of Africa is considered as the most severe of the last fifty years and if it continues in the next months, it would aggravate the already damaged rural areas of Amhara region (Reuters, 2011).
23
the establishment of new actions and consolidation of the existing ones (UN News Centre, 2011).
Current use of GIS
During our stay in Ethiopia (November 2011), and particularly in the city of Bahir Dar, we had the opportunity to be in direct contact with the BDU staff, who explained to us firsthand what was at that time the situation and use of GIS at their Departments. Regarding GIS knowledge and training, the situation so far is that an introductory course in GIS is offered to undergraduate students at BDU. We were told that fifty to sixty students complete the course each year. Also several university staff members are trained in GIS. In fact, a GIS training seminar was already carried out at BDU in June 2011 by the University of Dacca (Bangladesh). This fact might serve as a basis for the GIS training we were continuing. The other main stakeholder involved - ERCS team – was not yet trained on the use of GIS technologies in any way.
Staff at the BDU Department of Risk Reduction (DRR) is currently focused on two geographic areas in the Amhara Region, where Bahir Dar is the city capital. These areas correspond to two different woredas, Fogera and Habru, and the action plan is to train the rural communities living there on the production of hazard and risk maps. Both woredas are currently drought and conflicts have been taking place recently. The DRR program has partnered with the Amhara Food Security Bureau and Disaster Prevention Office in carrying out this research.
By his part, the ERCS is more focused on the Ebinat woreda. One of our objectives is to approach both institutions, BDU and ERCS so they can share their experiences and knowledge and join efforts with the common goal to help and give advice to the rural communities, in special on those three areas selected at this moment.
3.2
GIS
A
CTIONP
LAN24
the established objectives of this research. Some of those actions, described in the following paragraphs, have already taken place while some other are still in the first stages of implementation at the moment when this thesis is written.
3.3
GIS
LABORATORY ATBDU
At the moment of our visit, a new and more modern GIS laboratory was being built. It was placed in a different Campus and the BDU team plan was to move there during the coming months, when it will be ready in regard to installations, hardware and other issues. The currently existing GIS-lab, where we hold our GIS seminar, was composed by eight computers and a projector was given to us to help during the seminar.
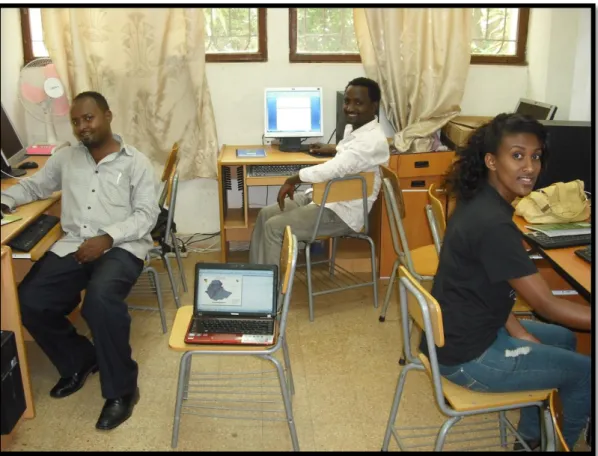
Figure 7. Facilities in the GIS current lab at BDU. (personal pictures)
25
Development organisations are also expected to benefit through availability of improved information for decision making and preparedness. Local NGOs currently send requests for specific research to be carried out by students of the DRR program. The GIS lab will also be used by student researchers.
Geographic Information Systems are generally made up of four components: software, hardware, staff, and data (NYS GIS Plan, 2008). In order to set up the new GIS lab at BDU, those necessary components need to be covered. GIS hardware, software and data sets will provide capacity-enhancing tools for the communities to use in decision-making and project development. A description of these components and the process is given next.
3.3.1
Hardware
The acquisition and provision of new equipment to BDU is one of the tasks to accomplish in order to achieve the objective of the new GIS lab establishment. It has been done in different phases. In September 2011, a laptop with GIS tools installed on it was already delivered to the representative from BDU during his visit to UJI. On the other hand, during our visit to Bahir Dar, a second laptop and a tablet pc was delivered to BDU representatives.
In December 2011, after our return to Spain, seven more tablets have been sent to BDU, ten notebooks and two more laptops. It is also scheduled to send a plotter and two projectors. The tablet pc counts on GPS reception for improved collection of data from the field. Moreover, they are being used as text processor to read and edit documents in the field. GIS software gvSIG mini has also been installed in order to allow them to visualize maps and connect to online resources while being in the field. They have camera as well, so pictures could be taken in the field while rural community training is being held. In fact, this has been their first use so far, according to the feedback that we receive from the BDU GIS coordinator.
26
In total, the equipment provided so far is listed as follows:
8 Tablets (with GPS and 3G reception)
2 GPS receptors
10 Notebooks
2 laptops
10 Wi-Fi routers
1 Plotter (with 2 ink chargers)
2 projectors
Several books and eBooks
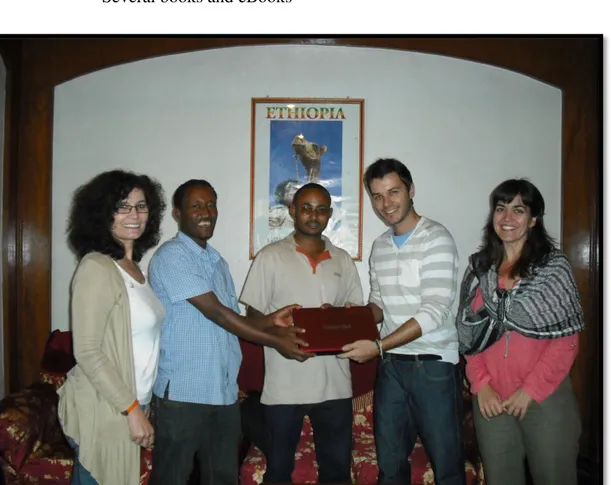
Figure 8. Delivery of technical equipment from UJI to BDU team, Bahir Dar. (personal pictures)
3.3.2
Software
27
Therefore, this was the moment to choose a GIS software that could perform and meet the requirements and existing needs into the GIS lab and the BDU in general. That is, summarizing, to cover functionalities such as the visualization of spatial data of different formats, the analysis and processing of those data, the creation of maps to be printed and other specific task that are explained in the training course document found in the Appendix 1.
Some literature was reviewed to compare among several GIS software regarding license, platforms and other variables. A summarizing table can be found in the Appendix E of the present document.
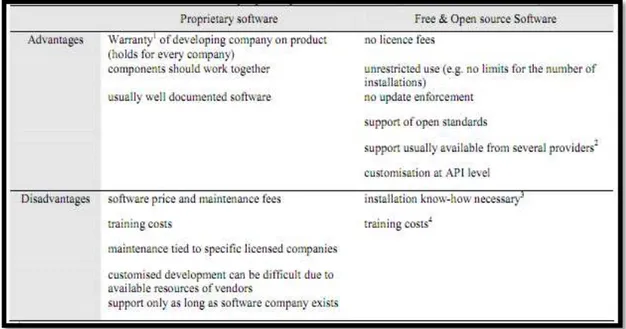
Talking to The reality is that proprietarysoftware has been dominating the software landscape to the point that it is today considered as the only possible model by many people. Only recently has the software industry considered free software as an option again.
In that sense, Weeler (2007) remarks the importance of considering the option of using Open Source Software / Free Software (FOSS) when looking for software for a project and so was done in this case. In his words, “the total cost of ownership for FOSS is often far less than proprietary software, especially as the number of platforms increases”.
Open source software (OSS) is software whose source code is published and made available to the public, enabling anyone to copy, modify and redistribute the source code without paying fees (Open Source Initiative). On the other hand, the Free Software Foundation (FSF) defines „free software‟ the one that fulfil the “Free Software Definition”, which grants four freedoms:
1. The freedom to run the program, for any purpose.
2. The freedom to study how the program works, and adapt it to your needs. 3. The freedom to redistribute copies so you can help your neighbour.
4. The freedom to improve the program, and to release your improvements to the public, so that the whole community benefits.
28
OSS is linked with licenses. The license under which a program is distributed defines the rights which its users have over it and this is of great importance. Usually, the conditions specified in licences of open source software are the result of a compromise between several goals: guarantee some basic freedoms (redistribution, modification, use) to the users, ensure some conditions imposed by the authors (citation of the author in derived works, for instance) and guarantee that derived works are also open source software. The licenses can offer different degrees of protection of the four freedoms seen before. The fact is that almost all open source software uses one of the common licences (GPL, LGPL, Artistic, BSD-like, MPL), being the General Public License (GPL) the most protective in a positive sense, since it guaranties all four freedoms.
As stated, the main advantages of using OSS are the absence of licensing fees, vendor independence, flexibility, access to source code and better interoperability through standards-based technology. In our case, we could say that the most important reasons to choose OSS are its low cost but especially the technological independency that will permit the different organizations involved in this project work in a more comfortable way.
Table 2. Differences between proprietary and FOS software (Weis 2006)
29
preferred type of technologies to be used in this case were the free open source. A summary of the benefits that using that kind of software brings is shown next:
Low cost. Don‟t have to pay license fee to use them. Unlimited number of installations.
Source code is managed and customized to the user own specific needs. Never have to pay when upgrading.
More security and privacy in the sense that you own the source code which you can use as you want. This keeps you safe from proprietary restrictions. Complete independency of any company formats and technologies.
Adaptability, modifications and bug fixing faster due to continuous evolution.
Users‟ feedback.
Use of standards to agree the level of interoperability needed.
Online support is easily available. Mailing active lists for users and developers are often efficient.
OS development increases user community participation.
Providing a desktop tool to access the G. I.
There are two options when dealing with spatial data. Either we access them through online web services as we will explain in section 3.6 about SDI, either we load the layers or access remotely to them by using a desktop GIS tool which has previously been installed in our computer.
At this stage of the project and taking into account that the advanced training about SDI and web server technologies has not been delivered yet to the BDU staff, we think that the most efficient option will be to use, for the moment, a desktop GIS. This software should cover the technical necessities for the BDU activities.
ESRI defines a Desktop GIS as a mapping software that is installed onto and runs on a personal computer and allows users to display, query, update, and analyze data about geographic locations and the information linked to those locations.
30
language used. As discussed, the priority in this project is to use free open source software (FOSS) when establishing the GIS lab at BDU, based on the benefits explained in the previous paragraphs. Hence, a review of the main OS Desktop GIS projects available and its advantages has been carried out.
The main projects that can be considered nowadays are: GRASS (Geographic Resources Analysis Support System), QGIS (Quantum GIS), uDig (user-friendly Desktop GIS), gvSIG (Generalitat Valenciana, Sistema d'Informació Geogràfica), SAGA (System for Automated Geo-Scientific Analysis), ILWIS (Integrated Land and Water Information System), MapWindow GIS, JUMP/OpenJUMP, KOSMO and OrbisGIS. Each of them has its own characteristics (see Appendix F for details).
The maturity of the gvSIG project and the fact that it covers the majority of functionalities required for the BDU regarding spatial analysis for both raster and vector formats were decisive factors that made us to choose this software as the tool to be used in this work. In addition, it was also taken into account the expertise that we already had on the use of this specific software.
gvSIG Project
gvSIG started in 2002 within the open source software migration process that took place in the Regional Government of Valencia. Nowadays, it is a European Commission project, a long term R+D+I project. Its main characteristics are (Anguix and Díaz, 2008):
Platform independent (it runs in most of the existing Operative System). Modular. Developed using independent modules adding scalability value. License GNU/GPL.
It follows the standards defined by the OGC. This guarantees the interoperability with all the GIS applications.
Simple use: it can be used by many users (even non-GIS experts). Internationalization: big effort on translation of interfaces, tutorials, etc.
31
gvSIG is able to work with most known data formats, raster and vector and most of the geospatial databases, like PostGIS or MySQL. It provides most common GIS tools such as data visualization, map navigation, query map information, distance measurement, thematic cartography, legend edition, labelling, feature selection, table management, layout manager, raster processing, etc. Its SDI client condition permits the connection through standards to OGC services like WMS, WFS and WCS, accessing data and being able to overlap it and combine it in map views. Discovery service client is also provided which can be use to locate data resources, through Catalogue and Gazetteer search services, following different protocols. In addition, it includes a CAD editing environment, geo processing functionalities and the SEXTANTE raster analysis tools, which include a wide range of tools related to agricultural and remote sensing applications. This means that in its current release gvSIG covers most of the BDU needs regarding functionalities, and with a free license.
Many other plug-in can be been added to the gvSIG functionalities (3D extension, mobile devices access, publishing and metadata) and others are being developed at the moment.
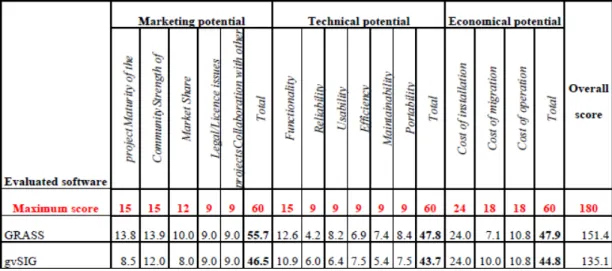
In 2008 a gvSIG evaluation was achieved by the EC project Cascados, regarding three different criteria: Marketing, Economical and Technical potential. The final results were considerably satisfactory to gvSIG. It was compared with a much more mature OS GIS, GRASS, and the evaluation for both projects is shown in the following Table 4.
32
Nevertheless, SEXTANTE module included within gvSIG installations already allows the integration of GRASS algorithms into gvSIG.
Another important point for the choice of such software was the community around it and the sustainability of the project. OS code evolves through community cooperation, where individual programmers as well as large companies participate. OS software has been maturing over the last years into well-supported tools whose code grows exponentially and OS GIS is not an exception to this trend.
In the case of gvSIG, the project has suffered a really fast evolution from a local level to an international level in only a few years of existence. It counts on active user and developer community participation, the software has been downloaded in more than 70 countries all over the world and the interface has been translated into more than 20 languages. User documentation is also available at several languages and, as well as other tutorials, workshops and seminars have been prepared for many events in the recent years.
The project is supported by many government agencies and private companies at national and international level. Many official events are organized through the year all over the world. The International gvSIG Conference takes place in Valencia every year and presentations about the Master of Science in Geospatial Technologies and its relationship with gvSIG project usually take place. In fact, part of this research work and our experience in Ethiopia was presented in the last edition of this Conference in December 2011.
33 Figure 9. gvSIG official website for the Community (www.gvsig.org).
Moreover, a professional structure has been created in order to grant the sustainability of the project, materialized in the gvSIG Association that was born in 2009 to promote FOSS4G and gvSIG development based on collaboration values, shared knowledge as a model of development and no monopoly practices.
Apart from providing the required GIS Desktop tool, other software are being used and trained on such as gvSIG mini for the tablets and Google Earth to visualize maps and ortophotos of the country.
3.3.3
Capacity building
The third component for the establishment of the GIS lab corresponds to the capacity building of the local team involved in the project. Proper training is important for all staff using GIS. In this regard, a large effort has been made for the training on both software and hardware having as targets the team at BDU and ERCS.
34
Phase I. Introductory training
The Phase 1 was planned for the year 2011 and it is here where this work has been developed. Some tasks have already been done, such as the visit to UJI of Tesfahun Asmamaw, coordinator of the GIS activity at BDU that took place in October 2011, where he had the opportunity to participate in a GIS training as well. Such a visit was profitable also to meet him personally, through several interviews and meetings that allowed us to know better how things were going at BDU and what were exactly their expectations regarding the future GIS seminar, planned for November 2011.
We were informed that a short GIS training to BDU staff was already held by University of Dacca some months ago. In that sense, the training to be done at BDU for us as GIS experts will enforce that one.
As planned, the GIS training seminar took place during our visit to BDU. The details are explained in the next section. It is expected that this training enables the staff at BDU DRR program to produce improved risk hazards maps by providing the exact location (increased precision) of hazards and resources, and thus improve their research capacity.
Currently there is an insufficient number of computers with GIS tools for the number of students enrolled in the GIS introductory course, but it is expected that the new equipment provided by UJI will allow greater access to GIS tools, as well as a greater quality of GIS education overall.
The main focus of the training has been on the lecturers and instructors from the CAES at BDU, but the final beneficiaries will be the agricultural communities that depend to some extent on the decisions that authorities and specialists take every day. As we are collaborating with ERCS as well, a representative of this NGO was scheduled to attend the seminar but finally it was not possible due to professional compromises. Nevertheless, new material is expected to be purchase for RCRC staff as real GIS users, as long as it will be required.
35
the Appendix B of this thesis. As stated, the training seminar took place at the current facilities of the BDU, considering that the new GIS-lab was still not ready to be used.
Preparation of the GIS seminar
Once the date and schedule for the seminar was fixed according to the preferences of the BDU coordinators, a workshop of 20 hours duration has been prepared. The first step was to prepare the material to use in the workshop, the data. Due to the lack of data provided from the BDU or other institutions in Ethiopia, an internet research was carried out and various cartographic layers corresponding to Ethiopia features has been gathered. Vector layers corresponding to the administrative boundaries at the different levels (national, regional, zones,...) and raster layers corresponding to satellite images of northern Ethiopia have been found out. Source links can be found on Appendix A of this thesis. Layers from the city of Valencia that were already collected previously were also used during the seminar exercises.
The next step was to design the agenda. The seminar content was mainly practical, composed by several exercises organised by topics. During the seminar the attendees could get in touch with the main functionalities of the gvSIG application. gvSIG version 1.9, that we considered one of the most stable, was used on that purpose. A practical look at both basic commonplace GIS tools as well as more innovative tools that gvSIG provides was taken. Several exercises were prepared following the next schedule:
Session 1 (Tuesday)
General presentation of the project and the GIS training activity
Installation of software and data
Exercise 1: Data visualization
Exercise 2: Visual analysis
Session 2 (Wednesday)
Exercise 3: Using Remote Services
Exercise 4: Editing
Exercise 5: Geoprocessing
36 Exercise 7: Map authoring
Tablet pc and GPS navigation practise
The exercises were prepared focusing on the topic of climatic issues such as risk of flooding or drought. Classification and symbol legend functionalities occupied also much of the time of the seminar as we can see in Figure 13, as well as geo-processing and editing, to end with the map production.
In addition, an explanation of the Google Earth application was given to the attendees, as a useful tool for visualizing images and maps of a desired place rapidly, as we can see in Figure 14. Finally, training on the use of the tablet pc and its applications (GPS, Map viewer, gvSIG Mini, documents reader, camera) was given. gvSIG Mini is the gvSIG version for smart phones. It is a viewer of free access maps based on tiles (OpenStreetMap, YahooMaps, Microsoft Bing, etc.) with a WMS client, address search, routes, location and many more things. It runs with both on/off-line modes and it was installed on the tablet pc for the BDU team geo location in the field.
37 Figure 10. Visual analysis with gvSIG during GIS workshop. (BDU, November 2011).
38 Figure 12. Equipment provision and training to BDU team (BDU, November 2011).
Some recommendations for improvement after the GIS training given during Phase I can be mentioned: more climate and food security related exercises in the coming seminars (they now have a general overview), to gather more quantity of data from the area of study (in order to prepare more specific activities with data from Amhara region), to give more importance to the field work (prepare more exercise where they have to use the mobile devices, GPS, etc.) and to engage more attendees in the courses.
Phase II. Advanced training
39
from BDU team. Nobody better than them know the problems that rural communities are facing in Amhara region.
However, a seminar is not as useful as it could be if a feedback is not established once it was finished. That is why the idea of creating a support mailing group composed by the attendees (and whoever likes to be included) and GIS specialist was set up in order to solve future questions and suggestions regarding the data, the hardware or the software in use. Also, they now have access to the different tutorials, real use cases, official user mailing list and all the tools available in the gvSIG project. A regular e-mail contact is held between the BDU technical coordinator and the UJI team to follow up the activities regarding GIS.
During this Phase II the GIS capacity building will be focused on hardware devices, advanced functionalities of the software and the SDI technologies and components.
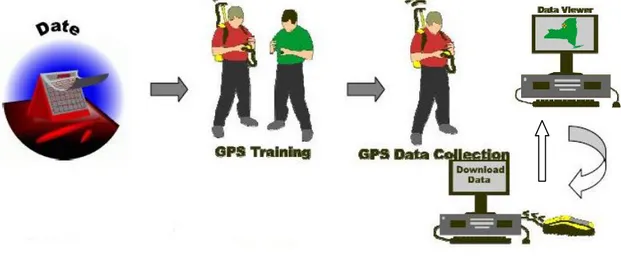
Figure 13. GPS data collection training schema. (NYS GIS Strategic Plan 2008)
e-learning GIS seminar
40
Another visit of BDU coordinator to UJI is planned for March 2012, followed by a visit of the UJI GIS team to BDU.
3.4
D
ATAAn effective Geographic Information System requires accurate and precise GIS data. The idyllic situation would be that the geographical data to be used for BDU and ERCS staff were available and provided by the official producers of it, such as government agencies and public institutions. As Harvey and Tulloch (2007) state when describing the SDI pyramidal model, data integration rests on local-government data sharing, following the National Spatial Data Infrastructure. Availability of local-government data is fundamental for all SDI-related data sharing in this model. However, in our case – and in many other – those official data were not provided officially. Thus, we believe that a bigger effort is needed in that sense. Either on creating the mechanism that makes the Government to share the data they owe, either on producing new data, with the desired accuracy, when needed.
3.4.1
Data availability
We currently have access to large amounts of data through several GIS Clearinghouses, but data collection is still needed in the region to build a solid geospatial database.
41
Therefore, one of the main problems we faced is the lack of data available and the lack of interoperability and capacity of sharing among different institutions and actors. In general, the situation about availability of data is that, in one hand, more accurate data is needed for certain areas and, on the other hand, an effort on the publishing and sharing of those data is needed and desirable.
3.4.2
Data collection
As explained, one of the biggest limitations of this work has been the lack of spatial data available. This fact has led us to a first phase of data search and gathering through the internet, where several geographical data of Ethiopia and Amhara region in particular have been downloaded. Those data have been used during the GIS training seminar at BDU, to perform the different exercises. However, more accurate and specific data are still needed to achieve the goals of the BDU activities. On that purpose, a data collection campaign has been launched, with the participation not only of the technician staff and experts involved in the project, but also where rural communities should take active part. We will differentiate from these two types of data collectors.
By Experts
From February 2012 a GIS application research related to vulnerability and food security has been launched by the BDU team, within the Phase II of the PCI. The equipment sent from UJI has arrived and it is already being used for the rural communities training.