Broiler surface temperature distribution of 42 day old chickens
Irenilza de Alencar Nääs
1*; Carlos Eduardo Bites Romanini
2; Diego Pereira Neves
2;
Guilherme Rodrigues do Nascimento
3; Rimena do Amaral Vercellino
21
UNICAMP/FEAGRI – Lab. de Conforto Térmico, C.P. 6011 – 13083-970 – Campinas, SP – Brasil. 2
UNICAMP/FEAGRI – Programa de Pós-Graduação em Engenharia Agrícola. 3
UFRPE – Depto de Zootecnia, R. Dr. Manuel de Medeiros s/n – 52171-900 – Recife, PE – Brasil. *Corresponding author <irenilza@feagri.unicamp.br>
ABSTRACT: Broiler chickens in Brazil are generally reared from 1 to 42 days when they are exposed to procedures such as fasting, harvesting, crating and transport to slaughter. Maintaining homeostasis is of great importance for broiler survival under harsh environment especially prior to slaughter. Heat loss varies in the distinct parts of the body during the growth period, and it is related to the air temperature of the environment and to the amount of feather covering. This research aimed to study the surface temperature distribution using infrared thermographic image processing to characterize 42 day old broiler chicken surface temperature prior to slaughter. Broilers were reared for 42 days and prior to harvest and transport to slaughter the infrared surface temperature was recorded along the day. Data from the thermograms taken in feather and featherless regions were compared during the 42nd
day of growth. High correlation between featherless regions and air temperature was found showing that these areas respond fast to changes in the rearing environment. Two functions were developed for predicting both surface temperature for featherless and feather covered areas of the broiler body parts.
Key words: thermal comfort, heat loss, thermoregulation, infrared thermography
Distribuição da temperatura superficial de frangos de corte com
42 dias de idade
RESUMO: No Brasil frangos de corte são normalmente alojados de 1 até 42 dias, quando são expostos a procedimentos como: jejum, apanha, colocação em caixas e transporte até o abate. Manter a homeostase do corpo é de grande importância para a sobrevivência de frangos de corte sob ambiente quente, especialmente na 7ª semana de crescimento. A perda de calor varia nas partes do corpo e está relacionada à temperatura do ar e à cobertura de penas. Avaliou-se a distribuição da temperatura superficial usando o processamento de imagens de câmera termográfica infravermelho, para caracterizar a temperatura superficial de frangos de corte de 42 dias de idade, no período anterior à apanha para o abate. Os frangos foram alojados de 1 a 42 dias e, antes de serem apanhados e transportados para o abate, foram registradas temperaturas superficiais infravermelho durante o dia.. Os resultados dos termogramas das regiões com penas e sem penas foram comparados, durante o 42º dia. Alta correlação entre regiões sem penas e a temperatura ambiente foi encontrada, mostrando que estas áreas respondem rapidamente a alterações no ambiente do alojamento. Duas funções foram desenvolvidas para predizer a temperatura superficial das regiões com e sem penas, do corpo de frangos com 42 dias, sendo conhecida a temperatura do ar do ambiente.
Palavras-chave: conforto térmico, perda de calor, termorregulação, termografia infravermelha
Introduction
Nearly 60% of Brazilian broiler chicken production is generally subjected to harsh environmental conditions especially in regions where high ambient temperatures are prevalent during most of the year and where climate control is not used in the housing. Thermal comfort and eventual environmental thermal challenges are impor-tant for broilers to maintain consimpor-tant body temperature during their growth period (Yahav et al., 2001; Yahav et al., 2004; Cangar et al., 2008). Physiological response to heat stress in birds results in a fluctuation in skin tem-perature (Richards, 1971; Tessier et al., 2003; Shinder et al., 2007). This variation, however, depends on the part of the body where it occurs, and usually it remains
within 5°C, even when the room temperature exceeds the thermal comfort zone (Zhou and Yamamoto, 1997).
regulat-ing their body temperature (Richards, 1971). Yahav et al. (1998) proved the ability of the naked neck chickens to both cope with the need of thermo regulating at low ambient temperatures and to maintain their body tem-perature at high level, in order to optimizing their sen-sible heat exchange.
The use of infrared thermography allows the identi-fication spots of distinct values of radiant temperature and it has been valuable to recognize physiological peak incidents in humans and animals. Surface temperature measurements can be made without disturbance and with better precision, especially on animal coats that have low heat capacities (McCafferty et al., 1998; Tessier et al., 2003; Montanholi et al., 2008; Bouzida et al., 2009). Most broiler chickens in Brazil are caught, caged and transported within the 6th week of growth and the
simul-taneous exposure to harsh temperatures during this man-agement may lead to extra loss in the final results at slaughter, including the incidence of pale meat, repre-senting important economical drawback to producers (Mendes, 2001; Bianchi et al., 2005).
This research aimed to study the diurnal variation of body surface temperature of 42 day old broiler chick-ens prior to slaughter.
Material and Methods
Three hundred male Cobb® 500 broilers were reared from 1 day old in six small scale houses (3.2 m length, 1.4 m width, and 1.4 m height), being 50 in each house in a constant flock density up to 30 kg m–2. Commercial
feedstuff was given ad libitum since the first week. Five birds were randomly selected to be weighed every day, and the mean body weight at 42 day was 2981.5 ± 86.7 g. Tap potable water was available for the birds at all times. Air dry bulb temperature (Ta) was recorded continu-ously (every 30 min) using a data logger placed in the geometrical center of each house. The data used for
cal-culating diurnal rearing ambient temperature fluctuation were selected within an interval in the morning (7h00 – 12h00) and one in the afternoon (12h30 – 18h00).
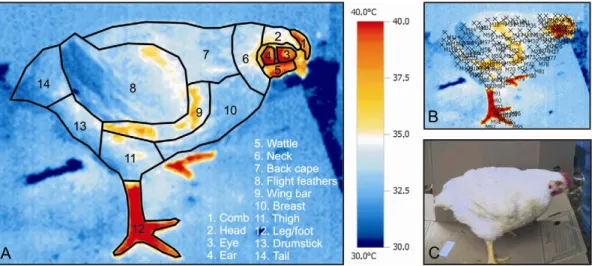
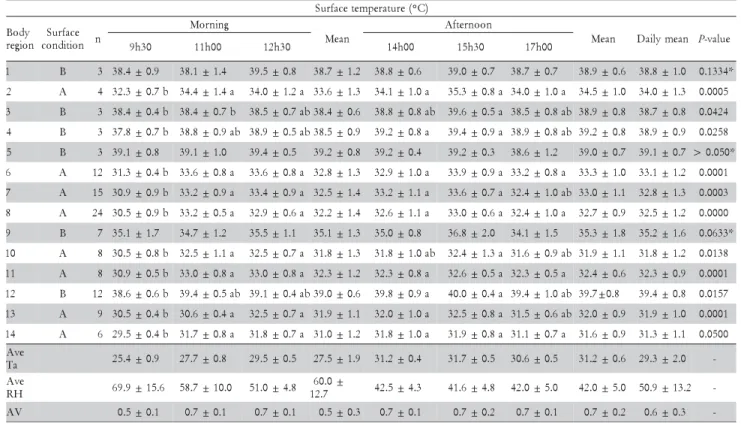
For surface temperature recording, one broiler per house was randomly chosen at the 42nd day of rearing to collected infrared thermal images, in both morning (9h00 and 11h00) and afternoon (12h30, 14h00, 15h30, and 17h00), using an infrared thermography camera with pre-cision of ± 0.1°C and a spectrum range of 7.5 - 13 μm. Thermograms were taken at ambient air temperatures (Tair) ranging from 25.4 to 31.9°C. For all images a blue/ red color scheme was used and the chosen temperature scale was between 30°C and 40°C. For a better visual-ization of the images a cardboard was placed behind each bird during the process to avoid visual interference from the surrounding area. The thermal camera was placed approximately 1 m from the broiler in order to have a complete image filling within the entire angle of sight (Figure 1). Since electromagnetic radiation travels in straight lines, errors due to angle distortion can occur. To minimize the error which is nearly negligible for ob-jects with a rough surface, such as animals, the image was registered using an angle of 90° from the bird sur-face. The emissivity coefficient (ε) used was 0.94 for the regions with feathers and 0.95 for the featherless regions, which are within the range of emissivity values for bio-logical material. There are several suggestions for this matter in the literature. McCafferty et al. (1998) assumed the emissivity value of 0.98 for plumage, when calculat-ing the radiant heat loss of a barn owl (Tyto alba). Dawson et al. (1999) adopted the emissivity value of keratin (0.8) to construct a model of radiant heat trans-fer through the penguin coat. Ward et al. (1999) and Cangar et al. (2008) suggested the overall emissivity value of 0.95 for the bird. Malheiros et al. (2000) used ε = 0.94 to determine the variation of the surface temperature in post hatch pullets. The images of the broiler surface were divided in 14 regions to allow assessment of regional Ts
distribution, as suggested by Ward et al. (1999). Mean surface temperature (Ts) and standard deviation of a given body area were calculated using the temperature measured at several randomly chosen points located within the chosen body parts (Figure 1). The number of points selected in each body part is shown in parenthe-sis as follows: comb (3), head (4), eye (3), ear (3), wattle (3), neck (12), back cape (15), flight feathers (24), wing bar (7), breast (8), thigh (8), leg/foot (12), drumstick (9), and tail (6). Each thermogram was analyzed using a pro-cessing and data converting software provided by the camera manufacturing company.
One-way ANOVA was undertaken to find out Ts dif-ference between the selected regions of the body. In a second step a two-way ANOVA was applied to test the difference of the feather covering parts and the time of the day. The Tukey test was applied using the tempera-ture gradient (Eq. 1) in the parts with feather and feath-erless as function of the time and period of the day. In-dividual data were organized in two groups A = body parts with feathers; and B= featherless body parts, and the multiple Tukey test was applied to verify the differ-ences between Ts in both groups and during the time of the day. The statistical software Minitab® v. 1.5 was used to process the data. Statements of significance are based on p < 0.05. Regression analysis was applied to the body parts surface temperature for both periods of the day in order to find a function that estimates the body parts
surface temperature for both areas (with feather and featherless), as function of the rearing air temperature.
Results and Discussion
Mean Tair in the morning was 27.5 ± 1.9°C increas-ing towards the afternoon to 31.2 ± 0.6°C. Air tempera-ture varied from the thermoneutral value of 25.4 ± 0.9°C in the beginning of the experiment (9h30) to the upper temperature of 31.9 ± 0.8°C at 15h30. Relative humid-ity remained constant along the day and the air veloc-ity within the houses due to natural ventilation was low, varying from 0.5 to 0.7 m s–1. The majority of Ts
registered for the bird body parts varied along the day (p < 0.05) with the exception of the comb, the wattle and the wing bar (Table 1).
Yahav et al, 2001; 2004) observed that high AV (> 2.5 m s–1) increases performance and alleviates heat stress in
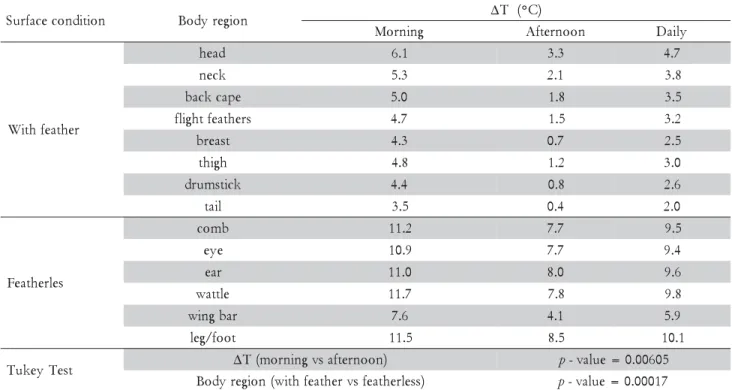
broiler chickens when compared to birds exposed to low AV (0.5 to 1.0 m s–1) under same harsh conditions. In this specific experiment the rearing condition had low air ve-locity and consequently low heat exchange by convection. Heat loss by radiation and convection as function of the temperature gradient (ΔT) between Ts (ºC) and Tair (ºC) were the driving force for broiler sensible heat loss, and the featherless regions of the body are the parts that pro-vided the highest mean temperature gradient, both in the morning and in the afternoon (Table 2).
Table 1 – Surface temperature in body regions (Ts), air temperature (Tair), relative humidity (RH) and wind velocity (AV) in the morning and the afternoon, and summarized mean values in the morning, the afternoon and daily.
) C ° ( e r u t a r e p m e t e c a f r u S
y d o B
n o i g e r
e c a f r u S
n o i t i d n o
c n
g n i n r o M
n a e M
n o o n r e t f A
n a e
M Dailymean P-value 0
3 h
9 11h00 12h30 14h00 15h30 17h00
1 B 3 38.4±0.9 38.1±1.4 39.5±0.8 38.7±1.2 38.8±0.6 39.0±0.7 38.7±0.7 38.9±0.6 38.8±1.0 0.1334*
2 A 4 32.3±0.7b 34.4±1.4a 34.0±1.2a 33.6±1.3 34.1±1.0a 35.3±0.8a 34.0±1.0a 34.5±1.0 34.0±1.3 0.0005
3 B 3 38.4±0.4b 38.4±0.7b 38.5±0.7ab38.4±0.6 38.8±0.8ab 39.6±0.5a 38.5±0.8ab 38.9±0.8 38.7±0.8 0.0424
4 B 3 37.8±0.7b 38.8±0.9ab 38.9±0.5ab38.5±0.9 39.2±0.8a 39.4±0.9a 38.9±0.8ab 39.2±0.8 38.9±0.9 0.0258
5 B 3 39.1±0.8 39.1±1.0 39.4±0.5 39.2±0.8 39.2±0.4 39.2±0.3 38.6±1.2 39.0±0.7 39.1±0.7 >0.050*
6 A 12 31.3±0.4b 33.6±0.8a 33.6±0.8a 32.8±1.3 32.9±1.0a 33.9±0.9a 33.2±0.8a 33.3±1.0 33.1±1.2 0.0001
7 A 15 30.9±0.9b 33.2±0.9a 33.4±0.9a 32.5±1.4 33.2±1.1a 33.6±0.7a 32.4±1.0ab 33.0±1.1 32.8±1.3 0.0003
8 A 24 30.5±0.9b 33.2±0.5a 32.9±0.6a 32.2±1.4 32.6±1.1a 33.0±0.6a 32.4±1.0a 32.7±0.9 32.5±1.2 0.0000
9 B 7 35.1±1.7 34.7±1.2 35.5±1.1 35.1±1.3 35.0±0.8 36.8±2.0 34.1±1.5 35.3±1.8 35.2±1.6 0.0633*
0
1 A 8 30.5±0.8b 32.5±1.1a 32.5±0.7a 31.8±1.3 31.8±1.0ab 32.4±1.3a 31.6±0.9ab 31.9±1.1 31.8±1.2 0.0138
1
1 A 8 30.9±0.5b 33.0±0.8a 33.0±0.8a 32.3±1.2 32.3±0.8a 32.6±0.5a 32.3±0.5a 32.4±0.6 32.3±0.9 0.0001
2
1 B 12 38.6±0.6b 39.4±0.5ab 39.1±0.4ab39.0±0.6 39.8±0.9a 40.0±0.4a 39.4±1.0ab 39.7±0.8 39.4±0.8 0.0157
3
1 A 9 30.5±0.4b 30.6±0.4a 32.5±0.7a 31.9±1.1 32.0±1.0a 32.5±0.8a 31.5±0.6ab 32.0±0.9 31.9±1.0 0.0001
4
1 A 6 29.5±0.4b 31.7±0.8a 31.8±0.7a 31.0±1.2 31.8±1.0a 31.9±0.8a 31.1±0.7a 31.6±0.9 31.3±1.1 0.0500
e v A
a
T 25.4±0.9 27.7±0.8 29.5±0.5 27.5±1.9 31.2±0.4 31.7±0.5 30.6±0.5 31.2±0.6 29.3±2.0 -e
v A
H
R 69.9±15.6 58.7±10.0 51.0±4.8 ± 0 . 0 6
7 . 2
1 42.5±4.3 41.6±4.8 42.0±5.0 42.0±5.0 50.9±13.2 -V
A 0.5±0.1 0.7±0.1 0.7±0.1 0.5±0.3 0.7±0.1 0.7±0.2 0.7±0.1 0.7±0.2 0.6±0.3
The overall diurnal temperature fluctuation (from 7h00 to 18h00) was 9.0°C whereas the lowest registered air temperature occurred at 7h00 (23.2°C) and the highest at 15h30 (32.2°C). Surface temperature of the body parts and the rearing air temperature were differ-ent (p < 0.05) in the morning and in the afternoon (Table 1 and 2). High correlation between featherless regions and Tair was found (0.8) showing that these areas respond fast to changes in the air temperature, probably due to high blood flow to these areas. The coefficient of correlation for the body parts with feathers was 0.6, and the prob-able reason of the small correlation is the air layer that increases the thermal inertia between the skin and the feathers. Malheiros et al. (2000) reported an increase in skin thermal conductance when the air temperature rose from 20 to 40°C, implying in an increase in peripheral blood flow, which might be the determinant factor to change the surface temperature during exposure to
differ-ent environmdiffer-ental temperatures. Cangar et al. (2008) found that the comb had the highest temperature gradi-ent while the wing had the lowest. The head and neck regions and perhaps some areas around the abdomen are poorly feathered, hence insulation is quite poor in these areas, and consequently the sensible heat flow is im-proved (Li and Yamamoto, 1991; Choi et al., 1997).
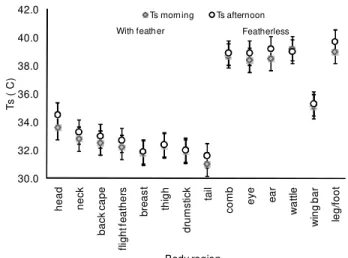
The body featherless areas (comb, eye, ear, wattle, wing bar and leg/foot) presented higher temperatures than the areas of the body covered by feathers (head, neck, back cape, flight feathers, breast, thigh, drumstick, and tail) (Figure 1). Peripheral blood circulation increase is directly related to high room temperatures in hot weather, but it is less efficient for broiler to benefit from the heat loss in the surface covered with feathers (Cangar et al., 2008). This was also found in this experiment where T in the body areas with feathers remained lower than in the featherless areas (Table 3).
e m i
T ∆T (°C)
r e h t a e f h t i w s t r a p y d o
B Bodypartsfeatherless
0 3 h
9 6.2a(head) 8.4a(wattle)
p-value<0.001 0
0 h 1
1 5.9a(neck) 7.2b(leg/foot)
0 3 h 2
1 4.1b(backcape) 5.8c(comb)
0 0 h 4
1 2.0c(thigh;tail) 4.3d(wingbar)
0 3 h 5
1 2.1c(drumstick;breast) 4.3d(eye)
0 0 h 7
1 2.3c(flightfeathers) 4.4d(ear)
Table 3 – Variation of mean temperature gradient (ΔT) at studied times and the body parts.
Means within the same column with different letters differ (Tukey, p < 0.05).
Table 2 – Results of two-way ANOVA and Tukey test for the temperature gradient (ΔT) between surface temperature (Ts) and air temperature (Tair).
n o i t i d n o c e c a f r u
S Bodyregion ∆T (°C)
g n i n r o
M Afternoon Daily
r e h t a e f h t i W d a e
h 6.1 3.3 4.7
k c e
n 5.3 2.1 3.8
e p a c k c a
b 5.0 1.8 3.5
s r e h t a e f t h g i l
f 4.7 1.5 3.2
t s a e r
b 4.3 0.7 2.5
h g i h
t 4.8 1.2 3.0
k c i t s m u r
d 4.4 0.8 2.6
l i a
t 3.5 0.4 2.0
s e l r e h t a e F b m o
c 11.2 7.7 9.5
e y
e 10.9 7.7 9.4
r a
e 11.0 8.0 9.6
e l t t a
w 11.7 7.8 9.8
r a b g n i
w 7.6 4.1 5.9
t o o f / g e
l 11.5 8.5 10.1
t s e T y e k u
T ∆T(morningvsafternoon) p-value=0.00605
) s s e l r e h t a e f s v r e h t a e f h t i w ( n o i g e r y d o
Broiler acute physiological responses to high envi-ronmental temperatures are directly related to the main-tenance of homeothermy, but small increases in body temperature may be tolerated, not necessarily resulting in thermal shock (Donkoh, 1989). The author states that birds require a cool environment for at least in part of the day recover from mild heat stress. In this experiment broilers were exposed to heat stress in the afternoon, and the weather data in the previous week was very similar, indicating that birds were exposed to the same weather profile for nearly seven days. The process of acclimatiza-tion (IUPS Thermal Commission, 2001) requires from four to seven days to be completed in domestic fowls (Yahav et al., 2005). Therefore, the alterations related to the thresh-old response to physiological changes which are involved in heat dissipation are not likely to have yet taken place in the studied birds when data were collected.
Cooper and Washburn (1998) studied the economic importance of broiler production under heat stress ex-posure and found that when the room temperature is near 30°C, there is an increase in body temperature; however, 42 days old broilers are within the limit of cop-ing with heat stress. Cooper and Washburn (1998) showed that the birds benefited from the sensible heat loss in the morning, due to the high value of ΔT and increased the latent heat loss when the rearing ambient temperature increased towards the afternoon. Appar-ently, 42 day old broilers remain within the limit of ther-mal tolerance for the diurnal temperature fluctuation within the range found in this experiment.
Latent heat loss prevails over sensible heat in older birds during exposure to heat stress, although the sur-face temperature increases in the naked areas are an at-tempt of maximizing sensible heat loss as well (Yahav et al., 2004; Cangar et al., 2008). Zhou and Yamamoto (1997) measured the response of surface temperature in broilers and found the largest values in featherless skin temperature when increasing air temperature to 28°C, indicating that those areas are probably considered to be specialized for temperature regulation, since they can adjust heat exchange (Yahav et al., 2004). Although the input to heat exchange of feathered areas is small but as it corresponds to a large area it has to be included in all sensible heat loss calculations (Yahav et al., 2005).
Two clusters were found in the Ts results (Figure 2): the body parts covered by feathers (A) and the feath-erless body parts (B). Linear regression analysis was ap-plied using Tair data and both A and B surface tempera-tures. Results confirmed two linear functions that allow the prediction of A Ts (R2 = 99.1%) and B Ts (R2 = 94.7%) from the value of Tair (Eq. 1 and 2).
A = 36.32 + 0.12 Tair Eq.1
B = 8.53 + 0.61 A Eq.2
If the models are applied for both featherless and feath-ered body parts, Ts can be predicted by knowing Tair. From calculated values of A and B sensible heat exchange can be estimated in the pre-slaughter period under the
studied conditions. Ts will differ when birds have differ-ent age and were exposed to acute heat stress. Cook et al. (2006) confirmed a highly significant relationship between radiated temperature and body feather cover, and pro-posed a real-time assessment of feather cover from the mean image temperature. Similar results were found in the present (Table 3 and Figure 2) study as featherless body regions presented higher surface temperature.
Broiler chicken pre-slaughter management (fasting, catching, caging, and transportation) during hot weather conditions increases blood uric acid, albumin, and glu-cose levels, which are reliable indicators of stress in broilers (Aksit et al., 2006). Pre-slaughter handling and transport of broiler chickens as assessed by dead-on-ar-rivals, physical injury, carcass characteristics, physiologi-cal stress responses, fearfulness and aversion are also re-ported to be enhanced by the exposition to high tem-peratures as well as to a decrease in bird welfare (Nicol and Scott, 1990). Brossi et al. (2009) stated that the heat stress, chronic or acute, suffered by broilers at the pre-slaughter handling, generates negative consequences on the functional properties of the meat. Pale poultry meat has been of interest in recent years due to several reports estimating that its incidence is dependent on flock, sea-son, and factors affecting pre-slaughter management and transportation (Bianchi et al., 2005).
Conclusion
Infrared thermography provided a detailed descrip-tion of the radiative temperature of broilers previous to catching which would have been difficult to achieve us-ing solid sensors. The relationship between radiated temperature and feather cover was significant, and a real-time assessment of feather cover can be obtained from the mean image temperature subsidizing flock manage-ment decision during pre-slaughter handling. Equations were developed to predict broiler surface temperature as function of air temperature.
Figure 2 – Body region surface temperature organized by clusters (with feathers and featherless) during the morning and afternoon.
30.0 32.0 34.0 36.0 38.0 40.0 42.0
head nec
k
bac
k
c
ape
fl
ig
ht
f
e
at
her
s
br
ea
s
t
th
ig
h
dr
ums
ti
c
k
tai
l
co
m
b
ey
e
ea
r
wa
ttl
e
wi
n
g
b
a
r
leg/
foot
Ts
(
C
)
Body region
Ts morn ing Ts afternoon
Acknowledgements
To FAPESP and CNPQ for supporting the research, and to Lilia Sonoda for helping in birds husbandry.
References
Aksit, M.; Yalçin, S.; Özkan, S.; Metin, K.; Özdemir, D. 2006. Effects of temperature during rearing and crating on stress parameters and meat quality of broilers. Poultry Science 85: 1867-1874.
Bianchi, M.; Fletcher, D.L.; Smith, D.P. 2005. Physical and functional properties of intact and ground pale broiler breast meat. Poultry Science 84: 803-808.
Bouzida, N.; Bendada, A.; Maldague, X.P. 2009. Visualization of body thermoregulation by infrared imaging. Journal of Thermal Biology 34: 120-126.
Brossi, C.; Contreras-Castillo, C.J.; Amazonas, E.A.; Menten, J.F.M. 2009. Heat stress during the pre-slaughter in broilers. Ciência Rural 39: 1284-1293. (in Portuguese, with abstract in English). Cangar, Ö.; Aerts, J-M.; Buyse, J.; Berckmans, D. 2008.
Quantification of the spatial distribution of surface temperatures of broilers. Poultry Science 87: 2493–2499.
Choi, J.K.; Miki, K.; Sagawa. S.;·Shiraki, K. 1997. Evaluation of mean skin temperature formulas by infrared thermography. International Journal of Biometeorology 41: 68–75.
Cook, N.J.; Smykot, A.B.; Holm, D.E.; Fasenko, G.; Church, J.S. 2006. Assessing feather cover of laying hens by infrared thermography. Journal of Applied Poultry Research 15: 274– 279.
Cooper, M.A.; Washburn, K.W. 1998. The relationships of body temperature to weight gain, feed consumption, and feed utilization in broilers under heat stress. Poultry Science 77: 237–242.
Dawson, C.; Vincent, J.F.V.; Jeronimidis, G.; Rice, G.; Forshawa, P. 1999. Heat transfer through penguin feathers. Journal of Theoretical Biology 199: 291–295.
Donkoh, A. 1989. Ambient temperature: a factor affecting performance and physiological response of broiler chickens. International Journal of Biometeorology 33: 259–265. IUPS Thermal Commission. 2001. Glossary of terms for thermal
physiology. The Japanese Journal of Physiology 51: 245–280. Li, Y.; Ito, T; Yamamoto, S. 1991. Diurnal variation in heat
production related to some physical activities in laying hens. British Poultry Science 32: 821-827.
Malheiros, R.D.; Moraes, V.M.B.; Bruno, L.D.G.; Malheiros, E.B.; Furlan, R.L.; Macari, M. 2000. Environmental temperature and cloacal and surface temperatures of broilers chicks in first week post hatch. Journal of Applied Poultry Research 9: 111-117. McCafferty, D.J.; Moncrieff, J.B.; Taylor, R.; Boddie, G.F. 1998.
The use of IR thermography to measure the radiative temperature and heat loss of a barn owl (Tyto alba). Journal of Thermal Biology 23: 311-318.
Mendes, A.A. 2001. Pre-slaughter fasting on broiler. Revista Brasileira de Ciência Avícola 3: 199–209. (in Portuguese, with abstract in English).
Montanholi, Y.R.; Odongo, N.E.; Swanson, K.C.; Schenkel, F.S.; Mcbride, B.W.; Miller, S.P. 2008. Application of infrared thermography as an indicator of heat and methane production and its use in the study of skin temperature in response to physiological events in dairy cattle (Bos taurus). Journal of Thermal Biology 33: 468-475.
Nicol, C.J.; Scott, G.B. 1990. Pre-slaughter handling and transport of broiler chickens. Applied Animal Behaviour Science 28: 57-73.
Richards, S.A. 1971. The significance of changes in the temperature of the skin and body core of the chicken in the regulation of the heat loss. Journal of Physiology 216: l-10.
Shinder, D.; Rusal, M.; Tanny, J.; Druyan, S.; Yahav, S. 2007. Thermoregulatory response of chicks (Gallus domesticus) to low ambient temperatures at an early age. Poultry Science 86: 2200–2209.
Tessier, M.; Du Tremblay, D.; Klopfenstein, C.; Beauchamp, G.; Boulianne, M. 2003. Abdominal skin temperature variation in healthy broiler chickens as determined by thermography. Poultry Science 82: 846-849.
Ward, S.; Rayner, J.M.V.; Möller, U.; Jackson, D.M.; Nachtigall, W.; Speackman, J.R. 1999. Heat transfer from starling Sturnus vulgaris during flight. Journal of Experimental Biology 202: 1589-1602.
Yahav, S.; Luger, D.; Cahaner, A.; Dotan, M.; Rusal, M.; Hurwitz, S. 1998. Thermoregulation in naked neck chickens subjected to different ambient temperatures. British Poultry Science 39: 133-138.
Yahav, S.; Straschnow, A.; Vax, E.; Razpakovski, V.; Shinder, D. 2001. Air velocity alters broiler performance under harsh environmental conditions. Poultry Science 80: 724-726. Yahav, S.; Straschnow, A.; Luger, D.; Shinder, D.; Tanny, J.; Cohen,
S. 2004. Ventilation, sensible heat loss, broiler energy, and water balance under harsh environmental conditions. Poultry Science 83: 253–258.
Yahav, S.; Shinder, D.; Tanny, J.; Cohen, S. 2005. Sensible heat loss: the broiler’s paradox. World’s Poultry Science Journal 61: 419-434.
Zhou, W.T.; Yamamoto, S. 1997. Effects of environmental temperature and heat production due to food intake on abdominal temperature, shank skin temperature and respiration rate of broilers. British Poultry Science 38: 107-114.