TRAFFIC EFFECTS ON THE SOIL PRECONSOLIDATION
PRESSURE DUE TO EUCALYPTUS HARVEST OPERATIONS
Moacir de Souza Dias Junior1*; Fernando Palha Leite2; Edson Lasmar Júnior1; Cezar Francisco Araújo Junior1
1
UFLA - Depto. de Ciência do Solo, C.P. 3037 - 37200-000 - Lavras,MG - Brasil. 2
Celulose Nipo-Brasileira S.A - 35195-000 - Belo Oriente, MG - Brasil. *Corresponding author <[email protected]>
ABSTRACT: One of the limitations for reaching sustainable forest development is related to the traffic of machines and vehicles during harvest operations and wood transport, which may cause soil structure degradation. Seeking a way to analyze this problem, the objective of this study was to determine the traffic effects due to harvest operations and wood transport, on the preconsolidation pressure (σ
p) in a Typic Acrustox
cultivated with eucalyptus. This study was conducted using undisturbed soil samples collected at the 0.1-0.125 m depth. Undisturbed soil samples were used in the uniaxial compression tests. Soil sampling consisted of two stages, before and after the mechanized harvest operations. The traffic effects on theσ
p in the dry
season indicated that the soil compaction process was neither evident nor important. However, in the rainy season the traffic effects on theσ
p indicated that the operations performed with Harvester and Forwarder
caused greater soil compaction than those with Motorized Saw and Manual, which caused less soil compaction. Key words: forest soil compaction, soil structure, uniaxial compression test
EFEITO DO TRÁFEGO NAS PRESSÕES DE PRECONSOLIDAÇÃO
DO SOLO DEVIDO AS OPERAÇÕES DE COLHEITA
DO EUCALYPTUS
RESUMO: Uma das limitações para alcançar o desenvolvimento florestal sustentável está relacionado ao tráfico de máquinas e veículos durante as operações de colheita e transporte de madeira que podem causar degradação da estrutura do solo. Buscando uma maneira para analisar este problema, o objetivo deste estudo foi determinar o efeito do tráfego devido a operações de colheita e transporte de madeira, nas pressões de preconsolidação (σ
p) de um Latosol Vermelho-Amarelo, cultivado com Eucalyptus. Este estudo foi realizado
usando amostras de solo indeformadas coletadas a 0,10-0,125 m de profundidade. As amostras indeformadas foram usadas nos ensaios de compressão de uniaxial. A amostragem consistiu de duas fases, antes e depois das operações de colheita mecanizada. As alterações causadas pelo tráfego nas σ
p na estação seca indicaram
que o processo de compactação não foi evidente e nem importante. Já na estação chuvosa as alterações causadas nas σ
p pelas operações realizadas com o Harvester e Forwarder foram as que causaram maior
compactação, enquanto que as operações realizadas com a Motosserra e baldeio manual, foram as que causaram menor compactação do solo.
Palavras-chave: compactação de solos florestais, estrutura do solo, ensaio de compressão uniaxial
INTRODUCTION
Soil compaction has been identified as one of the major problems causing soil degradation (Canillas & Salokhe, 2002, Horn et al., 2003). Thus, one of the limitations for reaching sustainable forest develop-ment is related to the traffic of machines and vehicles during the harvest operations and wood transport, which may cause soil compaction (Dias Junior et al., 1999). Soil compaction can occur due to the fact that during mechanized operations, there is neither control of the soil moisture nor of the soil bearing capacity. This situation can become more critical due to the in-discriminate traffic in the area which can result in
enhanced soil compaction spread over years causing, as a consequence, a reduction of the productivity (Dias Junior et al., 1999).
would contribute to minimize soil compaction and con-sequently, the losses of productivity of areas under in-tense traffic.
Considering that the preconsolidation pressure is an indicator of soil strength (Arvidsson, 2001, Horn & Fleige, 2003) and of the maximum pressure that should be applied to a soil in order to avoid soil compaction (Gupta et al., 1989; Lebert & Horn, 1991; Defossez & Richard, 2002), the objective of this study was to deter-mine the traffic effects of harvest operations and wood transport through the preconsolidation pressure deter-mined for a Typic Acrustox during the harvest of an eu-calyptus plantation.
MATERIAL AND METHODS
This study was carried out in experimental areas cultivated with eucalyptus located in Peçanha (Buriti, Dourado and São Leonardo Projects) 42°33’45" W; 18°32’44" S, Sabinópolis (Imbaúbas Project) 43°04’55" W; 18°39’59" S, Guanhães (Aeroporto Project), Belo Oriente (Água Suja encosta, Água Suja baixada, Cajá encosta, Cajá baixada Projects) 42°56’04" W; 18°46’30" S and Santa Bárbara (Carlos Hosken encosta Project) 43°24’47" W; 19°57’39" S, Counties, MG, Brazil. Soils at all sites were classified as Typic Acrustox (Soil Tax-onomy) or Orthic Ferralsol (FAO). Textural classes are presented in Table 1.
The areas in this study were at the end of the first cultivation cycle with eucalyptus. The tree ages were 7.0 years in the Imbaúbas, Cajá Baixada, Cajá Encosta Projects, 8.0 years in the Água Suja baixada, Água Suja Encosta and Carlos Hosken Projects, 9.6 years in the Buriti Project, 10.6 years in the Dourado Project, 12.6 years in the São Leonardo Project, and 15.2 years in the Aeroporto Project.
Machines used for forest harvest operations and wood transport were: Feller Büncher, model 2618 with tracks, applied pressure P = 45 kPa, and Skidder (Tires
30.5L.32) with tires 4 × 4, model 460, P = 115 kPa;
Har-vester with tires 6 × 6 model 1270, P = 70 kPa, and
For-warder with tires 8 × 8, model 1710, P = 105 kPa,
Clambunk model 1710, P = 60 kPa. The applied pressures P were extracted from the machine operation manuals. Soil sampling consisted of two stages:
Before harvest operations
To obtain the bearing capacity model, undisturbed soil samples (0.064 m of diameter and 0.0254 m of height) were collected at 0.10-0.125 m depth, summing up thirty-six samples for projects: Buriti, Dourado and São Leonardo, forty-eight for Imbaúbas, and twenty for: Água Suja Encosta, Água Suja baixada, Cajá Encosta, Cajá baixada and Carlos Hosken Encosta. The undisturbed soil samples of the projects Buriti, Dourado and São Leonardo were collected in the dry season and of the projects Aeroporto, Água Suja baixada, Água Suja Encosta, Cajá Baixada, Cajá Encosta, Carlos Hosken and Imbaúbas in the rainy season. Soil sampling was performed at this depth due to its highest penetration resistance.
These undisturbed soil samples were initially saturated in a tray with water up to 2/3 of the sample height for 24 hours and air dried in laboratory until the moisture content was in the range of 0.02 to 0.69 kg kg-1
and then used in the uniaxial compression test (Bowles, 1986). For the uniaxial compression tests the undisturbed soil samples were kept within the coring cylinders, which were placed into the compression cell and subsequently subjected to pressures 25, 50, 100, 200, 400, 800 and 1.600 kPa. Each pressure was applied until 90% of the maximum deformation was reached and then the pressure was in-creased to the next level. The 90% of maximum deforma-tion was determined by drawing a straight line through the data points of the initial part of the curve obtained when dial readings were plotted versus square root of the time, until this line intercepts the y axis (dial readings). A sec-ond straight line was drawn from this intersection with all abscissas 1.15 time as large as corresponding values on the first line. The intersection of this second line and the labo-ratory curve is the point corresponding to 90% consolida-tion (Taylor, 1948). From the soil compression curves the preconsolidation pressures (σ
p) were determined as a
func-tion of the moisture content (U) (Dias Junior & Pierce, 1995). Then, the regression analyses were accomplished using the software Sigma Plot 4.0 (Jandel Scientific) to obtain the bearing capacity model, which is the adjustment ofσ
p as a function of U. After that the comparison of the
regression equations was made using the procedure de-scribed in Snedecor & Cochran (1989).
After harvest operations and wood transport
To quantify the traffic effect due to harvest op-erations and wood transport on σ
p, undisturbed soil
samples of the same size as before were collected at
Table 1 - Particle size distribution of the Typic Acrustox (Orthic Ferralsol).
Project Clay Silt Sand Soil textural Class - - - g kg- 1
-Buritis 5001 80 420 Clay Dourado 500 90 410 Clay São Leonardo 400 90 510 Sandy clay Imbaúbas 550 90 360 Clay Aeroporto 660 130 210 Clay Água Suja Encosta 630 50 320 Clay
Água Suja Baixada 300 130 570 Sandy clay loam Cajá Encosta 620 70 310 Clay
Cajá Baixada 200 150 650 Sandy clay loam Carlos Hosken
0.10-0.125 m depth in 1999, 2000, 2001, and 2003, ac-cording to Table 2, and submitted to the uniaxial com-pression test as made previously (Bowles, 1986) with the moisture content at which the soil samples were collected (Table 3). The undisturbed soil samples were involved in
plastic, coated with paraffin and then stored at room tem-perature. After the completion of the uniaxial compres-sion test, σ
p was obtained according Dias Junior & Pierce
(1995) and the moisture content according Gardner (1986), and plotted as shown in Figure 2.
Table 2 - Number of undisturbed soil samples collected at the 0.10-0.125 cm depth in a Typic Acrustox after harvest operations and wood transport from 1999 to 2003.
1- F and S = Feller and Skidder 30.5L.32, 2- F and S II = Feller and Skidder 66.43.00.26, 3- H and F = Harvester and Forwarder, 4- M and F = Motorized Saw and Forwarder, 5- F and C = Feller and Clambunk, 6- M and M = Motorized Saw and Manual, 7- PA = Processing Area.
Project F and S
8 F and S9 H and F10 M and F11 F and C12 M and M13 PA14
Moisture Content (kg kg- 1)
2001
Buriti 0.291 0.301 0.281 - - -
-Dourado 0.351 0.351 0.351 - - -
-S.Leonardo 0.281 0.281 0.291 - - -
-Imbaúbas 0.332 - 0.322 0.333 - - 0.295
Aeroporto 0.381 - 0.361 0.334 - -
-Água Suja Encosta 0.266 - - 0.266 0.256 0.256 0.256
Água Suja Baixada 0.186 - - 0.216 0.236 - 0.166
Cajá Encosta 0.316 - - 0.276 0.306 0.296 0.306
Cajá Baixada 0.246 - - 0.226 0.236 0.226 0.156
Carlos Hosken Encosta 0.296 - - 0.286 0.286 0.286 0.296
2003
Buriti 0.301 0.301 0.291 0.301 - -
-Dourado 0.341 0.341 0.331 - - -
-S.Leonardo 0.291 0.281 0.281 0.311 - -
-Imbaúbas 0.292 - 0.272 0.303 - - 0.245
Aeroporto 0.371 - 0.371 0.374 - - 0.377
Água Suja Encosta 0.267 - - 0.267 0.247 0.267 0.247
Água Suja Baixada 0.177 - - 0.187 0.167 - 0.127
Cajá Encosta 0.237 - - 0.257 0.297 0.247
-Cajá Baixada 0.207 - - 0.187 0.187 0.197 0.177
Carlos Hosken Encosta 0.297 - - 0.297 0.237 0.317 0.257
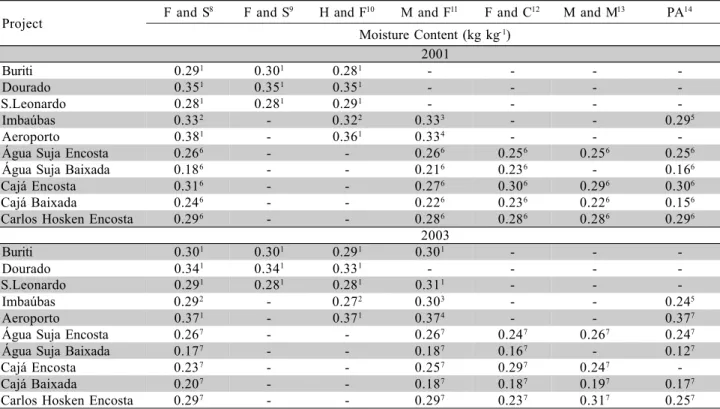
Table 3 - Moisture content at which the soil samples were collected in a Typic Acrustox at the 0.10-0.125 m depth after harvest operations and wood transport.
1- Average of 12 replications, 2- Average of 24 replications, 3- Average of 16 replications, 4- Average of 11 replications, 5- Average of 25 replications, 6- Average of 4 replications, 7- Average of 5 replications,– indicated that no measurement was done, 8- F and S = Feller Büncher (2618 with crawler) and Skidder with tires 30.5L.32, 9- F and S II = Feller Büncher (2618 with crawler) and Skidder (460 with tires 66.43.00.26), 10- H and F = Harvester (1270 with tires 700 × 26.5) and Forwarder (1710 with tires 750 × 26.5), 11- M and F = Motorized saw and Forwarder (636 with tires 650 × 26.5), 12- F and C = Feller and Clambunk, 13 - M and M = Motorized Saw and Manual, 14 - PA = Processing Area.
Project F and S1 F and S II2 H and F3 M and F4 F and C5 M and M6 PA7 1999 2003 1999 2003 1999 2003
Dry season
Buriti 12 5 12 5 12 5
Dourado 12 5 12 5 12 5
S.Leonardo 12 5 12 5 12 5
Rainy season
2000 2003 2000 2003 2000 2003 2000 2003
Imbaúbas 24 5 24 5 16 5 25 5
Aeroporto 12 5 12 5 12 5 5
2001 2003 2001 2003 2001 2003 2001 2003 2001 2003
Água Suja Encosta 4 5 4 5 4 5 4 5 4 5
Água Suja Baixada 4 5 4 5 4 5 4 5
Cajá Encosta 4 5 4 5 4 5 4 5 4
Cajá Baixada 4 5 4 5 4 5 4 5 4 5
RESULTS AND DISCUSSION
The harvest operations accomplished at the rainy season caused more increases in the initial soil bulk den-sity than those accomplished in the dry season, mainly in the wood processing areas during 2001 and 2003 (Table 4 and 5) indicating the importance of the mois-ture control at the time of the harvest operations.
The undisturbed soil samples collected before harvest operations were used to obtain the bearing capac-ity model of the Typic Acrustox which was of the type
σ
p = 10 (a + b U)
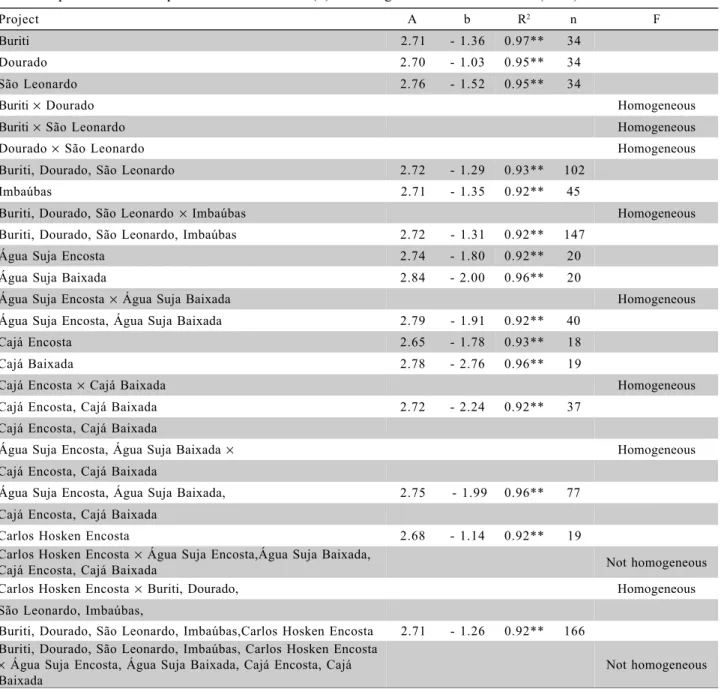
, with R2 significant at 1%. The estimated “a” and “b” values varied from 2.65 to 2.84, and from
-1.03 to -2.76, respectively (Table 6). The type of equa-tions was the same as Dias Junior (1994) and Dias Jun-ior & Pierce (1996).
The homogeneity tests of the equations (Snedecor & Cochran, 1989) indicated that there were two homo-geneous data groups. For the data of homohomo-geneous mod-els, a new equation was adjusted for (U, σ
p), obtaining
only one equation ofσ
p as a function of U (Table 6) for
each group. The two final equations, which are the bear-ing capacity models of the Typic Acrustox, are shown in Figure 1 and Table 7. Equation 1was used to evaluate the traffic effects on the Buriti, Dourado, São Leonardo, Imbaúbas and Carlos Hosken soils, and equation 2 was
Table 4 - Bulk density before (Dsi) and after (Dst) the harvest operations for of a Typic Acrustox at 0.10-0.125 m depth. 2001.
1- Average of 36 replications, 2- Average of 48 replications, 3- Average of 20 replications, 4- Average of 12 replications, 5- Average of 4 replications, 6- Average of 24 replications, 7- Average of 16 replications, 8 - Average of 11 replications, 9- Average of 25 replications and – indicated that no measurement was done, 10- F and S = Feller Büncher (2618 with crawler) and Skidder with tires 30.5L.32, 11- F and S II = Feller Büncher (2618 with crawler) and Skidder (460 with tires 66.43.00.26), 12- H and F = Harvester (1270 with tires 700 × 26.5) and Forwarder (1710 with tires 750 × 26.5), 13- M and F = Motorized saw and Forwarder (636 with tires 650 × 26.5), 14- F and C = Feller and Clambunk, 15- M and M = Motorized Saw and Manual, 16 - PA = Processing Area.
Project Before traffic F and S
10 F and S11 H and F12 M and F13 F and C14 M and M15 PA16
Dsi Dst
- - - k g dm-3 -Dry Season
Buriti 1.021 1.034 1.004 1.094 - - -
-Dourado 0.921 0.974 0.974 0.994 - - -
-S.Leonardo 1.041 1.125 1.084 1.124 - - -
-Rainy Season
Imbaúbas 1.012 1.236 - 1.226 1.127 - - 1.359
Aeroporto 0.984 0.974 - 1.074 1.138 - -
-Água Suja Encosta 1.133 1.285 - - 1.375 1.205 1.145 1.425
Água Suja Baixada 1.413 1.665 - - 1.545 1.515 - 1.595
Cajá Encosta 1.043 1.255 - - 1.215 1.215 1.005 1.305
Cajá Baixada 1.293 1.485 - - 1.575 1.525 1.385 1.635
Carlos Hosken Encosta 1.243 1.355 - - 1.355 1.405 1.305 1.355 Figure 1 - Bearing Capacity Models of the Typic Acrustox under
eucalyptus at 0.10-0.125 m depth, obtained using undisturbed soil samples collected before harvest operations.
0 100 200 300 400 500 600
Group 1. Buritis,Dourado, São Leonardo, imbaúbas and Carlos Hosken
Group 2. Água Suja encosta, Água Suja baixada, Cajá encosta and Cajá baixada
0.0 0.2 0.4 0.6 0.8
Group 1 Group 2
U (kg kg )-1
σp
(k
P
a
)
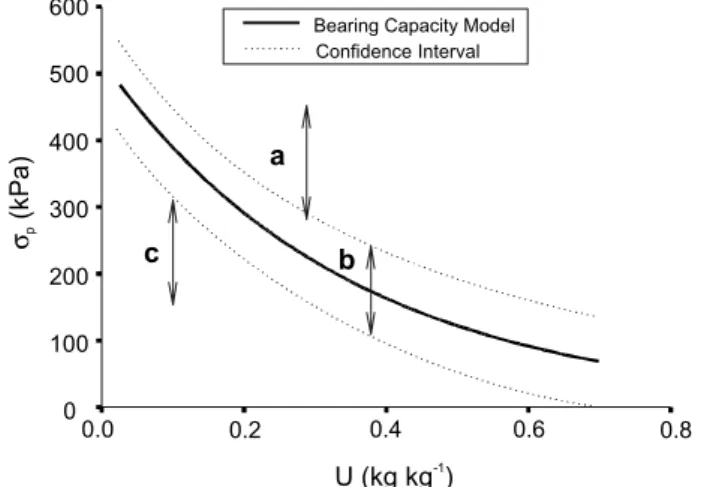
Figure 2 - Criteria used to analyze the effect of harvest operations and wood transport on the preconsolidation pressure of the Typic Acrustox under eucalyptus at 0.10-0.125 m depth.
a
b c
Bearing Capacity Model Confidence Interval
0 100 200 300 400 500 600
σp
(k
P
a
)
0.0 0.2 0.4 0.6 0.8
used for Água Suja encosta, Água Suja baixada, Cajá encosta and Cajá baixada.
In agriculture, the application of pressures larger than the largest pressure applied previously to the soil should be avoided in order to eliminate additional soil compaction (Gupta et al., 1989; Lebert & Horn, 1991; Imhoff et al., 2001). Considering that the preconsolidation pressure is an indicative of the maximum applied pres-sure to the soil in the past (Holtz & Kovacs, 1981; Dias Junior, 1994), Figure 1 was then divided into three re-gions to evaluate the traffic effects according to Dias Jun-ior (2003). The considered regions (Figure 2) are: a) the region where the preconsolidation pressure values deter-mined after the traffic are larger than the higher limit of the confidence interval, being considered as the region with additional soil compaction; b) the region where preconsolidation pressures determined after the traffic are between the higher and lower limits of the confidence in-tervals. Although, the soil samples in this region did not suffer soil compaction, this region indicates the soil samples that might suffer soil compaction in the next har-vest operations if the applied pressures are larger than the higher limit of the confidence interval, and c) a region where the preconsolidation pressure values determined after the traffic are smaller than the lower limit of the con-fidence interval.
According to the equationσ
p = 10
(2.71 – 1.26 U)
, the operations accomplished with Feller Büncher and Skidder with tires 66.43.00.26 in the dry season of 1999 (Table 8) presented in average a slight percentage of soil samples (8.3%) with larger preconsolidation pressure values
de-termined after the traffic in the region with additional soil compaction, in relation to the Feller Büncher and Skidder with tires 30.5L.32 (2.7%) and Harvester and Forwarder (5.7%). The low percentages can be explained by the fact that in the dry season the soil presents a higher resistance to compression and higher bearing capacity and therefore, the soil compaction processes were not evident (Dias Jun-ior, 2000). However, in the Dourado Project, those ma-chine groups caused greater soil compaction than in the Buritis and São Leonardo Projects, indicating that changes in the harvest operation strategy should be con-sidered.
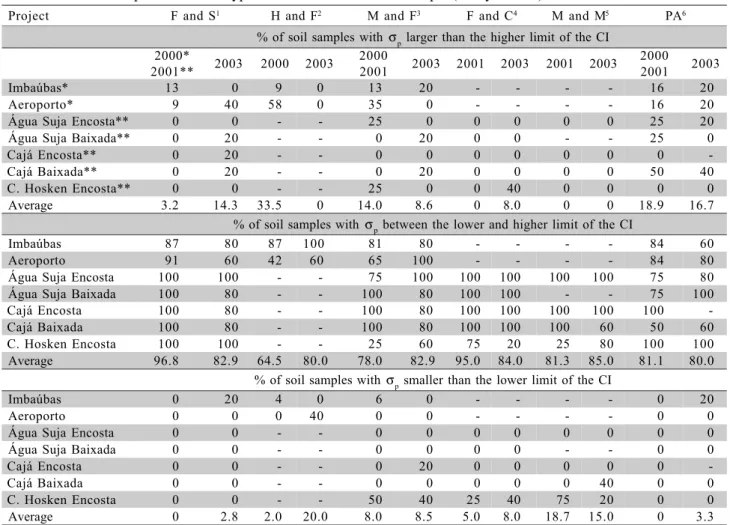
In the rainy season, the operations accomplished with Harvester and Forwarder (Table 9) were the ones that presented larger percentage of soil samples (33.5%) with preconsolidation pressure values determined after the traf-fic in the region with additional soil compaction, followed by the Processing Area (18.9%), being therefore, those operations the ones that caused greater soil compaction. The Aeroporto Project presented the highest percentage of soil samples (58%) with preconsolidation pressure val-ues in the region with additional soil compaction (Table 9). Although the operations made with Harvester and For-warder caused greater soil compaction in the rainy sea-son, one might consider that the traffic with those ma-chines is spatially restricted avoiding, therefore, the dis-semination of the soil compaction in the whole area.
On the other hand, all operations accomplished in the dry and rainy season in 1999, 2000 and 2001 caused a high percentage of soil samples with preconsolidation pressure values located in the region
Table 5 - Bulk density before (Dsi) and after (Dst) harvest operations for of a Typic Acrustox at 0.10-0.125 m depth. 2003.
1- Average of 36 replications, 2- Average of 48 replications, 3- Average of 20 replications, 4- Average of 24 replications, – indicated that no measurement was done, 5- F and S = Feller Büncher (2618 with crawler) and Skidder with tires 30.5L.32, 6- F and S II = Feller Büncher (2618 with crawler) and Skidder (460 with tires 66.43.00.26), 7- H and F = Harvester (1270 with tires 700 × 26.5) and Forwarder (1710 with tires 750 × 26.5), 8- M and F = Motorized saw and Forwarder (636 with tires 650 × 26.5), 9- F and C = Feller and Clambunk, 10- M and M = Motorized Saw and Manual, 11- PA = Processing Area.
Project Before traffic F and S
5F and S II6 H and F7 M and F8 F and C9 M and M10 PA11
Dsi Dst
- - - k g dm-3 -Dry season
Buritis 1.021 1.031 1.051 1.131 1.051 - -
-Dourado 0.921 0.881 0.951 0.991 - - -
-S.Leonardo 1.041 1.041 1.141 1.141 1.101 - -
-Imbaúbas 1.012 1.222 - 1.292 1.252 - - 1.312
Rainy season
Aeroporto 0.984 1.024 - 1.044 1.034 - - 1.054
Água Suja Encosta 1.133 1.313 - - 1.213 1.303 1.113 1.513
Água Suja Baixada 1.413 1.613 - - 1.593 1.683 - 1.643
Cajá Encosta 1.043 1.283 - - 1.143 1.143 1.013
-Cajá Baixada 1.293 1.533 - - 1.553 1.533 1.273 1.563
Table 6 - Parameters of the bearing capacity model (σ
p = 10
(a + b U)), with respective determination coefficients (R2), and
number of undisturbed soil samples (n) collected at 0.10-0.125 cm depth in a Typic Acrustox, before harvest operations and comparison of those models (F) according to Snedecor & Cochran (1989).
Table 7 - Coefficients “a” and “b” of the equation σ
p = 10 (a + b U),
standard error and p values.
Coefficient Standard Error p
Buriti, Dourado, São Leonardo, Imbaúbas and Carlos Hosken (n = 166)
a 2.71 0.0065 < 0.0001
b - 1.26 0.0323 < 0.0001
Água Suja encosta, Água Suja baixada, Cajá encosta and Cajá baixada (n = 77)
a 2.75 0.0175 < 0.0001
b - 1.99 0.1126 < 0.0001
Project A b R2 n F
Buriti 2.71 - 1.36 0.97** 34
Dourado 2.70 - 1.03 0.95** 34
São Leonardo 2.76 - 1.52 0.95** 34
Buriti× Dourado Homogeneous
Buriti× São Leonardo Homogeneous
Dourado× São Leonardo Homogeneous
Buriti, Dourado, São Leonardo 2.72 - 1.29 0.93** 102
Imbaúbas 2.71 - 1.35 0.92** 45
Buriti, Dourado, São Leonardo × Imbaúbas Homogeneous
Buriti, Dourado, São Leonardo, Imbaúbas 2.72 - 1.31 0.92** 147
Água Suja Encosta 2.74 - 1.80 0.92** 20
Água Suja Baixada 2.84 - 2.00 0.96** 20
Água Suja Encosta × Água Suja Baixada Homogeneous
Água Suja Encosta, Água Suja Baixada 2.79 - 1.91 0.92** 40
Cajá Encosta 2.65 - 1.78 0.93** 18
Cajá Baixada 2.78 - 2.76 0.96** 19
Cajá Encosta × Cajá Baixada Homogeneous
Cajá Encosta, Cajá Baixada 2.72 - 2.24 0.92** 37
Cajá Encosta, Cajá Baixada
Água Suja Encosta, Água Suja Baixada × Homogeneous
Cajá Encosta, Cajá Baixada
Água Suja Encosta, Água Suja Baixada, 2.75 - 1.99 0.96** 77
Cajá Encosta, Cajá Baixada
Carlos Hosken Encosta 2.68 - 1.14 0.92** 19
Carlos Hosken Encosta × Água Suja Encosta,Água Suja Baixada,
Cajá Encosta, Cajá Baixada Not homogeneous
Carlos Hosken Encosta × Buriti, Dourado, Homogeneous
São Leonardo, Imbaúbas,
Buriti, Dourado, São Leonardo, Imbaúbas,Carlos Hosken Encosta 2.71 - 1.26 0.92** 166 Buriti, Dourado, São Leonardo, Imbaúbas, Carlos Hosken Encosta
× Água Suja Encosta, Água Suja Baixada, Cajá Encosta, Cajá Baixada
Not homogeneous
where the preconsolidation pressure values determined after the traffic are between the higher and lower limits of the confidence intervals (Tables 8 and 9). This region is important because it shows the possibility of soil com-paction to occur in the next mechanized operation, if the bearing capacity and the appropriated soil moisture con-tent are not considered in operation planning.
val-Table 8 - Classification of the soil samples according Figure 2, using the preconsolidation pressure values determined after the harvest operations for a Typic Acrustox at 0.10-0125 m depth (Dry Season).
1- F and S = Feller and Skidder with tires 30.5L.32, 2 - F and S II = Feller and Skidder with tires 66.43.00.26, 3 - H and F = Harvester e Forwarder. CI = Confidence Interval.
Project F and S1 F and S II2 H and F3
1999 2003 1999 2003 1999 2003
% of soil samples with σ
p larger than the higher limit of the CI
Buritis 0 0 0 0 0 20
Dourado 8 0 17 0 17 0
S.Leonardo 0 0 8 0 0 0
Average 2.7 0 8.3 0 5.7 6.7
% of soil samples with σ
p between the lower and higher limit of the CI
Buritis 75 80 83 20 75 40
Dourado 92 100 83 100 66 100
S.Leonardo 83 40 84 0 100 40
Average 83.3 73.3 83.3 40 80.3 60
% of soil samples with σ
p smaller than the lower limit of the CI
Buritis 25 20 17 80 17 40
Dourado 0 0 0 0 17 0
S.Leonardo 17 60 8 100 0 60
Average 14.0 26.7 8.4 60 14.0 33.3
Table 9 - Classification of the soil samples, according Figure 2, using the preconsolidation pressure values determined after the harvest operations for a Typic Acrustox at 0.10-0.125 m depth (Rainy Season).
1- F and S = Feller and Skidder with tires 30.5L.32, 2- H and F = Harvester and Forwarder, 3- M and F = Motorized saw and Forwarder, 4- F and C = Feller and Clambunk, 5- M and M = Motorized saw and Manual, 6- PA = Processing area, - indicated that no measurement was done. * = soil sampling in 2000, ** = soil sample in 2001. CI = Confidence Interval.
Project F and S1 H and F2 M and F3 F and C4 M and M5 PA6
% of soil samples with σ
p larger than the higher limit of the CI 2000*
2001** 2003 2000 2003
2000
2001 2003 2001 2003 2001 2003
2000
2001 2003
Imbaúbas* 13 0 9 0 13 20 - - - - 16 20
Aeroporto* 9 40 58 0 35 0 - - - - 16 20
Água Suja Encosta** 0 0 - - 25 0 0 0 0 0 25 20
Água Suja Baixada** 0 20 - - 0 20 0 0 - - 25 0
Cajá Encosta** 0 20 - - 0 0 0 0 0 0 0
-Cajá Baixada** 0 20 - - 0 20 0 0 0 0 50 40
C. Hosken Encosta** 0 0 - - 25 0 0 40 0 0 0 0
Average 3.2 14.3 33.5 0 14.0 8.6 0 8.0 0 0 18.9 16.7 % of soil samples with σ
p between the lower and higher limit of the CI
Imbaúbas 87 80 87 100 81 80 - - - - 84 60
Aeroporto 91 60 42 60 65 100 - - - - 84 80
Água Suja Encosta 100 100 - - 75 100 100 100 100 100 75 80 Água Suja Baixada 100 80 - - 100 80 100 100 - - 75 100 Cajá Encosta 100 80 - - 100 80 100 100 100 100 100
-Cajá Baixada 100 80 - - 100 80 100 100 100 60 50 60
C. Hosken Encosta 100 100 - - 25 60 75 20 25 80 100 100 Average 96.8 82.9 64.5 80.0 78.0 82.9 95.0 84.0 81.3 85.0 81.1 80.0
% of soil samples with σ
p smaller than the lower limit of the CI
Imbaúbas 0 20 4 0 6 0 - - - - 0 20
Aeroporto 0 0 0 40 0 0 - - - - 0 0
Água Suja Encosta 0 0 - - 0 0 0 0 0 0 0 0
Água Suja Baixada 0 0 - - 0 0 0 0 - - 0 0
Cajá Encosta 0 0 - - 0 20 0 0 0 0 0
-Cajá Baixada 0 0 - - 0 0 0 0 0 40 0 0
C. Hosken Encosta 0 0 - - 50 40 25 40 75 20 0 0
ues, determined after the traffic, smaller than the lower limit of the confidence interval (Tables 8 and 9), being these operations the ones that caused less soil compac-tion.
Considering that a reduction in the preconsolidation pressure values is an indicator of soil structure recover (Dias Junior, 2003), the preconsolidation pressures were then measured in 2003 in the soil samples collected at the same sites as they were collected in 1999, 2000 and 2001, to verify whether there was some natu-ral recover of the soil structure indicated by a decrease in the percentage of soil samples with preconsolidation pressure values in the region with additional soil com-paction or an increase in a percentage of soil samples with preconsolidation pressure values in the region where the preconsolidation pressure values determined after the traf-fic are smaller than the lower limit of the confidence in-terval. The preconsolidation pressure values measured in 2003 indicated that a natural recovery of the soil struc-ture happened for all harvest operations made in the dry season and in the rainy season for the Harvester and For-warder, Motorized Saw and Forwarder and Processing Area. This interpretation was applied for the regarded soil depth of 0.1-0.125 m, which is very close to the soil sur-face. For deeper layers, one should be aware of the crush-ing of aggregates by compaction that can lead to a re-duction of the preconsolidation pressure, which cannot be regarded as a structural recovery process.
Finally, the results obtained for the operations in the dry and rainy seasons might serve as an alert on the importance of knowing the soil bearing capacity at a spe-cific moisture condition, in order to avoid soil compac-tion, mainly, when the harvest operations are accom-plished in the rainy season. Thus, this model may be used as an auxiliary criterion in planning the harvest opera-tions according to the soil bearing capacity which can be done by scheduling the operations or reducing the applied mechanical loads.
CONCLUSIONS
The traffic effects on the preconsolidation pres-sure in the dry season indicated that the soil compaction process was neither evident nor important.
The traffic effects on the preconsolidation pres-sure in the rainy season indicated that operations made with Harvester and Forwarder caused greater soil com-paction, while the operations performed with Motorized Saw and Manual caused less soil compaction.
ACKNOWLEDGMENTS
To CNPq for the Productivity Research Grant and to CENIBRA for the financing support of this research.
REFERENCES
ARVIDSSON, J. Subsoil compaction caused by heavy sugarbeet harvesters in southern Sweden I. Soil physical properties and crop yield in six field experiments.Soil & Tillage Research, v.60, p.67-78, 2001. ARVIDSSON, J. Subsoil compaction by heavy sugarbeet harvesters in
southern Sweden III. Risk assessement using a soil water model. Soil & Tillage Research, v.73, p.77-87, 2003.
BOWLES, J.E. Engineering properties of soils and their measurements. 3.ed. New York: McGraw-Hill, 1986. 218p.
CANILLAS, E.C.; SALOKHE, V.M. A decision support system for compaction assessment in agricultural soils. Soil & Tillage Research, v.65, p.221-230, 2002.
DEFOSSEZ, P.; RICHARD, G. Models of soil compaction due to traffic and their evaluation. Soil & Tillage Research, v.67, p.41-64, 2002. DIAS JUNIOR, M.S. Compression of three soils under long-term tillage
and wheel traffic. East Lansing: Michigan State University, 1994. 114p. (Ph.D. - Dissertation).
DIAS JUNIOR, M.S. Compactação do solo. In: NOVAIS, R.F.; ALVAREZ V., V.H.; SCHAEFER, C.E.G.R. (Ed.).Tópicos em ciência do solo. Viçosa: SBCS, 2000. p.55-94.
DIAS JUNIOR, M.S. A soil mechanics approach study soil compaction In: ACHYUTHAN, H. (Ed.). Soil and soil physics in continental environment. Chenna: Allied Publishers Private, 2003. p.179-199. DIAS JUNIOR, M.S.; PIERCE, F.J. A simple procedure for estimating
preconsolidation pressure from soil compression curves. Soil Technology, v.8, p.139-151, 1995.
DIAS JUNIOR, M.S.; PIERCE, F.J. Revisão de literatura: O processo de compactação do solo e sua modelagem. Revista Brasileira de Ciência do Solo, v.20, p.175-182, 1996.
DIAS JUNIOR, M.S.; FERREIRA, M.M.; FONSECA, S.; SILVA, A.R.; FERREIRA, D.F. Avaliação quantitativa da sustentabilidade estrutural dos solos em sistemas florestais na região de Aracruz – ES.Revista Árvore, v.23, p.371-380, 1999.
DIAS JUNIOR, M.S.; GOMES, A.N.; ANDRADE, S.C.; AZEVEDO, M.R. Avaliação da sustentabilidade da estrutura de Argissolos em sistemas florestais.Revista Cerne, v.8, p.103-114, 2002.
DIAS JUNIOR, M.S.; LEITE, F.P.; WINTER, M.E.; PIRES, J.V.G. Avaliação quantitativa da sustentabilidade estrutural de um Latossolo Amarelo cultivado com eucalipto na Região de Peçanha - MG. Revista Árvore, v.27, p.343-349, 2003.
GARDNER, W.H. Water content. In: KLUTE, A. (Ed.) Methods of soil analysis. Part 1. 2.ed. Madison: ASA, 1986. p.493-544.
GUPTA, S.C.; HADAS, A.; SCHAFER, R.L. Modeling soil mechanical behavior during compaction. In: LARSON, W.E.; BLAKE, G.R.; ALLMARAS, R.R.; VOORHEES, W.B.; GUPTA, S.C. (Ed.) Mechanics and related processes in structured agricultural soils. Dordrecht: Kluwer Academic Publishers, 1989. p.137-152.
HOLTZ, R.D.; KOVACS, W.D. An introduction to geotechnical engineering. Prentice-Hall: Englewood Cliffs, 1981. 733p.
HORN, R.; FLEIGE, H. A method for assessing the impact of load on mechanical stability and on physical properties of soils. Soil & Tillage Research, v.73, p.89-99, 2003.
HORN, R.; WAY, T.; ROSTEK, J. Effect of repeated tractor wheeling on stress/strain properties and consequences on physical properties in structured arable soils. Soil & Tillage Research, v.73, p.101-106, 2003. IMHOFF, S.; SILVA, A.P.; DIAS JUNIOR, M.S.; TORMENA, C.A. Quantificação de pressões para o crescimento das plantas. Revista Brasileira de Ciência do Solo, v.25, p.11–18, 2001.
LEBERT, M.; HORN, R. A method to predict the mechanical strength of agricultural soils. Soil & Tillage Research, v.19, p.275-286, 1991. SNEDECOR, G.W.; COCHRAN, W.G. Statistical methods. 8.ed. Ames:
Iowa State University Press, 1989. 503p.
TAYLOR, D.W. Fundamentals of soil mechanics. New York: John Wiley & Sons, 1948. 700p.