, v.59, n.4, p.789-793, out./dez. 2002
MORE ADEQUATE PROBABILITY DISTRIBUTIONS TO
REPRESENT THE SATURATED SOIL
HYDRAULIC CONDUCTIVITY
1,2Maria da Glória Bastos de Freitas Mesquita3,5*; Sérgio Oliveira Moraes4; José Eduardo Corrente4
3
Depto. de Ciência do Solo - UFLA, C.P. 37 - CEP: 37200-000 - Lavras, MG.
4
Depto de Ciências Exatas - USP/ESALQ, C.P. 09 - CEP: 13418-900 - Piracicaba, SP.
5
CAPES/PICDT Fellow.
*Corresponding author <mgbastos@ufla.br>
ABSTRACT: The saturated soil hydraulic conductivity (Ksat) is one of the most relevant variables in studies of water and solute movement in the soil. Its determination in the laboratory and in the field yields high dispersion results, which could be an indication that this variable has a no symmetrical distribution. Adjustment of the normal, lognormal, gamma and beta distributions were examined in order to search for a probability were density function that would more adequately describe the distribution of this variable. The experiment consisted in determining the saturated hydraulic conductivity, through the constant head permeameter method, in undisturbed samples of three soils of different textures from the central western region of the São Paulo State, Brazil, and submitting the results to the statistical tests for identification of the most adequate asymmetrical distribution to represent them. Ksat presented high variability, non normal distribution and lognormal, gamma and beta distributions fit. The lognormal probability density function was the most indicated to describe the variable, due to the verified greater agreement.
Key words: water movement, variability, probability functions
DISTRIBUIÇÕES DE PROBABILIDADE MAIS ADEQUADAS PARA
REPRESENTAR A CONDUTIVIDADE HIDRÁULICA
SATURADA DO SOLO
RESUMO: A condutividade hidráulica saturada do solo (Ksat) é uma das variáveis de maior relevância para estudos de movimento de água e solutos no solo. Sua determinação em laboratório e campo produz resultados com elevada dispersão, o que pode indicar que esta variável não possui distribuição simétrica. Com o objetivo de buscar uma função densidade de probabilidade que mais adequadamente descreva a distribuição desta variável verificou-se o ajuste das distribuições normal, lognormal, gama e beta. O experimento consistiu em determinar-se a condutividade hidráulica saturada, pelo método do permeâmetro de carga constante, em amostras indeformadas de três solos com diferentes texturas da região centro-oeste do estado de São Paulo, e submeter os resultados a testes estatísticos para identificação da distribuição assimétrica mais adequada para representá-los. A Ksat apresentou alta variabilidade, não normalidade na distribuição e um ajuste às distribuições lognormal, gama e beta. A função densidade de probabilidade lognormal foi a mais indicada para descrever os dados da variável, devido à maior concordância verificada.
Palavras-chave: movimento de água, variabilidade, funções de probabilidade
1
Part of the Thesis of the first author, presented to USP/ESALQ - Piracicaba, SP, Brazil.
2Paper presented in the 46ª Reunião Anual da Região Brasileira da Sociedade Internacional de Biometria and 9º Simpósio de Estatística
Aplicada à Experimentação Agronômica, USP/ESALQ - Piracicaba, SP, 2001.
INTRODUCTION
The lack, or inadequacy of information on variables related to water and solute flow in soils makes the rational use of agricultural resources a difficult endeavor. Among the variables that interfere with this flow, a very prominent one is the hydraulic conductivity (K), which represents the facility of the soil in transmitting water. In a general sense, the greater the hydraulic conductivity, the easier for the water to move from one site to another. Its maximum value is
reached when the soil is saturated, and then it is referred to as the saturated hydraulic conductivity (Reichardt, 1990).
It is possible to determine the soil hydraulic conductivity based on the saturated hydraulic conductivity (Ksat) and by using mathematical models, thus being able to follow water and solute movement.
, v.59, n.4, p.789-793, out./dez. 2002
problem consists in finding a probability function that minimizes this estimation error. The normal distribution
is, a priori, the generally adopted solution but, if data does
not follow this distribution the result can lead to erroneous conclusions. Only when frequency distributions are analyzed, quantitative results can be obtained more safely (Biggar & Nielsen, 1976).
In relation to Ksat, their distribution can adjust to the gamma and beta functions (Moura et al., 1999), and also to the lognormal distribution (Logston et al., 1990, Mohanty et al., 1991, Jarvis & Messing, 1995 and Clausnitzer et al., 1998), which justifies a more detailed study about the adequacy of these distributions, enabling a better characterization of the Ksat variable, as well as its representative parameters.
The objective of this study is to present an analysis on the characterization of the soil saturated hydraulic conductivity, based on data adjustments to fit to the gaussian, lognormal, gamma and beta density probability functions, in order to indicate the best to represent this variable measured in a given area.
MATERIAL AND METHODS
Three soils of different textural classes were used in this study: a Typic Hapludox (LVAd), sandy-clayey texture; a Rhodic Hapludox (LVdf), very sandy-clayey texture; and a Typic Quartzipsament (RQo), sandy texture. The soils came from the central western region of the State of São Paulo, Brazil, at 22° 41’ South latitude, 47° 39’ West longitude, and 550 m above sea level, approximately. Undisturbed samples were collected from the 0 to 0.20 m soil layer, by using a Uhland-type sampler, with a metal cylinder having mean diameter and height of 72 mm. Seventy samples were collected from soil 1, and 30 samples from soils 2 and 3.
The saturated hydraulic conductivity was determined by using the constant head permeameter method (Youngs, 1991), with distilled and de-aerated water, according to Faybishenko (1995) and Moraes (1991). Three Ksat determination replicates were considered for each sample, thus allowing the arithmetic mean to be used.
T h e s t a t i s t i c a l a n a l y s e s c o n s i s t e d o f a descriptive study of the data (Clark & Hosking, 1986), followed by the Kolmogorov-Smirnov test and graphical analyses of the normal, lognormal, gamma and beta distributions fit (Isaaks & Srivastava, 1989), and finalizing with robust techniques to model comparisons as discussed by Zacharias et al. (1996) and Sentelhas et al. (1997).
The UMVUE (Uniformly Minimum Variance Unbiased Estimators) method was utilized to calculate the lognormal distribution parameters, as recommended by Parkin et al. (1988), and the methodology indicated by Parkin et al. (1990) was used to calculate the confidence limits.
RESULTS AND DISCUSSION
The difference between mean and median values of Ksat was substantial (Table 1). For the LVAd, the mean is nearly 25% greater than the median, for the LVdf approximately 75% greater and for the RQo 14% greater. These observations evidence a greater dispersion relative to position measurements. Ksat is characterized as possessing high variability (Warrick & Nielsen, 1980; Kutilek & Nielsen, 1994), having high coefficients of variation, as found in this experiment.
The high and positive value of the coefficient of asymmetry demonstrates that the distribution is non-symmetrical. This is enough per se to characterize the distribution as nonnormal. This condition is further reinforced by the high coefficient of kurtosis, greater than three the reference value for normal distribution.
Once the nonnormality of the data has been demonstrated, a different distribution that describes the property must be sought for. The Kolmogorov-Smirnov test was applied to other asymmetrical distributions cited in the literature in order to verify, among them, which is the most indicated; according to this test, it was verified that the probability of the data being distributed following a normal is less than 1% (P < 0.01**) for LVAd and RQo, and less than 5% (P < 0.05*) for LVdf, reassuring that the data does not follow the assumptions required by the normal distribution, i.e., they do not have the necessary characteristics to be considered as normally distributed
Table 1- Descriptive statistics for the Ksat variable for the soils under study.
Soils: LVAd = Typic Hapludox; LVdf = Rhodic Hapludox; RQo = Typic Quartzipsament.
Statistic Soil
LVAd LVdf RQo
Number of sample 7 0 3 0 3 0
Mean (m s- 1) 0.0157 x 10- 2 0.0046 x 10- 2 0.0107 x 10- 2
Median (m s- 1) 0.0125 x 10- 2 0.0026 x 10- 2 0.0094 x 10- 2
Standard Deviation (m s- 1) 0.0118 x 10- 2 0.0049 x 10- 2 0.0059 x 10- 2
Coefficient of Variation (%) 7 5 109 5 5
Coefficient of Asymmetry 2.562 1.8140 1.4109
, v.59, n.4, p.789-793, out./dez. 2002
regardless of the type of soil studied and, therefore, this distribution cannot be considered as representative of the variable.
The differences between the observed and the expected results relative to the lognormal, gamma and beta distributions were not significant for soils LVAd, LVdf and RQo, i.e., they do adjust to these probability distributions, according to Kolmogorov-Smirnov test.
The fact that the three distributions can represent the samples leads us to discuss other criteria in order to decide in favor of one particular distribution, and therefore, obtain the parameters necessary to represent the variable. One immediate criterion is the facility by which the data can be understood/operationalized by the chosen specific distribution. By this criterion, the beta distribution is the most complex in its basic foundation, presenting greater difficulty for data manipulation and parameter calculation; therefore, its use becomes less desirable for the practical purposes of obtaining information to be applied in agricultural projects. For these reasons and because of the greater differentiation relative to the observed data, expressed by the difference found with the Kolmogorov-Smirnov test, we decided to disconsider this distribution as an option to express the Ksat distribution.
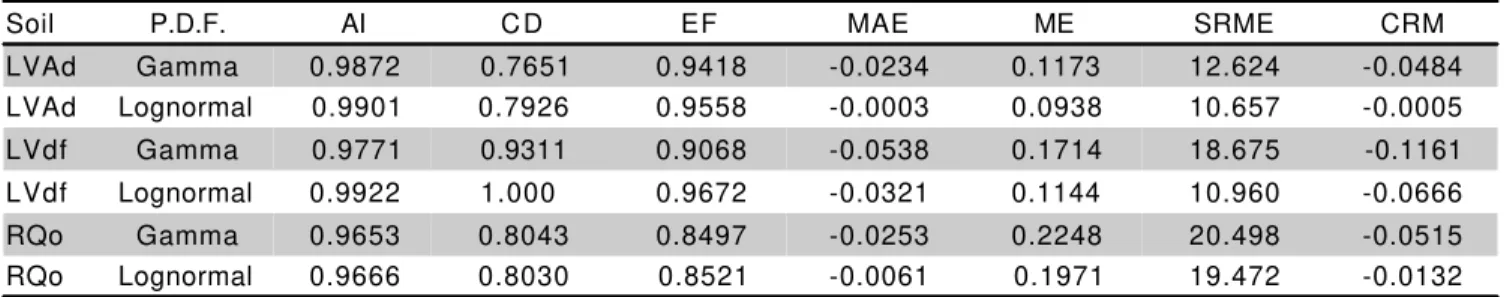
Left with the lognormal and gamma distributions, the first one being frequently cited in the literature, and the second mentioned in recent projects as the work by Moura et al. (1999), the next criterion to decide between these two distributions would be the use of robust techniques, according to Zacharias et al. (1996) and Sentelhas et al. (1997), verifying the agreement between the theoretical Ksat distribution and the lognormal and gamma distributions, according to probabilities of occurrence estimated in each case (Table 2). According to these techniques, the agreement index (AI), the coefficient of determination (CD) and the efficiency (EF) should be equal to 1, and the mean absolute error (MAE), the maximum error (ME), the coefficient of residual mass (CRM) and the square root of the normalized quadratic mean error (SRME) should be equal to zero for a 100% agreement between observed values and values anticipated by the adopted distribution model.
The lognormal probability density function presented a value of AI closest to 1, the same happening with CD and EF, while MAE, ME, CRM and SRME were closer to zero as compared to the respective coefficients of the gamma distribution (Table 2). This allows us to conclude that the data adjustment was better to the lognormal distribution.
The gamma probability density function presented values of AI, CD and EF near one; however, the difference between these coefficients and the reference one was greater as compared to those of the lognormal probability density function. MAE was much greater for the gamma distribution when compared to the lognormal, which indicates that the gamma distribution, even not being significantly different by Kolmogorov-Smirnov test, is less close to the observed data than the lognormal. This is also evidenced by the CRM which, even being close to zero, is greater than the CRM for the lognormal distribution. ME and SRME were similar to those determined for the lognormal, but greater. This allows us to conclude that the data adjustment was better to the lognormal distribution.
Once the most adequate function to represent the distribution for the three soils has been defined, the rest of the discussion is restricted to the soil with intermediate texture (LVAd) to avoid unnecessary repetition, since the same comments are applicable to the other two soils. Figures 1a and 2a show, respectively, the frequency histogram, the lognormal probability curve, and the QQ-plot chart for visual inspection of adequacy of the lognormal distribution to represent the Ksat distribution for the LVAd, with Figures 1b and 2b showing the same for the gamma distribution. The lognormal distribution provides a better coverage of the area represented by the histogram bars when compared to the gamma distribution (Figures 1a and b), supporting the previous calculations with the Kolmogorov-Smirnov test and the various comparative indices shown in Table 2.
Even though the QQ-plot is a recommended technique to compare distributions, the visual inspection of Figures 2a and b does not show differences as clear as those observed between Figures 1a and b. The use of a single criterion to decide over the adequacy of distributions can be rather unsatisfactory. In this project,
Soil P.D.F. AI C D EF MAE ME SRME CRM
LVAd Gamma 0.9872 0.7651 0.9418 -0.0234 0.1173 12.624 -0.0484
LVAd Lognormal 0.9901 0.7926 0.9558 -0.0003 0.0938 10.657 -0.0005
LVdf Gamma 0.9771 0.9311 0.9068 -0.0538 0.1714 18.675 -0.1161
LVdf Lognormal 0.9922 1.000 0.9672 -0.0321 0.1144 10.960 -0.0666
RQo Gamma 0.9653 0.8043 0.8497 -0.0253 0.2248 20.498 -0.0515
RQo Lognormal 0.9666 0.8030 0.8521 -0.0061 0.1971 19.472 -0.0132
Table 2 - Robust techniques for model comparison for the Ksat variable (m s-1), for the soils under study.
, v.59, n.4, p.789-793, out./dez. 2002
the set of utilized criteria, Kolmogorov-Smirnov, graphical, and by robust techniques, establishes without question the superiority of the lognormal distribution under these statistical criteria.
In addition, the fit function depends on the precision of estimation of parameters α e β, which are directly linked to the shape of distribution of the observed values; this makes the gamma distribution difficult to use. The occurrence of soil properties with nonnormal distribution is common, and statistical procedures have been applied without the complete attention required by their foundation and limitations (Menk & Nagai, 1983). Many times, data are accepted as being normally distributed without appropriate questioning. In the present case, it would be equivalent to accepting the mean, median and standard deviation values presented in Table 1, which were obtained based on the normal distribution, but since the observed Ksat data are not normally
distributed, those values cannot be used; otherwise they can lead to errors in the formulated conclusions.
Parkin et al. (1988) and Parkin & Robinson (1992), evaluating sample data estimation methods for a lognormal population, concluded that the UMVUE method yields estimates with least errors. By this method, the characteristic values observed for Ksat, considering them lognormally distributed, are: mean 0.0157 x 10⁻² m s-1, median 0.0127 x 10⁻² m s-1, standard deviation 0.0114 x 10⁻² m s-1, coefficient of variation 73%, lower and upper limits for the confidence interval of the mean (95%) 0.0127 x 10⁻² m s-1 and 0.0175 x 10⁻² m s-1, respectively. These parameters should then be analyzed, and utilized in the future as statistical parameters for the variable.
If the sampling values are lognormally distributed we must choose, among the position parameters (mean and median), the one which is to be used as a statistical summary, because the values are not the same and Figure 1 - (a) Lognormal and (b) Gamma Frequency Histograms and Probability Curves for the Ksat variable, (10-2
m s-1
), Typic Hapludox (LVAd).
Figure 2 - (a) Lognormal Distribution and (b) Gamma Distribution Adjustment Chart for the Ksat variable, (10-2 m s-1), Typic Hapludox (LVAd).
Número de Observações
0 5 10 15 20 25 30 35 40 45
0,00 0,02 0,04 0,06 0,08 0,10 0,12
Classes of Frequencie Lognormal Distribution
Number of Odservations
Número de Observações
0 5 10 15 20 25 30 35 40 450,00 0,02 0,04 0,06 0,08 0,10 0,12
Classes of Frequencie Gama Distribution
Number of Odservations
-0,01 0,00 0,01 0,02 0,03 0,04 0,05 0,06 0,07
-2 0 2 4 6 8 10 12
QQ Plot - Ksat - Lognormal Distribution
Observed ed Values
Lognormal Quantiles Gamma Quantiles
-0,01 0,00 0,01 0,02 0,03 0,04 0,05 0,06 0,07
-1 0 1 2 3 4 5 6
QQ Plot - Ksat - Gamma Distribution
, v.59, n.4, p.789-793, out./dez. 2002
provide diverse information about the distribution (Parkin & Robinson, 1992). The mean represents the gravity center of the distribution, while the median is the center of probabilities. Choosing the appropriate measurement is critical because it can deeply affect the conclusions. For the mean and the median shown above, if the choice falls on the mean, this value will be 19.1% greater [(0.0157 x 10⁻² – 0.0127 x 10-2) * 100 / 0.0157 x 10-2 = 19.1%] than if the median were chosen. Obviously, the project coordinator will have to make a decision on which cost/benefit ratio is the most adequate, considering, this difference of 19% for Ksat alone.
The choice between using the mean or the median is arbitrary, and since the definition of “best” is dependent upon the nature of the phenomenon to be investigated and the objective of the study, it is necessary to analyze the problem globally.
One of the contributions where this question is discussed is that of Parkin & Robinson’s (1992), which state that when the variable of interest is randomly dispersed, collecting a greater number of samples has the same effect over the mean value as collecting a smaller number, whereas the population median is dependent upon the number of samples collected. Due to this effect, choosing the median could be appropriate only when the samples keep some degree of dependence among themselves. This implies that in systems where the number of samples is usually arbitrarily defined, the median could not be appropriate to estimate the population parameter. In soil studies, it can be inappropriate to describe data in terms of their median, unless the number of samples is specified as well, i.e., it is necessary to consider the size and number of samples analyzed and the values obtained for the mean and the median, which allows for a choice based on the relations between the characteristics of the area and the values obtained. Therefore, using the median is recommended when the data on their own and as individuals, possess an identity and are dependent among themselves.
Mohanty et al. (1991) add to this information, maintaining that the median behaves more like a “representative of the soil”, of the results of the assemblage of a smaller area, with homogeneous characteristics. In order to use the median, samples must be treated as separate individuals and the information must be aim at separating the samples into classes, i.e., they should show the differentiation between individuals. The limits for the confidence interval of the mean, according to Parkin et al. (1988), can be better characterized when the method proposed by these authors is utilized.
CONCLUSION
The lognormal probability density function is best indicated to describe the data related to the soil property labeled as saturated hydraulic conductivity.
REFERENCES
ASSIS, F.N.; ARRUDA, H.V.; PEREIRA, A.R. Aplicações de estatística à climatologia: teoria e prática. Pelotas: UFPel, 1996. 161p.
BIGGAR, J.W.; NIELSEN, D.R. Spatial variability of the leaching characteristics of a field soil. Water Resources Research, v.12, p.78-84, 1976. CLARK, W.A.V.; HOSKING, P.L. Statistical methods for geographers. New
York: John Wiley, 1986. 518p.
CLAUSNITZER, V.; HOPMANS, W.; STARR, J.L. Parameter uncertainty analysis of common infiltration models. Soil Science Society of America Journal, v.62, p.1477-1487, 1998.
FAYBISHENKO, B.A. Hydraulic behavior of quasi-saturated soils in the presence of entrapped air: laboratory experiments. Water Resources Research, v.31, p.2421-2435, 1995.
ISAAKS, E.H.; SRIVASTAVA, R.M. An introdution to applied geostatistics. New York: Oxford University Press, 1989. 560p.
JARVIS, N.J.; MESSING, I. Near-saturated hydraulic conductivity in soils of contrasting texture measured by tension infiltrometers. Soil Science Society of America Journal, v.59, p.27-34, 1995.
KUTILEK, M.; NIELSEN, D.R. Soil hydrology. Berlin: Catena Verlag, 1994. 370p.
LOGSTON, S.D.; ALLMARAS, R.R.; WU, L.; SWAN, J.B.; RANDALL, G.W. Macroporosity and its relation to saturated hydraulic conductivity under different tillage practices. Soil Science Society of America Journal, v.54, p.1096-1101, 1990.
MENK; J.R.F.; NAGAI, V. Estratégia para caracterizar a variabilidade de dados de solos com distribuição não-normal. Revista Brasileira de Ciência do Solo, v.7, p.311-316, 1983.
MOHANTY, B.P.; KANVAR, R.S.; HORON, R. A robust-resistant approach to interpret spatial behavior of saturated hydraulic conductivity of a glacial-till soil under no-glacial-tillage system. Water Resources Research, v.27, p.2979-2992, 1991.
MORAES, S.O. Heterogeneidade hidráulica de uma terra roxa estruturada. Piracicaba, 1991. 141p. Tese (Doutorado) – Escola Superior de Agricultura “Luiz de Queiroz”, Universidade de São Paulo.
MOURA, M.V.T.; LEOPOLDO, P.R.; MARQUES JR., S. Uma alternativa para caracterizar o valor da condutividade hidráulica em solo saturado. Irriga, v.4, p.83-91, 1999.
PARKIN, T.B.; CHESTER, S.T.; ROBINSON, J.A. Calculating confidence intervals for the mean of a lognormal distributed variables. Soil Science Society of America Journal, v.54, p.321-326, 1990.
PARKIN, T.B.; MEISINGER, J.J.; CHESTER, S.T.; STARR, J.L.; ROBINSON, J.A. Evaluation of statistical estimation methods for lognormal distributed variables. Soil Science Society of America Journal, v.52, p.323-329, 1988. PARKIN, T.B.; ROBINSON, J.A. Analysis of lognormal data. Advances in
Soil Science, v.20, p.193-235, 1992.
REICHARDT, K. A água em sistemas agrícolas. São Paulo: Manole, 1990. 188p.
SENTELHAS, P.C.; MORAES, S.O.; PIEDADE, S.M.S.; PEREIRA, A.R.; ANGELOCCI, L.R.; MARIN, F.R. Análise comparativa de dados meteorológicos obtidos por estações convencional e automática. Revista Brasileira de Agrometeorologia, v.5, p.215-221, 1997.
WARRICK, A.W.; NIELSEN, D.R. Spatial variability of soil physical properties in the field. In: HILLEL, D. (Ed.) Applications of soil physics. New York: Academic Press, 1980. cap.13, p.319–344.
YOUNGS, E.G. Hydraulic conductivity of saturated soils. In: SMITH, K.A.; MULLINS, C.E. (Ed.) Soil analysis: physical methods. New York: Marcel Dekker, 1991. p.161-207.
ZACHARIAS, S.; HEATWOLE, C.D.; COAKLEY, C.W. Robust quantitative techniques for validating pesticide transport models. Transactions of the ASAE, v.39, p.47-54, 1996.