* Corresponding author:
E-mail: [email protected]
Received: September 25, 2015
Approved: February 1st, 2016
How to cite: Silva MA, Silva MLN, Owens PR, Curi N, Oliveira AH, Candido BM. Predicting
Runoff Risks by Digital Soil
Mapping. Rev Bras Cienc Solo. 2016;40:e0150353.
Copyright: This is an open-access article distributed under the terms of the Creative Commons Attribution License, which permits unrestricted use, distribution, and reproduction in any medium, provided that the original author and source are credited.
Predicting Runoff Risks by Digital
Soil Mapping
Mayesse Aparecida da Silva(1)
, Marx Leandro Naves Silva(2)*
, Phillip Ray Owens(3) , Nilton Curi(2), Anna Hoffmann Oliveira(4) and Bernardo Moreira Candido(2)
(1)
International Center for Tropical Agriculture, Palmira, Valle del Cauca, Colombia. (2)
Universidade Federal de Lavras, Departamento de Ciência do Solo, Lavras, Minas Gerais, Brasil. (3)
Purdue University, Department of Agronomy, West Lafayette, Indiana, United States of America. (4)
Universidade de Campinas, Campinas, São Paulo, Brasil.
ABSTRACT: Digital soil mapping (DSM) permits continuous mapping soil types and properties through raster formats considering variation within soil class, in contrast to the traditional mapping that only considers spatial variation of soils at the boundaries of delineated polygons. The objective of this study was to compare the performance of SoLIM (Soil Land Inference Model) for two sets of environmental variables on digital mapping of saturated hydraulic conductivity and solum depth (A + B horizons) and to apply the best model on runoff risk evaluation. The study was done in the Posses watershed, MG, Brazil, and SoLIM was applied for the following sets of co-variables: 1) terrain attributes (AT): slope, plan curvature, elevation and topographic wetness index. 2) Geomorphons and terrain attributes (GEOM): slope, plan curvature, elevation and topographic wetness index combined with geomorphons. The most precise methodology was applied to predict runoff areas risk through the Wetness Index based on contribution area, solum depth, and saturated hydraulic conductivity. GEOM was the best set of co-variables for both properties, so this was the DSM model used to predict the runoff risk. The runoff risk showed that the critical months are from November to March. The new way to classify the landscape to use on DSM was demonstrated to be an efficient tool with which to model process that occurs on watersheds and can be used to forecast the runoff risk.
Keywords: geomorphons, terrain attributes, saturated hydraulic conductivity, solum depth.
INTRODUCTION
Identification of wetlands, in a landscape, allows the identification of regions that are vulnerable to runoff as well as areas of either greater or smaller water recharge potential based on soil infiltration rate. Runoff occurs when the saturated soil does not allow water to continue infiltrating and, thus, the excess water drains over the soil surface, producing both detachment and transport of soil particles. The drained away volume determines the erosive power and depends upon the amount of rain, soil infiltration capacity, and water holding capacity on soil surface.
Runoff can be obtained by applying wetness indices, which mathematically describe the spatial distribution of this process in the landscape. There are wetness indices such as the topographic wetness index, which describe soil moisture patterns in the watershed based only on the topography without taking into account the soil characteristics. Those indices are useful when one intends to topographically identify the path covered by water on the soil surface, but they cannot be used to evaluate the water infiltration capacity in soil and runoff.
There are other indices that utilize information about soils and allow the determination of where it is most favorable to runoff. This is the case for the wetness index developed by O’Loughlin (1986), which is based upon topographical information such as the upward contribution area and the terrain slope; in addition, information about water percolation into the soil profile (soil transmissivity) determines the soil saturation pattern inside a watershed and allows the areas that are most vulnerable to runoff to be identified. This index considers that the flow infiltrates as far as a condition of lowest conductivity, in general, the soil-rock contact, following then the method determined by topography (Oliveira, 2011). Thus, topography as well as soil properties have an important role in modelling wetness index for watersheds requiring accurate and detailed soil information to describe spatial pattern of the input data in the model.
Topographical data are easily obtained from digital elevation models (DEM), while detailed soil information can be acquired through digital soil mapping approaches (DSM). DSM has been strongly studied and applied in the last 30 years in order to provide detailed and continuous maps of soil types and properties in a raster format. This technique takes into consideration the existence of variation within soil class rather than considering soils vary only on the borders between a class and another as provided by traditional soil polygon maps. McBratney et al. (2003) present a number of methods that have been utilized in the attempt to capture the variability of soils and their attributes with greatest precision, including linear models, classification and regression trees, fuzzy logic, neural networks and geostatistics.
related to their position in the landscape. In addition to these derivation methods of the topographical attributes, Jasiewicz and Stepinski (2013) developed a new procedure to classify the landscape based on pattern recognition, instead of differential geometry named geomorphons. Geomorphons use the concept of local ternary patterns (LTP) (Liao, 2010) to classify the relief into landforms such as summit, shoulder, valley, lowland, depressions, plan, etc. from the DEM and with reduced computational cost (Jasiewicz and Stepinski, 2013).
The hypothesis that the DSM, along with the relief classification through the geomorphons, can be applied to predict vulnerability of soil to surface runoff was established. The objectives were to compare the performance of models which use geomorphons and models which do not use geormorphons in the prediction of soil attributes to apply in the calculation of a Wetness Index and define the areas that are most vulnerable to runoff.
MATERIALS AND METHODS
The study was developed in the Posses watershed, Extrema, Minas Gerais, Brazil, with an area of 1,196.7 ha and located between the coordinates 46° 14’ W and 22° 51’ S and ranging altitudes from 968 to 1,420 m (Figure 1). This region is located in the southern portion of the Mantiqueira range, with steep and very undulated relief. The main land use in the watershed is extensive grazing without conservation practices. This watershed is a pilot study area of the Water Producer Program of the National Water Agency (ANA), which aims to restore watersheds focusing on water resources (ANA, 2008), as this is the first sub-basin to have the Conservative Waters project implanted in the municipality of Extrema according to the Municipal Law No. 2,100/05. Among the actions of the Conservative Waters is the reduction of water erosion and revegetation of the permanent preservation areas (PPA). According to the Forest Act (ACT 12,651/2012), PPAs are protected areas, located along the waterways, on top of hills and on slopes greater than 45°, either covered by native vegetation or not, with the environmental function of preserving water resources, soil protection and ensuring the well-being of human populations. The PPAs surrounding the drainage network and the springs were restored and replanted in the watershed in 2007 (Figure 1). The climate of the region is Cwb type (mesothermal of mild and soft summers and winter drought), according to Köppen classification system. The average annual temperature is 18 °C, the hottest month and the coldest month having average temperatures of 25.6 °C and 13.1 °C, respectively, with the occurrence of frosts annually and average annual rainfall of 1,652 mm.
Using 21 soil profiles described during the soil survey, five soil classes in the Posses watershed were classified according to the Brazilian system of soil classification (Santos
et al., 2013) and correlated with Soil Taxonomy (USDA, 2014): Argissolo Vermelho-Amarelo
(Red-Yellow Ultisol), Cambissolo Háplico (Ochrept), Cambissolo Húmico (Inceptisol),
Neossolo Litólico (Udorthent) and Neossolo Flúvico (Fluvent).
Soil properties used for this study were solum depth (A horizon + B horizon) and saturated hydraulic conductivity determined in laboratory using undisturbed soil samples and constant head permeameter according to Lima et al. (1990). Solum depth (PROF) information was obtained from 21 soil profiles measured during the soil survey and saturated hydraulic conductivity (Ksat) was sampled randomly in the whole watershed totalizing 141 undisturbed samples (Figure 1).
30 % were used to validate the models while 20 % of the data was used to validate Ksat. All sampling points for both soil properties studied, had their geographical coordinates collected using a global positioning system (GPS) GARMIN eTrex Vista.
The soil classes and properties maps for PROF and Ks in Posses watershed were developed based on a digital soil mapping approach that combines expert knowledge and fuzzy logic. For that purpose, the Soil Land Inference Model (SoLIM) was utilized to formalize the relations between soils and the covariates (soil-landscape relationships) and create the similarity maps (Zhu and Band, 1994; Zhu, 1997; Zhu et al., 1996, 1997, 2001). SoLIM is a similarity model based on fuzzy logic that generates continuous maps in a raster format. In this methodology, each pixel is designated by a vector of similarity that describe the degree of similarity between the local soil and the taxonomic unit (soil classes) (Zhu, 1997). In this sense, co-variables that represent soil variability in the landscape as well as their relationships were used.
For this study, only variables related to relief were considered, taking into consideration that the other soil forming factors (climate, organisms, parent material and time) are the same for the entire watershed. The co-variables utilized were obtained from a DEM with a resolution of 10 m developed from topographic map (counter lines with 20 m distance from each other) at scale of 1:50,000 (IBGE, 1973). The similarity maps were generated in two ways according to the covariates used: 1) AT: elevation, slope, plan curvature and SAGA topographic wetness index; and 2) GEOM: geomorphons landforms combined with elevation, slope, plan curvature and SAGA topographic wetness index. SoLIM creates similarity maps in a geographic information system (GIS) using fuzzy logics defining for each pixel a similarity value ranging from 0 (no similarity) to 1 (high similarity). Using the procedure known as hardening, each pixel was assigned the highest similarity value generating the soil class map (Zhu et al., 1996; Zhu et al., 2010).
Figure 1. Location of the study area (a), soil profiles, sampling points of the saturated hydraulic conductivity (Ksat), pluviometric
stations of the National Water Agency (ANA), digital elevation model (DEM) with resolution of 10 m (b) and current land use including the permanent preservation areas (PPA) (c).
ANA Pluviometric Stations Ksat Sampling Modal Profiles States’ Border Atlantic Forest Posses Watershed Legend São Paulo Extrema Minas Gerais N São Paulo Minas Gerais N
0 160 320 640
km
0 155 310 620
km
N 0 0.4 0.8 1.6
km PPA Native Forest Pasture Eucalyptus Agriculture Current land use
Low: 971.739 High: 1462.6 DEM
Datum SAD 69 Zone 23S
22°53’0’’S
22°52’0’’S
22°51’0’’S
22°50’0’’S
46°15’0’’W 46°14’0’’W 46°15’0’’W
(b) (c) 46°14’0’’W
22°53’0’’S
22°52’0’’S
22°51’0’’S
22°50’0’’S
From the similarity maps, soil properties PROF and Ksat using both AT and GEOM were performed according to the following equation (Zhu et al., 1997):
Σn k = 1 S
k ij Vij =
Σn k = 1 S
k ij × V
k
Eq. 1
where Vij is the soil property at location i, j, Sk
ij is the similarity value in location i, j for
class soil k, n is the total number of soil classes and Vk is the typical value of the soil property for the soil class k. The typical values for each property were defined by the average value of the properties, per soil class, contained in the training group of the model.
The two methods used to predict classes and soil properties (AT and GEOM) were compared using the root mean square error (RMSE) which provides accuracy of the prediction; lower values indicate better accuracy.
n RMSE = Σ
n i = 1 (z
* – z)2
Eq. 2
where z*
is the estimated soil property value, z is the observed (field data) soil property value that has not been used in the model and n is the number of samples.
After choosing the best method for the prediction of PROF and Ksat attributes, the vulnerability to runoff for the Posses watershed was determined. Vulnerability to runoff was obtained through the soil wetness index (W) developed by O’Loughlin (1986). For values of W greater than 1, it was considered that there are sufficient conditions to saturate the soil, so that surface flow occurs. For values smaller than or equal to 1, it was defined that all rainwater infiltrated into the soil, so there was no water available for runoff, which reduced the chances of soil erosion and sediment transportation occurring. The monthly W index was calculated for the whole watershed according to the equation:
W = (Q/T)[a/b × sen θ] Eq. 3
where W is the soil wetness index (dimensionless), Q is the monthly rainfall (m s-1),
T is the value of soil transmissivity (m2 s-1), a corresponds to the upstream contribution
area (m2
), b is the pixel size (m) and senθ is the sine of slope (radians). The ratio Q/T corresponds to the hydrological control, while the ratio (a/b×senθ) corresponds to the morphological control (Dietrich and Wilson, 1993).
The monthly rainfall data used are from January 2009 to December 2011, obtained in five ANA rainfall stations distributed along the watershed (Figure 1).
The soil transmissivity was calculated by multiplying saturated hydraulic conductivity maps (Ksat) by solum depth (PROF) predicted using DSM method, which had increased accuracy, according to the adapted equation of Montgomery and Dietrich (1994):
T = Ksat × PROF Eq. 4
where T is the soil transmissivity (m2 s-1); Ksat is the saturated hydraulic conductivity
(m s-1) and PROF is the solum depth (m).
The contribution area of each cell (pixel) of the DEM was obtained by multiplying the accumulated flow defined by the D∞ method (Tarboton, 1997; Oliveira et al., 2012) by
the area of each cell (100 m2), according to Moore et al. (1993):
A = λη Eq. 5
where A corresponds to the contribution area (m2), λ is the cumulative flow (pixel) and
RESULTS AND DISCUSSION
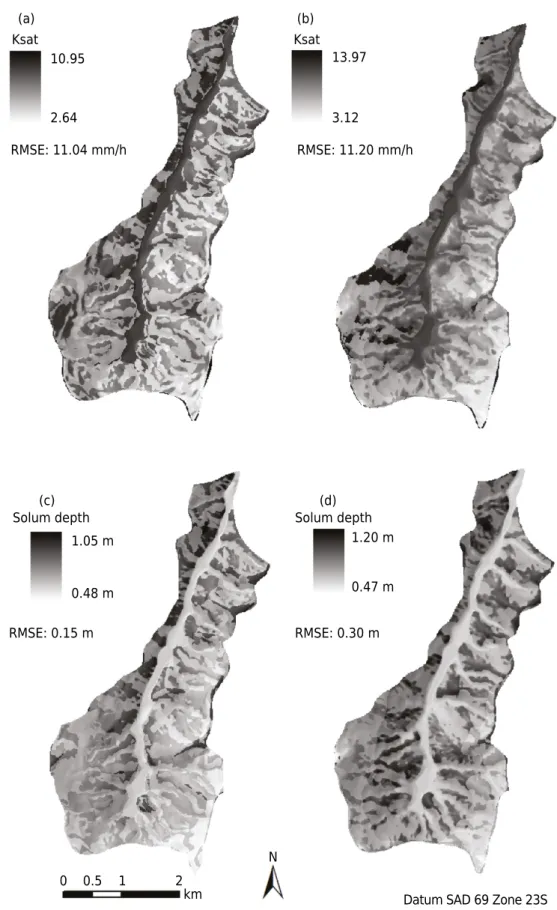
The soil properties Ksat and PROF had better performance when terrain attributes (Figure 1), slope, curvature plan, SAGA, topographic wetness index and geomorphons (Figure 2) were combined (GEOM method) (Figure 3). For Ksat, the difference in accuracy between the two applied methodological models was not as evident as for the PROF attribute. This shows that PROF was more influenced by the position in the landscape than the Ksat. Ksat is a soil dynamic soil property, which is affected by anthropic factors in addition to the factors that lead to soil formation; while PROF is closely related to soil-forming factors and thus strongly affected by its position in the landscape. The Posses watershed has a very undulated and steep relief, driven by natural processes of erosion that occur in this area due to its location on the edge of the Mantiqueira Range. With the movement of water over the landscape since the uplift of the Mantiqueira, the well-developed and deeper soils, like Latosols that were formed previously, gave way to less developed and shallow soils. This causes the soil-landscape relationship to be most striking for Ksat attribute that undergoes influence by the current land use, which is basically pasture (>70 %) in this watershed.
Due to the higher accuracy of the GEOM method for predicting soil properties in the studied soils, this was also the chosen method to generate a soil map for the watershed (Figure 4). According to the results, most of the watershed (55 %) consists of Cambisols, which have an occurrence linked to the areas of steep slopes that provide severe river discharge and mechanization difficulties. Thus, they become vulnerable to the process of erosion, being restricted to annual crops that require more interventions and are preferable to use with pastures, reforestation and some soil protective permanent crops when properly managed, using special soil conservation practices, since, even under this type of vegetation, such soils are susceptible to the process of erosion (Silva et al., 2013).
The second most-occurring soil in the watershed is the Argissolo Vermelho-Amarelo,
which is more developed, deeper and more resistant to erosion than the Cambisols.
However, in spite of being more resistant to erosion, Argissolo Vermelho-Amarelo
is still very susceptible to soil losses due to the textural gradient between the horizon A and B.
Associated with Argissolo Vermelho-Amarelo and Cambisols occurs Neossolo Litólico
containing rocky outcroppings making it impossible to be cultivated. This soil is found in 8 % of the watershed and must be used only for protection and shelter of wild fauna and flora, recreation and tourism or water storage in dams (Lepsch et al., 1991).
The occurrence of Neossolo Flúvico associated with the drainage network (areas of gentle
slope) of the subs-basin was observed. This soil occupies 11 % of the watershed and receives all of the eroded sediments from the upstream area, continuously renewing the soil and then slowing down its evolution process and resulting of no presence of structure, making it very susceptible to erosion by mass displacement.
The monthly soil vulnerability evaluation of surface runoff revealed that the most critical months are between November and March (Figure 5). According to the index used in this study to estimate runoff, when the degree of soil saturation is significant, the risk of soil erosion and sediment transportation is also high (Oliveira, 2011). For the months of December and January, practically, all the watershed is at risk of erosion, except the summits. Nevertheless, the summits are not vulnerable to runoff and erosion risks in any of the months analyzed, indicating that these areas are important in the infiltration of water and supply of water tables.
significant only close to the drainage network. This highlights the importance of vegetation in PPAs as a buffer area for the Posses River. The risk of erosion in these areas is evident during every month of the year, even in the dry season, requiring permanently cover protection of soil, preventing erosion on the river edges from increasing the silting of water sources that will interfere with the water supply.
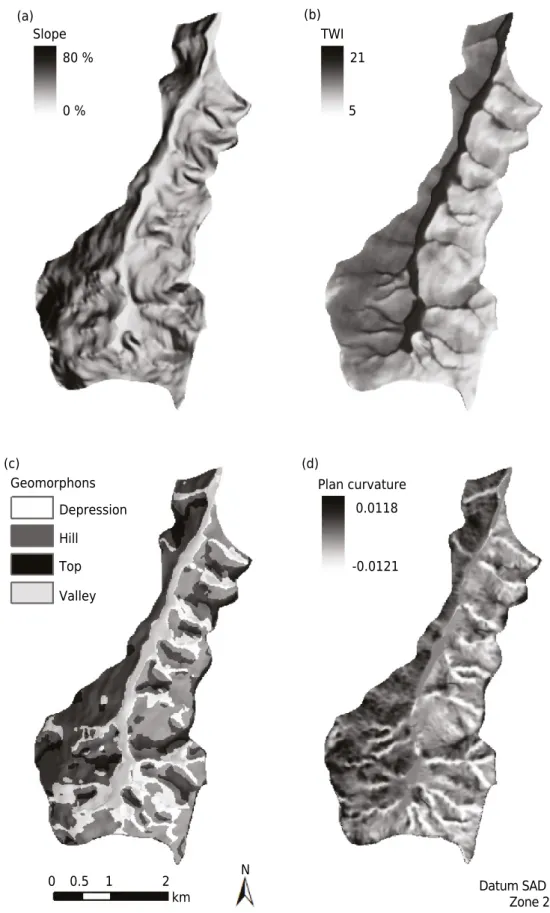
Figure 2. Terrain attributes slope (a), SAGA topographic wetness index (TWI) (b), geomorphons (c) and plan curvature (d) in the Posses watershed, Extrema, MG.
0 % 80 %
(b) (a)
(c) (d)
Slope TWI
5 21
Top Depression
Geomorphons Plan curvature
-0.0121 0.0118
Hill
Valley
N
0 0.5 1 2
April and September are the months on the transition between the dry season and the rainy season in the watershed and are more vulnerable in the areas of steepest slopes, mainly in the headwaters areas.
The most critical month to runoff is January due to the occurrence of heavy rains (Table 1). In this month, most of the agricultural areas have insignificant risk of occurring runoff,
Figure 3. Saturated hydraulic conductivity (Ksat) determined by the GEOM method (a), Ksat determined by the AT method (b), solum depth (PROF) determined by the GEOM method (c) and PROF determined by the TA method (d) in the Posses watershed, Extrema, MG.
2.64 10.95
(b) (a)
(c) (d)
Ksat Ksat
3.12 13.97
Solum depth Solum depth
0.47 m 1.20 m 1.05 m
0.48 m
N
0 0.5 1 2
km Datum SAD 69 Zone 23S
RMSE: 0.30 m RMSE: 0.15 m
Figure 4. Soil class map (a) and percentage of the area occupied by each soil class (b) in the Posses watershed, Extrema, MG. Soil classes according to Soil Taxonomy (USDA, 2014): Cambissolo
Húmico (Inceptisol), Cambissolo Háplico (Ochrept), Argissolo Vermelho-Amarelo (Red-Yellow Ultisol),
Neossolo Litólico (Udorthent) and Neossolo Flúvico (Fluvent).
22°53’0’’ S2 2°52’0’’ S2 2°51’0’’S 22°50’0’’S 22°53’0’’ S2 2°52’0’’ S2 2°51’0’’S 22°50’0’’S 46°15’0’’W 46°14’0’’W 46°15’0’’W 46°14’0’’W (a) N
0 0.5 1 2
km
Datum SAD 69 Zone 23S
Cambissolo Húmico (CH)
Legend Soil classes
Cambissolo Háplico (CX)
Argissolo Vermelho-Amarelo (PVA)
Neossolo Litólico (RL)
Neossolo Flúvico (RY)
(b) Area occupied by each soil class
CH
CX
PVA
RL
RY
0 10 20 30
Area (%)
40 50
Soil class
Figure 5. Soil vulnerability to runoff and average monthly rainfall in the Posses watershed, MG. Non-significant Significant
N
0 0.5 1 2
km Datum SAD 69
Zone 23S Runoff
January 398 mm/mo February 144 mm/mo March 202 mm/mo April
105 mm/mo 24 mm/mo
approximately a half of the areas of eucalyptus, pasture, native forest presents significant risk, the other half has insignificant risk, and about 70 % of PPA presents significant risk of runoff. These areas of greatest risk become more susceptible to erosion. This shows that the restoring PPAs by Conservative Waters was a very important action to soil conservation and protection of water resources, as they are allocated in critical areas to erosion in the watershed and not just in January but throughout the whole year.
In general, the months of greatest vulnerability to runoff and erosion (November to March), the land uses with pasture and PPA are the ones which lie in the areas of greatest risk. Pastures, when well-managed, help reduce water erosion. However, according to Oliveira et al. (2008), pastures in the Posses watershed lie in an advanced stage of degradation, requiring adequate management plans to ensure the sustainable use of these pastures, mainly for lying in the areas most susceptible to runoff and soil erosion.
Table 1. Percentage of vulnerable area to runoff according to the current land use in the
Posses watershed
Month Runoff Agriculture Eucalyptus Pasture Native
forest PPA
(1)
%
January Non-significant 73 55 48 50 32
Significant 27 45 52 50 68
February Non-significant 92 81 75 77 58
Significant 8 19 25 23 42
March Non-significant 89 77 70 71 51
Significant 11 23 30 29 49
April Non-significant 96 86 83 83 67
Significant 4 14 17 17 33
May Non-significant 100 94 96 95 87
Significant 0 6 4 5 13
June Non-significant 100 91 91 90 79
Significant 0 9 9 10 21
July Non-significant 100 91 93 91 81
Significant 0 9 7 9 19
August Non-significant 100 93 95 94 85
Significant 0 7 5 6 15
September Non-significant 98 89 87 86 72
Significant 2 11 13 14 28
October Non-significant 94 84 80 80 64
Significant 6 16 20 20 36
November Non-significant 90 78 71 73 53
Significant 10 22 29 27 47
December Non-significant 85 70 63 65 45
Significant 15 30 37 35 55
(1)
CONCLUSIONS
The landforms defined by geomorphons and used in the DSM approach are efficient to model processes that occur in watersheds, making them able to be used in predicting soil vulnerability to runoff.
The months of greatest vulnerability to runoff (September, November to March and April) had greater risk in the headwater area, while the months of lower rainfall (May to August) the risk of runoff and erosion were restricted to the neighborhood of the drainage network.
In the months of greatest vulnerability to both runoff and erosion (November to March), the uses grazing and PPA are found in areas of greatest risk, indicating that the PPAs should be maintained and pastures properly managed and preserved.
ACKNOWLEDGEMENTS
The authors would like to thank the Brazilian Coordination for the Improvement of Higher Education Personnel - CAPES, the Brazilian National Council for Scientific and Technological Development - CNPq (Process No. 471522/2012-0, 201987/2012-0 and 305010/2013-1),
and Minas Gerais State Research Foundation - FAPEMIG (Process No.CAG-APQ-01423-11
and CAG-PPM-00422-13) for the funding, as well as the municipal government of Extrema (MG) on behalf of the Director of the Department of the Environment, Paulo Henrique Pereira, for supporting the data collection.
REFERENCES
Agência Nacional de Águas - ANA. Programa produtor de água superintendência de usos múltiplos. Brasília, DF: Ministério do Meio Ambiente; 2008.
Ashtekar JM, Owens, PR. Remembering knowledge: an expert knowledge based approach to
digital soil mapping. Soil Horiz. 2013;54:1-6. doi:10.2136/sh13-01-0007
Boer M, Del Barrio G, Puigdefábres J. Mapping soil depth classes in dry Mediterranean areas using terrain attributes derived from a digital elevation model. Geoderma. 1996;72:99-118. doi:10.1016/0016-7061(96)00024-9
Da Silva M, Rodriguez M, Majin M, Chirinda N. Textural classification of soils in rice-growing
areas in Colombia. Harvard Dataverse. 2015;V1.
Dietrich W, Wilson C. Analysis of erosion thresholds, channel networks, and landscape
morphology using a digital terrain model. J Geol. 1993;101:259-78. doi:10.1086/648220
Instituto Brasileiro de Geografia e Estatística - IBGE. Carta do Brasil. Rio de Janeiro: 1973.
1 mapa. Escala: 1:50000.
Jasiewicz J, Stepinski TF. Geomorphons - a pattern recognition approach to classification and mapping of landforms. Geomorphology. 2013;182:147-56.
doi:10.1016/j.geomorph.2012.11.005
Lepsch IF, Bellinazi R, Bertolini D, Espíndola CR. Manual para levantamento utilitário do meio
físico e classificação de terras no sistema de capacidade de uso: 4ª aproximação. Campinas:
Sociedade Brasileira de Ciência do Solo; 1991.
Liao WH. Region description using extended local ternary patterns. In: Annals of the 20º International Conference on Pattern Recognition; 2010; Istambul. Istambul: Institute of Electrical and Electronics Engineers; 2010. p.1003-6.
Lima JM, Curi N, Resende M, Santana DP. Dispersão do material de solo em água para avaliação
indireta da erodibilidade de Latossolos. Rev Bras Cienc Solo. 1990;14:85-90.
McBratney A, Mendonça-Santos M, Minasny B. On digital soil mapping. Geoderma.
Menezes MD, Silva SHG, Owens PR, Curi N. Digital soil mapping approach based
on fuzzy logic and field expert knowledge. Cienc Agrotec. 2013;37:287-98.
doi:10.1590/S1413-70542013000400001
Montgomery DR, Dietrich WE. A physically based model for the topographic control on shallow landsliding. Water Resour Res. 1994;30:1153-71. doi:10.1029/93WR02979
Moore ID, Gessler PE, Nielsen GA, Peterson GA. Soil attribute prediction using terrain analysis. Soil Sci Soc Am J. 1993;57:443-52. doi:10.2136/sssaj1993.572NPb
Motaghian HR, Mohammadi J. Spatial estimation of saturated hydraulic conductivity from
terrain attributes using regression, kriging, and artificial neural networks. Pedosphere.
2011;21:170-7. doi:10.1016/S1002-0160(11)60115-X
O’Loughlin EM. Prediction of surface saturation zones in natural catchments by topographic analysis. Water Resour Res. 1986;22:794-804. doi:10.1029/WR022i005p00794
Odeh I, McBratney A, Chittleborough D. Further results on prediction of soil properties from
terrain attributes: heterotopic cokriging and regression-kriging. Geoderma. 1995;67:215-26.
doi:10.1016/0016-7061(95)00007-B
Oliveira AH, Lima GC, Silva MLN, Freitas DAF, Silva MA, Pereira PH, Santos DG, Veiga F.
Implantação de práticas conservacionistas em áreas agrícolas e estradas, objetivando
a recarga de água na sub-bacia das Posses, município de Extrema, MG. In: Anais do
18º Congresso de Pós-graduação da UFLA, 1º Encontro de Engenharia de Sistemas e 4º Workshop de Laser e Óptica na Agricultura; 2008; Lavras. Lavras: Universidade Federal
de Lavras; 2008. p.354-9.
Oliveira AH, Silva MLN, Curi N, Klinke Neto G, Silva MA, Araújo EF. Consistência hidrológica de modelos digitais de elevação (MDE) para definição da rede de drenagem na sub-bacia do horto florestal Terra Dura, Eldorado do Sul, RS. Rev Bras Cienc Solo. 2012;36:1259-68.
doi:10.1590/S0100-06832012000400020
Oliveira AH. Erosão hídrica e seus componentes na sub-bacia hidrográfica do Horto Florestal
Terra Dura, Eldorado do Sul (RS) [tese]. Lavras: Universidade Federal de Lavras; 2011.
Santos HG, Jacomine PKT, Anjos LHC, Oliveira VA, Oliveira JB, Coelho MR, Lumbreras JF,
Cunha TJF. Sistema brasileiro de classificação de solos. 3a ed. Rio de Janeiro: Embrapa
Solos; 2013.
Silva MA, Freitas DAF, Silva MLN, Oliveira AH, Lima GC, Curi N. Sistema de
informações geográficas no planejamento de uso do solo. Agrária. 2013;8:316-23.
doi:10.5039/agraria.v8i2a2289
Tarboton DG. A new method for the determination of flow directions and upslope areas in grid
digital elevation models. Water Resour Res. 1997;33:309-19. doi:10.1029/96WR03137
United States Department of Agriculture - USDA. Keys to soil taxonomy. 12th ed. Washington, DC: USDA-NRCS; 2014.
Winzeler HE, Owens PR, Joern BC, Camberato JJ, Lee BD, Anderson DE, Smith DR.
Potassium fertility and terrain attributes in a Fragiudalf drainage Catena. Soil Sci Soc Am J. 2008;72:1311-20. doi:10.2136/sssaj2007.0382
Zhu AX, Band LE, Dutton B, Nimlos TJ. Automated soil inference under fuzzy logic. Ecol Model. 1996;90:123-45. doi:10.1016/0304-3800(95)00161-1
Zhu AX, Band LE, Vertessy R, Dutton B. Derivation of soil properties using a Soil Land Inference Model (SoLIM). Soil Sci Soc Am J. 1997;61:523-33. doi:10.2136/sssaj1997.03615995006100020022x
Zhu AX, Band LE. A knowledge-based approach to data integration for soil mapping. Can J Rem
Sens. 1994;20:408-18.
Zhu AX, Hudson B, Burt J, Lubich K, Simonson D. Soil mapping using GIS, expert knowledge,
and fuzzy logic. Soil Sci Soc Am J. 2001;65:1463-72. doi:10.2136/sssaj2001.6551463x
Zhu AX. A similarity model for representing soil spatial information. Geoderma. 1997;77:217-42. doi:10.1016/S0016-7061(97)00023-2
Zhu Q, Lin HS. Comparing ordinary kriging and regression kriging for soil properties in