.
Water defi cit modifi es the carbon isotopic composition of lipids, soluble
sugars and leaves of
Copaifera langsdorffi
i
Desf. (Fabaceae)
Angelo Albano da Silva Bertholdi
1, Vladimir Eliodoro Costa
2,3, Angélica Lino Rodrigues
1and Luiz Fernando Rolim de Almeida
1*Received: May 8, 2017 Accepted: September 17, 2017
ABSTRACT
Water defi cit is most frequent in forest physiognomies subjected to climate change. As a consequence, several tree species alter tissue water potential, gas exchange and production of carbon compounds to overcome damage caused by water defi ciency. Th e working hypothesis, that a reduction in gas exchange by plants experiencing water defi cit will aff ect the composition of carbon compounds in soluble sugars, lipids and vegetative structures, was tested on
Copaifera langsdorffi i. Stomatal conductance, leaf water potential, and CO2 assimilation rate declined after a period of water defi cit. After rehydration, leaf water potential and leaf gas exchange did not recover completely. Water defi cit resulted in 13C enrichment in leaves, soluble sugars and root lipids. Furthermore, the amount of soluble sugars and
root lipids decreased after water defi cit. In rehydration, the carbon isotopic composition and amount of root lipids returned to levels similar to the control. Under water defi cit, 13C-enriched in root lipids assists in the adjustment
of cellular membrane turgidity and avoids damage to the process of water absorption by roots. Th ese physiological adjustments permit a better understanding of the responses of Copaifera langsdorffi to water defi cit.
Keywords: carbon assimilation, carbon isotopic composition, lipids, soluble sugars, water defi cit
Introduction
Climate change is causing an increase in the intensity and duration of the dry season of Cerrado (Neotropical savannas) and the Atlantic Forest (IPCC 2013). Drought duration is the main determinant of the diff erent levels of resistance and resilience of tree species to water defi cit (Keersmaecker et al. 2015), which aff ect growth (Pasho et al. 2011; Lévesque et al. 2013) and gain in biomass (Ivits et al. 2016). Quantifying the duration, intensity, and spatial extent of water defi cit is a diffi cult task due to the numerous physical variables to be considered (Vicente-Serrano et al. 2013). Evaluating the ability of plants to overcome water
defi cit and recover after rehydration may be an alternative approach to understanding the adaptation of tree species to climate change (Vaz et al. 2010; Farrell et al. 2013). Furthermore, this approach can provide insight into the distribution of tree populations in forest physiognomies.
Under water deficit, trees induce stomata closure, decrease CO2 assimilation (Kagotani et al. 2015), suppresses photosynthesis and activate respiration (Reddy et al. 2003; Meng et al. 2014). Furthermore, the breakdown of starch into soluble sugars increases the levels of carbon compounds in leaves (Chaves et al. 2009). Th e accumulation of soluble sugars, obtained from the breakdown of starch, facilitates osmotic adjustment by plants during water defi cit. Th is, in turn, results in the maintenance of turgor in cells, which
1Departamento de Botânica, Instituto de Biociências de Botucatu, Universidade Estadual Paulista, 18618-970, P.O. Box 510, Botucatu, SP, Brazil
2Departamento de Física e Biofísica, Instituto de Biociências de Botucatu, Universidade Estadual Paulista, 18618-970, P.O. Box 510, Botucatu, SP, Brazil
3Centro de Isótopos Estáveis, Instituto de Biociências de Botucatu, Universidade Estadual Paulista, 18618-970, P.O. Box 510, Botucatu, SP, Brazil
allows photosynthesis to remain constant, thereby enabling the redistribution of carbon in plants (Hu et al. 2015). Thus, water deficit inhibits lipid biosynthesis and alters the lipid concentration of cellular membranes (Guerfel et al. 2008). These events remodel cellular membranes, reduce their fluidity and permeability, and prevent the excessive loss of water (Larsson et al. 2006). These physiological responses are observed in Neotropical tree species in regions with strong seasonality and water restriction.
Copaifera langsdorffii is a Neotropical tree that is distributed in environments with strong seasonality and water restriction, such as the Cerrado (Neotropical savannas) and the Atlantic Forest (Cysneiros et al. 2011). Copaifera langsdorffii produces oilresin in cavities and resiniferous channels. The oil of this plant is a mixture of volatile and non-volatile terpenes, which are used in popular medicine to treat diseases and pharmaceutical, cosmetic, and biodiesel industries (Rodrigues et al. 2014). The response of C. langsdorffii to water deficit is related to the seasonality of the physiognomies where it occurs and its adaptive strategies (Franco et al. 2016). The species possesses physiological mechanisms and morphological adaptions of its leaves to deal with the wide variation in water availability in the environments in which it grows. During the dry season, foliar senescence reduces the level of gas exchange (Freitas & Oliveira 2002), thereby activating mechanisms to breakdown energy reserves in leaves and transport carbon compounds to the roots via phloem (Ronquim et al. 2003). According to Ronquim et al. (2009), C. langsdorffii possesses the ability to alter carbon acquisition and partitioning between shoots and roots in response to drought. Therefore, we chose to study this species as a model for the analysis of mechanisms of CO2 assimilation under water deficit.
The examination of carbon isotopic composition (δ13C)
is a useful way to evaluate gas exchange (Leavitt & Wright 2002), the photosynthetic cycle (Nate et al. 2010), and CO2 assimilation in plants subjected to water deficit (Adiredjo et al. 2014). Evaluation of δ13C of vegetative structures and carbon
compounds allows the detection of changes in the content of stable 13C/12C carbon isotopes in response to a water shortage.
Water deficit changes the isotopic ratio of 12C/13C due to low
photosynthetic rate and stomatal closure (Ebdon & Kopp 2004). Therefore, this study aimed to evaluate the effect of changes in the assimilation of CO2 during water deficit on the δ13C of soluble sugars, lipids and vegetative structures in
C. langsdorffii. We hypothesized that the reduction in levels of gas exchange in plants under water deficit will have an affect on the composition of carbon compounds in soluble sugars, lipids and vegetative structures.
Materials and methods
Cultivation and experimental conditions
The experiment was performed on young (24 months of age and approximately 50 cm high) plants of Copaifera
langsdorffi Desf., in 4-L plastic pots (32 cm high; 14 cm in diameter). During the 24 months of growth, the young plants were kept at field capacity (soil water potential = -0.005 MPa; soil water percentage = 16 %). The soil used in the experiment was extracted from an area of Cerrado where adult individuals of C. langsdorffii were growing.
The experiment was conducted in the municipality of Botucatu, state of Sao Paulo, Brazil (22°53′12.17″S 48°29′52.45″W). The plants were maintained in a greenhouse under a relative humidity of approximately 50 % and an average temperature of 25 °C. The photosynthetic photon flux density (PPFD) inside the greenhouse reached 800 µmol m−2. s−1 during the day without clouds.
Experimental design
The experiment was randomized among three treatments (control, water deficit and rehydration) with 13 plants per treatment. The experiment took place over the course of 37 days. The control treatment included plants at 100 % of field capacity, which was monitored by weighting the pots (Thameur et al. 2012) and evaluating soil water potential. In water deficit and rehydration treatments, irrigation was suspended until the soil water percentage reached approximately 5 %. Water deficit lasted 18 days, after which the rehydration treatment, was restarted, when irrigation was performed until the soil water potential approached that of the control treatment, at which it was maintained for 19 days.
Leaf water potential (
Ψ
H₂Oleaf) and soil water
potential
(
Ψ
H₂Osoil)
Leaf water potential (ΨH₂Oleaf, MPa) and soil water potential (ΨH₂Osoil,MPa) were measured in four individuals (n=4) from each treatment at intervals of three days. We used one leaf per individual to obtain ΨH₂Oleaf, and a soil portion with a depth of 15 cm to obtain ΨH₂Osoil. We evaluated only four of the 13 plants of each treatment to avoid an influence from the removal of leaves and soil during the evaluation of ΨH₂Oleaf and ΨH₂Osoil on the values of other experimental variables. The ΨH₂Oleaf was evaluated at 5:30 a.m. (predawn - Pd) and at 12:00 p.m. (midday - Md), to document recovery or the accumulation of the effects of water deficit during the day. The ΨH₂Osoil was evaluated just at Md. The ΨH₂Oleaf and ΨH₂Osoil were measured using a potentiometer with a temperature controller (WP4-T, Decagon Devices, USA).
Leaf gas exchange
exchange variables measured were: stomatal conductance (gs, mol m−2s−1), CO
2 assimilation rate (A, µmol CO2 m −2s−1),
transpiration rate (E, mol H2O m−2s−1), instantaneous
water use efficiency (Wt, µmol CO2. mmol H2O−1), and
intrinsic water use efficiency (Wg, µmol CO2. mmol H2O−1).
Instantaneous water use efficiency (Wt) was calculated as the ratio between Aand E and intrinsic water use efficiency (Wg) between A and gs. The measurements were performed using a LI-6400 portable photosynthesis system (LI-COR, USA).
Isotopic analysis
We obtained leaves, the main root, lateral roots and leaf buds from all individuals and, after the separation of plant organs, halted biological processes by freezing all samples in liquid nitrogen. Subsequently, we dried the samples at 65 ºC for 72 hours and ground them in a grinder with liquid nitrogen (Spex - Model 6700). After grinding, we took aliquots of between 50 µg to 70 µg from each sample for analysis. Stable isotope analyses were carried out at the Institute of Biosciences of Botucatu, Universidade Estadual Paulista. The δ13C values were calculated using the equation:
1
δ C
��= �R
������
⁄
R
����− 1� × 1000 ‰
2
3
4
where R is the isotopic ratio of 13C/12C, and VPDB is the
Vienna Pee Dee Belemnite laboratory standard. The aliquots were placed tin capsules (6 mm high, 4 mm in diameter) and placed in an elemental analyzer EA 1108 (Carlo Erba Instruments, Milan, Italy) coupled to an isotope ratio mass spectrometer (IRMS) Delta S (Finnigan Mat, Bremen, Germany).
Quantification of soluble sugars
We extracted soluble sugars from leaves, roots and leaf buds (100 mg) with 80 % ethanol (1:10, w/v) for 15 min at 80 °C. After cooling, the samples were centrifuged at 12000 × g for 15 min (Garcia et al. 2006). We removed and lyophilized the supernatant. We took aliquots of between 50 µg to 70 µg from each sample of leaf, root and leaf bud soluble sugar extract, placed them in a smooth tin capsule and subjected them to EA/IRMS isotopic analysis. Total soluble sugars were estimated colorimetrically by the phenol-sulfuric method (Dubois et al. 1956).
Quantification of lipids
We extracted lipids from leaves, roots and leaf buds (100 mg) with 1 ml MCW (methanol/chloroform/water; 12:5:3, v/v/v) for 30 min at 70°C. After cooling, the samples were centrifuged at 12000 × g for 5 min. We removed 0.6 ml aliquots of the supernatant, and separated phases by adding 0.2 ml of chloroform and 0.7 ml of water. After
centrifugation, the methanol/water phase (upper layer) was removed (Wanek et al. 2001). The chloroform phase (lower layer) was dried in a vacuum concentrator to obtain the lipids. For each treatment, we pipetted aliquots (50 µl) of leaf, root and leaf bud lipid extract into a smooth tin capsule and subjected them to EA/IRMS isotopic analysis. We used the gravimetric method to quantify the lipids of the leaves, roots and leaf buds [milligrams per gram of dry weight (mg g−1 DW)] (Chen et al. 2011). After lipid extraction,
we transferred each aliquot into a pre-weighed vial, dried them under high vacuum and then weighed the dry residues.
Statistical analysis
Means and standard deviations were calculated for all variables. We used four plants (n=4) to evaluate ΨH₂Oleaf and
ΨH₂Osoil and nine plants (n=9) to evaluate leaf gas exchange, the isotopic variables and the quantification of lipids and soluble sugars (total of 13 plants per treatment). After submitting all variables to Shapiro-Wilk normality test, we used one-way analysis of variance (ANOVA), followed by Tukey’s test, to compare individuals of C.langsdorffi in different treatments (control, water deficit and rehydration). Furthermore, we employed Spearman’s correlation test on
δ13C
leaf and gs to observe the relationship between these
two variables in all treatments. Statistical analyses were performed using SigmaPlot (version 12.0).
Results
Soil granulometry and chemical analysis
According to the granulometry analysis performed prior to the experiment, the textural class of the soil was classified as sandy. The remaining physical and chemical soil characteristics are represented in Table 1.
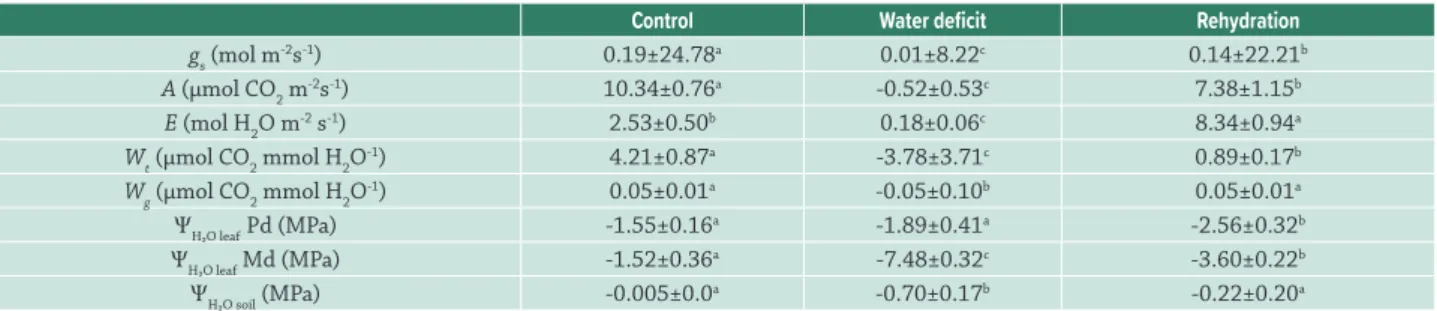
Leaf and soil water potential
Eighteen days after water deficit, the soil water percentage averaged of 5.62 % and -0.70 MPa of ΨH₂Osoil, compared to the control. During the same period the ѰH₂Oleaf Md was 25.26 % lower than the value of ѰH₂Oleaf Pd (Tab. 2), and so we started rehydration on the 19th day. After
rehydration, the water soil percentage averaged 15.23 % and ΨH₂Osoil increased to -0.22 MPa, statistically equaling the control, and the difference between the values of ѰH₂Oleaf Pd and Md was reduced by 25 % (Tab. 2).
Leaf gas exchange
The gs was 0.01 mol m-2s-1 in maximum water deficit (18th
day), reflecting a drastic reduction compared to the control. On the last day of rehydration (37th day), g
s indicated values
an increase compared to water deficit (0.01 mol m-2s-1)
(Tab. 2). The water deficit values of A, E, Wt, Wg decreased in relation to control. After rehydration, only Wg values equaled those of the control, while the other variables were higher (E) or lower (A and Wt) (Tab. 2); thus some of the variables exhibited recovery after water deficit.
Isotopic analysis
Leaf gas exchange was evaluated on the first day of the experiment (day 1), the last day of water deficit (day 18) and the last day of rehydration (day 37). However, the
carbon isotopic composition was only evaluated on the last day of water deficit and the last day of rehydration (control and rehydration treatments). Significant differences among treatments were observed only for δ13C
leaf (Tab.
3). Figure 1 shows the negative correlation (Spearman’s coefficient = -0.587) between gs and δ13C
leaf. The δ 13C
leaf
values increased when gs decreased, indicating an inverse relationship. The plants subjected to a water deficit had an increased concentration of 13C in their leaves, but the plants
subjected to water deficit and later rehydrated had higher values of δ13C
leaf than plants under full hydration (control
treatment) (Tab. 3).
Table 3. Carbon isotopic composition (δ13C) of vegetative structures from C. langsdorffii in the control, water deficit and rehydration treatments.
Control Water deficit Rehydration
Leaf -28.93±1.20b -27.57±1.16a -29.36±0.67b
Leaf buds -28.15±1.34a -27.81±0.48a -28.05±0.71a
Root -28.18±1.17a -27.26±0.61a -28.06±0.90a
All values are means ± standard deviations (n=9). Data were analyzed using one-way ANOVA followed by Tukey’s test (significance at 5 %). Diffe-rent letters represent statistical difference (P<0.05) between treatments.
Table 1. Soil granulometry and chemical analysis.
Sand Clay Silt F.C. pH O.M. P H+Al K Ca Mg V
_______g kg−1_________ MPa CaCl
2 g/dm
3 mg/dm3 ________mmol c/dm
3_______ %
788 110 102 -0.006 5.6 26 9 11 0.7 9 4 57
Field capacity (F.C.), organic matter (O.M.), phosphorus (P), potential acidity (H + Al), potassium (K), calcium (Ca), magnesium (Mg), base satura-tion (V).
Table 2. Leaf water potential (ΨH₂Oleaf), soil water potential (ΨH₂Osoil), stomatal conductance (gs), CO2 assimilation rate (A), transpiration rate (E), instantaneous water use efficiency (Wt), and intrinsic water use efficiency (Wg) of Copaifera langsdorffii Desf. plants in the control, water deficit and rehydration treatments.
Control Water deficit Rehydration
gs (mol m-2s-1) 0.19±24.78a 0.01±8.22c 0.14±22.21b A (µmol CO2 m-2s-1) 10.34±0.76a -0.52±0.53c 7.38±1.15b E (mol H2O m-2 s-1) 2.53±0.50b 0.18±0.06c 8.34±0.94a Wt (µmol CO2 mmol H2O-1) 4.21±0.87a -3.78±3.71c 0.89±0.17b Wg (µmol CO2 mmol H2O-1) 0.05±0.01a -0.05±0.10b 0.05±0.01a ΨH₂O leaf Pd (MPa) -1.55±0.16a -1.89±0.41a -2.56±0.32b ΨH₂O leaf Md (MPa) -1.52±0.36a -7.48±0.32c -3.60±0.22b ΨH₂O soil (MPa) -0.005±0.0a -0.70±0.17b -0.22±0.20a
All values are means ± standard deviations (n=4 to ΨH₂O leaf and ΨH₂O soil, n=9 to leaf gas exchange variables). Data were analyzed using one-way ANO-VA followed by Tukey’s test (significance at 5 %). Different letters represent statistical difference (P<0.05) between treatments.
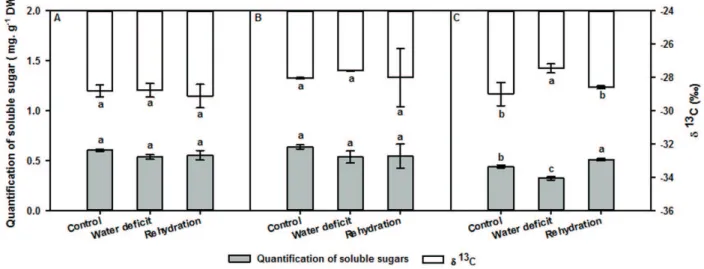
Isotopic analysis and quantification of soluble sugars
The quantification and δ13C of soluble sugars showed
significant differences only in the roots (Fig. 2). In the maximum water deficit (18th day), the amount of soluble
sugars in the roots decreased (0.325 mg g−1 DW) compared
to the control (0.443 mg g−1 DW). However, the δ13C for root
soluble sugars increased (-27.46 ‰) in relation to the control (-29.00 ‰). On the last day of rehydration (37th day), the
amount of root soluble sugars exhibited an increase (0.832
mg g−1 DW) compared to water deficit (0.325 mg g−1 DW) and
control (0.443 mg g−1 DW). In addition, the δ 13C root soluble
sugars (-28.60 ‰) equaled control values (-29.00 ‰) (Fig. 2).
Isotopic analysis and quantification of lipids
The content and δ13C of lipids showed significant
differences only in the roots (Fig. 3). Under maximum water deficit (18th day), the amount of root lipids indicated
Figure 1. Correlation between carbon isotopic composition (δ13C) of leaves and stomatal conductance (g
s) in control, water deficit,
and rehydration treatments of Copaifera langsdorffii Desf. The line indicates the relationship between the variables. All values are
means ± standard deviations (n=9). Spearman’s test obtained a correlation coefficient of −0.587, R2=0.3194 and p = 0.00137. p < 0.05
indicates a significant correlation between the two variables.
Figure 2.Quantification and carbon isotopic composition (δ13C) of leaf (A), leaf bud (B) and root (C) soluble sugars of Copaifera
langsdorffii Desf. subjected to three different treatments (control, water deficit, and rehydration). All values are means ± standard deviations (n=9). Data were analyzed using one-way ANOVA followed by Tukey’s test (significance at 5 %). Different letters represent
statistical difference (P<0.05) between treatments.
control (0.133 mg g−1 DW). Conversely, the δ13C of root
lipids was higher (-27.06 ‰) than the control treatment (-28.19 ‰). On the last day of rehydration (37th day), the
content (0.153 mg g−1 DW) and δ13C (-28.61 ‰) of root
lipids equaled the control (Fig. 3).
Discussion
The gradual decrease of stomatal conductance (gs) and leaf water potential (ѰH₂Oleaf) in C. langsdorffii under water deficit indicated a reduction in water content of
foliar tissues. The reduction of the CO2 assimilation rate (A) and the transpiration rate (E) promoted a decrease in instantaneous water use efficiency (Wt) (Hommel et al.
2014). Consequently, the low values for the ratio of A to E
(Wt) are associated with a reduced amount of water in the mesophyll and biochemical limitations to photosynthesis due to water loss by transpiration and low CO2 assimilation. (Prieto et al. 2010; Ghaderi et al. 2011). Medrano et al.
(2003) showed that stomatal closure and reduction in A
the intercellular partial pressure of CO2 inside the leaf, consequently decreasing the flux of CO2 to the carboxylation enzyme Rubisco and suppressing biomass production (Matteo et al. 2014; Hentschel et al. 2015). After rehydration, the recovery of gas exchange and ѰH₂Oleaf were incomplete. Generally, plants subjected to water deficit recover 40-60% of maximum photosynthetic rate days after rehydration (Frosi et al. 2017); however, C. langsdorffii required more days of rehydration to completely recover gas exchange and ѰH₂Oleaf.
Under water deficit, resistance to diffusion due to
gs decrease limits the supply of CO2 to Rubisco, thereby decreasing biomass production in the Calvin cycle. The negative correlation between gs and δ13C
leaf indicated
that resistance to CO2 diffusion in intercellular spaces of carboxylation sites provoked changes in the isotope discrimination in C3 plants (Warren & Adams 2006). In chloroplasts, Rubisco has greater activity at neutral pH and, at that stage, isotope discrimination causes 12C enrichment
and a decrease in δ13C values (Gilbert et al. 2012; Ghashghaie
& Tcherkez 2013). Stomatal closure reduces Rubisco activity (Flexas & Medrano 2002) and pH decreases inside the chloroplast. This acidification causes 13C enrichment and
an increase in δ13C leaf.
Therefore, the reduction of Rubisco enzyme activity and acidification of the chloroplast enriches 13C in the soluble
sugars produced in leaves. The 13C are obtained from CO 2
fixation in the Calvin cycle. These 13C-enriched soluble
sugars are metabolized in photoassimilates, which are redistributed via phloem to the roots and synthesized into other metabolites such as lipids (Hobbie & Werner 2004). Consequently, root lipids of C. langsdorffii are 13C-enriched.
The enrichment of 13C in root lipids under water deficit
occurs due to oxidation of pyruvate to acetyl-CoA by the
pyruvate dehydrogenase complex resulting in the depletion of lipids (Niro & Epstein 1977). Metabolic products derived from acetyl-CoA are isotopically depleted as a result of enzymatic fractionation (Bowling et al. 2008). The evaluation of the transport and conversion of soluble sugars into root lipids through 13C-enriched analysis can assist in further
studies on the effect of water deficit in forest species. Lipids are major components of cell membranes; however, the decrease in the amount of root lipids under water deficit is associated with a reduction of lipids in root cellular membranes (Queiroz et al. 2002). The high δ13C
and low amount of root lipids maintain membrane fluidity, reducing the water permeability of the cellular membranes and preserving cell turgidity. Thus, the cellular membranes are preserved and water absorption by roots is not impaired. However, after rehydration, the δ13C and amount of root
lipids are similar to the control. This response indicates the recovery of cellular membranes in conditions of full hydration.
In summary, water deficit can modify the assimilation of carbon in C. langsdorffii, changing the values of δ13C of
leaf soluble sugars and root lipids. The 13C-enriched root
lipids assist in the adjustment of root cellular membrane turgidity, and avoids damage to water absorption by roots. Examination of physiological responses to water deficit in forest species (such as C. langsdorffii) will assist in understanding the impacts of climate change and the physiological adjustments of plants of forest physiognomies.
Acknowledgements
This work was funded by Conselho Nacional de Desenvolvimento Científico e Tecnológico (CNPq). We
Figure 3.Quantification and carbon isotopic composition (δ13C) of leaf (A), leaf bud (B) and root (C) lipids of Copaifera langsdorffii
Desf. subjected to three different treatments (control, water deficit, and rehydration). All values are means ± standard deviations (n=9). Data were analyzed using one-way ANOVA followed by Tukey’s test (significance at 5 %). Different letters represent statistical
thank the Stable Environmental Isotope Center for their contribution to isotope analysis.
References
Adiredjo AL, Navaud O, Lamaze T, Grieu P. 2014. Leaf carbon isotope discrimination as an accurate indicator of water-use efficiency in sunflower genotypes subjected to five stable soil water contents. Journal Agronomy and Crop Science 200: 416-424.
Bowling DR, Pataki DE, Randerson JT. 2008. Carbon isotopes in terrestrial ecosystem pools and CO2 fluxes. New Phytologist 178:24-40. Chaves MM, Flexas J, Pinheiro C. 2009. Photosynthesis under drought and
salt stress: regulation mechanisms from whole plant to cell. Annals of Botany 103: 551-560.
Chen W, Sommerfeld M, Hu Q. 2011. Microwave-assisted Nile red method for in vivo quantification of neutral lipids in microalgae. Bioresource Technology 102: 135-141.
Cysneiros VC, Pereira-Moura MVL, Paula EP, Braz DM. 2011. Arboreal Eudicotyledons, Universidade Federal Rural do Rio de Janeiro Botanical Garden, state of Rio de Janeiro, Brazil. Check List 7: 001-006. Dubois M, Gilles KA, Hamilton JK, Rebers PA, Smith F. 1956. Colorimetric
method for determination of sugars and related substances. Analytical Chemistry 28: 350-356.
Ebdon JS, Kopp KL. 2004. Relationships between water use efficiency, carbon isotope discrimination, and turf performance in genotypes of Kentucky bluegrass during drought. Crop Science 44: 1754-1762. Farrell C, Szota C, Williams NS, Arndt SK. 2013. High water users can
be drought tolerant: using physiological traits for green roof plant selection. Plant Soil 372: 177-193.
Flexas J, Medrano H. 2002. Drought-inhibition of photosynthesis in C3 plants: stomatal and non-stomatal limitations revisited. Annals Botany 89: 183-189.
Franco DM, Saldanha LL, Neto JDSL, Santos LCD, Dokkedal AL, Almeida LFRD. 2016. Seasonal variation in allelopathic potential of the leaves of Copaifera langsdorffii Desf. Acta Botanica Brasilica 30: 157-165 Freitas CV, Oliveira PE. 2002. Biologia reprodutiva de Copaifera langsdorffii
Desf. (Leguminosae, Caesalpinioideae). Brazilian Journal of Botany 25: 311-321.
Frosi G, Harand W, Oliveira MTD, et al. 2017. Different physiological responses under drought stress result in different recovery abilities of two tropical woody evergreen species. Acta Botanica Brasilica 31: 153-160.
Garcia IS, Souza A, Barbedo CJ, Dietrich SMC, Figueiredo-Ribeiro RCL. 2006. Changes in soluble carbohydrates during storage of Caesalpinia echinata Lam. (Brazilwood) seeds, an endangered leguminous tree from the Brazilian Atlantic forest. Brazilian Journal of Biology 66: 739-745. Ghaderi AR, Talaie A, Ebadi A, Lessani H. 2011. The physiological response of three Iranian grape cultivars to progressive drought stress. Journal of Agricultural Science and Technology 13: 601-610
Ghashghaie J, Tcherkez G. 2013. Isotope ratio mass spectrometry technique to follow plant metabolism: principles and applications of 12C/13C
isotopes. In: Rolim D. (ed.) Metabolomics coming of age with its technological diversity. Vol. 67. p. 377-405.
Gilbert A, Robins RJ, Remaud GS, Tcherkez GG. 2012. Intramolecular
13C pattern in hexoses from autotrophic and heterotrophic C 3 plant
tissues. Proceedings of the National Academy of Sciences 109: 18204-18209.
Guerfel M, Baccouri O, Boujnah D, Zarrouk M. 2008. Changes in lipid composition, water relations and gas exchange in leaves of two young ‘Chemlali’and ‘Chetoui’olive trees in response to water stress. Plant Soil 311: 121-129.
Hentschel R, Hommel R, Poschenrieder W, et al. 2015. Stomatal conductance and intrinsic water use efficiency in the drought year 2003: a case study of European beech. Trees 30: 153-174.
Hobbie EA, Werner RA. 2004. Intramolecular, compound‐specific, and bulk carbon isotope patterns in C3 and C4 plants: a review and synthesis. New Phytologist 161: 371-385.
Hommel R, Siegwolf R, Saurer M, et al. 2014. Drought response of mesophyll conductance in forest understory species-impacts on water‐ use efficiency and interactions with leaf water movement. Physiologia Plantarum 152: 98-114.
Hu M, Shi Z, Xu P, Li H, Zhang Z. 2015. Wheat acclimate to water deficit by modifying carbohydrates metabolism, water use efficiency, and growth. Brazilian Journal of Botany 38: 505-515.
IPCC - Intergovernmental Panel on Climate Change. 2013. Climate Change 2013: The physical science basis. Geneva, Printed by IPCC. www.ipcc.ch Ivits E, Horion S, Erhard M, Fensholt R. 2016. Assessing European ecosystem stability to drought in the vegetation growing season. Global Ecology and Biogeography 25: 1131-1143.
Kagotani Y, Nishida K, Kiyomizu T, Sasaki K, Kume A, Hanba YT. 2015. Photosynthetic responses to soil water stress in summer in two Japanese urban landscape tree species (Ginkgo biloba and Prunus yedoensis): effects of pruning mulch and irrigation management. Trees 30: 697-708.
Keersmaecker W, Lhermitte S, Tits L, Honnay O, Somers B, Coppin P. 2015. A model quantifying global vegetation resistance and resilience to short‐term climate anomalies and their relationship with vegetation cover. Global Ecology and Biogeography 24: 539-548.
Larsson KE, Nystrom B, Liljenberg C. 2006. A phosphatidylserine decarboxylase activity in root cells of oat (Avena sativa) is involved in altering membrane phospholipid composition during drought stress acclimation. Plant Physiology and Biochemistry 44: 211-219. Leavitt SW, Wright WE. 2002. Spatial expression of ENSO, drought, and summer monsoon in seasonal δ13C of ponderosa pine tree rings in
southern Arizona and New Mexico. Journal of Geophysical Research 107: 1-10.
Lévesque M, Saurer M, Siegwolf R, et al. 2013. Drought response of five conifer species under contrasting water availability suggests high vulnerability of Norway spruce and European larch. Global Change Biology 19: 3184-3199.
Matteo G, Perini L, Atzori P, et al. 2014. Changes in foliar carbon isotope composition and seasonal stomatal conductance reveal adaptive traits in Mediterranean coppices affected by drought. Journal of Forest Research 25: 839-845.
Medrano H, Escalona JM, Cifre J, Bota J, Flexas J. 2003. A ten-year study on thephysiology of two Spanish grapevine cultivars under field conditions: effects ofwater availability from leaf photosynthesis to grape yield and quality. Functional Plant Biology 30: 607-619. Meng Y, Ma N, Zhang Q, et al. 2014. Precise spatio‐temporal modulation
of ACC synthase by MPK6 cascade mediates the response of rose flowers to rehydration. Plant Journal 79: 941-950.
Nate GM, Craig DA, Laura M. 2010. Growth, carbon-isotope discrimination, and drought-associated mortality across a Pinus ponderosa elevational transect. Global Change Biology 16: 399-415.
Niro MJ, Epstein S. 1977. Mechanism of carbon isotope fractionation associated with lipid synthesis. Science 197: 261-263.
Pasho E, Camarero JJ, Luis M, Vicente-Serrano SM. 2011. Impacts of drought at different time scales on forest growth across a wide climatic gradient in north-eastern Spain. Agricultural Forest Meteorology 151: 1800-1811.
Prieto JA, Lebon E, Ojeda H. 2010. Stomatal behavior of different grapevine cultivars in response to soil water status and air water vapor pressure deficit. Journal International des Sciences de la Vigne et du Vin 44: 9-20.
Queiroz CGS, Garcia QS, Filho JPL. 2002. Atividade fotossintética de lipídios de membrana em plantas de aroeira-do-sertão sob estresse hídrico e após reidratação. Brazilian Journal of Plant Physiology 14: 59-63.
Reddy TY, Reddy VR, Anbumozhi V. 2003. Physiological responses of groundnut (Arachis hypogaea L.) to drought stress and its amelioration: A critical review. Plant Growth Regulation 51: 205-227.
Ronquim CC, Prado CHBDA, Paula NFD. 2003. Growth and photosynthetic capacity in two woody species of cerrado vegetation under different radiation availability. Brazilian Archives of Biology and Technology 46: 243-252.
Ronquim CC, Prado CHBDA, Souza JPD. 2009. Growth, photosynthesis and leaf water potential in young plants of Copaifera langsdorffii Desf. (Caesalpiniaceae) under contrasting irradiances. Brazilian Journal of Plant Physiology 21: 197-208.
Thameur A, Lachiheb B, Ferchichi A. 2012. Drought effect on growth, gas exchange and yield, in two strains of local barley Ardhaoui, under water deficit conditions in southern Tunisia. Journal of Environmental Management 113: 495-500.
Vaz M, Pereira JS, Gazarini LC, et al. 2010. Drought-induced photosynthetic inhibition and autumn recovery in two Mediterranean oak species (Quercus ilex and Quercus suber). Tree Physiology 30: 946-956. Vicente-Serrano SM, Gouveia C, Camarero JJ, et al. 2013. Response
of vegetation to drought time-scales across global land biomes. Proceedings of the National Academy of Sciences 110: 52-57. Wanek W, Heintel S, Richter A. 2001. Preparation of starch and other
carbon fractions from higher plant leaves for stable carbon isotope analysis. Rapid Communications in Mass Spectrometry 15: 1136-1140. Warren CR, Adams MA. 2006. Internal conductance does not scale with