Microbial planktonic communities characterization in sea surface waters at South of Pico Island, using molecular techniques
76
0
0
Texto
(2) ....don’t give up... .
(3) TABLE OF CONTENTS ABSTRACT. 1. RESUMO. 2. I. INTRODUCTION Work Integration. 3 4. II. BACKGROUND. 6. 2.1. Microbial Plankton Ecology. 6. 2.2. Molecular Ecology Aproaches: Ecology in a Changing World. 8. 2.2.1. Molecular Techniques. 8. 2.2.1.1. Denaturing Gradient Gel and Microbial Community Fingerprinting 2.2.2. Fluorescence Microscopy: Precision and Quantification. 8 9. 2.3. Microbial Ecology Data: within the ecological context 2.3.1. Band Community Profile: community fingerprinting. 10 10. 2.3.2. Jaccard´s Index. 11. 2.4. The Atlantic Ocean: Azores Region 2.5. Present work integration in ongoing umbrella projects. 11 13. 2.5.1. DEECON. 13. 2.5.2. LAMAR. 14. 2.5.3. CIMBA 2.5.4. OPALINA. 14 15. III. MATERIALS AND PROCEDURES. 16. 3.1. Field sites and sample collection. 16. 3.1.1. Physical parameters 3.1.2. Biological parameters. 16 17. 3.2. Sample processing. 18. 3.2.1. Physical Parameters. 18. 3.2.2. Biological Parameters. 21. Nutrient Analysis Photosynthetic Pigments. 21 21. Microplankton abundance 3.2.3. Molecular biology procedure to determine microplanktonic composition. 21 22. Genomic DNA extraction. 22. Genomic DNA Concentration Polymerase Chain Reaction to detect Archaea incidence. 23 23. Denaturing Gradient Gel of Electrophoresis 3.3. Data Analyses. 23 24. 3.3.1. Physical and Environmental Parameters. 24. iii.
(4) 3.3.2. Microplanktonic Community Characterization. 25. Microplanktonic cells abundance Total Genomic DNA data Analysis. 25 25. Archaea and Bacteria spatial identification DGGE Analyses. 26 26. Jaccard’s index for Microplanktonic Community Comparisons. 27. IV. RESULTS. 28. 4.1. Physical Data. 28. 4.1.1. Geostrophic currents. 28. 4.1.2. Sea surface temperature (SST) 4.1.3. Chlorophyll a concentration. 29 30. 4.2. Chemical Data. 31. 4.3. Biological Microplanktonic Data. 31. 4.3.1. Microbial plankton cells density. 32. 4.3.2. Archaea and Bacterial spatial distribution based on PCR detection 4.3.3. Bacterial microplanktonic community fingerprint assessed using DGGE. 36 38. 4.3.4. Microbial Community Similarites Using Jaccard’s Index. 39. Bacteria community comparisons for South of Pico Island area: CIMBA I02 Cruise. 39. Bacteria community comparison for the open ocean seamount area: DEECON V08 Cruise. 40. Sea surface microbial community spatial distribution: Data Merge. 41. V.Discussion. 48. VI. Conclusion. 53. Acknowledgments. 55. References. 57. Appendices. 60. iv.
(5) ABSTRACT. Even though about 70% of the Earth is covered by the connected water mass of the global ocean, and despite the paramount importance of microbial plankton for the functioning of the marine ecosystem, global perspectives on diversity and distribution of these organisms have been largely overlooked. This work here present is integrated in DEECON, LAMAR and CIMBA interdisciplinary projects. The main focus of this work was to determine microplanktonic diversity patterns for the south of Pico Island region (Azores archipelago, NE Atlantic) and to relate these with local dynamics. The sampling effort was concentrated on south of Pico Island (38,5o-37,8o N, 27,5o-29,0o W), a main “coastal” target region for DEECON since it harbors a black scabbarfish population (Aphanopus intermedius). Thus far, there is no obvious reasoning for this deep water fish habitat isolation within south of Pico Island basin. The present work was developed in an attempt to improve our knowledge on the unique oceanographic characteristics of this area using microbial community fingerprinting as an indicator of surface waters dynamics that might shape environmental partition within the area. For this, surface water samples were collected during 2007 and 2008 cruises. These samples were filtered and preserved onboard the R/V “Arquipélago”. The microbial community diversity was assessed using a molecular phylogenetic approach based on partial 16S rDNAs, screened using molecular methods like DGGE. As a major outcome of this work three distinct biogeographical provinces are proposed based on multiple lines of evidence (Archaea distribution pattern, Bacteria microplanktonic community structure, and unicellular Eukarya richness). These provinces include 1) south of Pico Island, south eastern Agulha do Sul (Gigante) seamount, and southern Cavala seamount. 2) Northwestern Agulha do Sul (Gigante), Cavala (except southern Cavala) and Northern Monte Alto seamount area. 3) Voador and Monte Alto (with exception of northern Monte Alto) seamount.. 1.
(6) Resumo. RESUMO. Apesar de 70% da Terra ser coberta por uma única massa de água oceânica e da importância ímpar do plankton microbiano para o funcionamento do ecossistema marinho, estudos integrados de larga escala de distribuição e diversidade metabólica destes organismos são quase inexistentes.. Este trabalho encontra-se integrado em vários projectos interdisciplinares:. DEECON, LAMAR e CIMBA. O objectivo principal proposto neste projecto foi a determinação de padrões de diversidade microplanctonica para a região a sul da Ilha do Pico (Arquipélago dos Açores, Atlantico NE) e o relacionamento destes com dinâmicas oceânicas à micro/meso escala. O esforço de amostragem foi intensificado a sul da Ilha do Pico (38,5o-37,8o N, 27,5o-29,0o O), visto ser a area costeira alvo principal do projecto DEECON, em Portugal, uma vez que alberga uma população de peixe espada composta exclusivamnete por Aphanopus intermedius. Até ao momento não existe uma razão óbvia para o isolamento do habitat desta especie a sul da Ilha do Pico. Este trabalho foi desenvolvido com o intuito de melhorar o conhecimento sobre a região no que diz respeito às caracteristicas oceanográficas, através do uso de padrões ou assinaturas distintas da comunidade microplantónicas. Estas assinaturas funcionam como indicadores da dinâmica de águas superficiais e podem de certa forma estar na base da diferenciação de regiões biogeográficas. Para tal, amostras de água superficial foram colhidas durante diferentes cruzeiros entre 2007 e 2008. Estas amostras foram filtradas e preservadas a bordo do navio de investigação “Arquipélago”. A diversidade microplanctónica aferida através do uso do marcador filogenético 16S rDNA, separado usando a metodologia de DGGE. A partir destes resultados, três provincias biogeográficas distintas são propostas com base em várias linhas de evidência (padrão de distribuição de Archaea, estrutura da comunidade microplanctónica de Bacteria e riqueza Eukarya unicelulares). Estas provincias incluem: 1) Sul da Ilha do Pico, Sudoeste do monte submarino Agulha do Sul (Gigante) e sul do monte submarino Cavala. 2) Noroeste do monte submarino da Agulha do Sul (Gigante). 3) Montes submarinos Voador e Monte Alto (com excepção do norte do monte submarino Monte Alto).. 2.
(7) Introduction. I. INTRODUCTION The oceans cover more than 70% of the Earth's surface, and were probably the birthplace of Life on Earth (DELONG 2007). Representing an integrated global living system where energy and matter transformations are governed by interdependent physical, chemical and biotic processes it interacts over broad spans of time and space. Although the fundamentals of ocean physics and chemistry are well established, comprehensive approaches to describing and interpreting oceanic microbial diversity and processes are only now emerging (DELONG & KARL 2005). In the last 30 years, marine microbiology and microbial oceanography have witnessed remarkable progress (DELONG 2007) which have been balancing out the dark ages during which oceanographers were incapable of determining the importance and metabolic diversity of microbial plankton (DELONG 2007). Despite the paramount importance of microbial plankton for the functioning of the marine ecosystem, global perspectives of diversity and distribution has been largely overlooked (POMMIER et al. 2007). A major breakthrough in the assessment of marine microbial diversity came with the application of molecular phylogeny using nucleotide-sequence analysis of the small-subunit ribosomal (r)RNA gene (ss-rDNA) (PACE 1997 et al.; KARL 2007). In contrast to the most terrestrial habitats, life in the sea is dominated, both in terms of biomass and metabolism, by microorganisms from all three domains of life (Bacteria, Archaea and Eukaria) (KARL 2007). Because of their small size, great abundance and easy dispersal, it is often assumed that marine planktonic microorganisms have a ubiquitous distribution that prevents any structured assembly into local communities. Marine planktonic microorganisms are truly hitched to everything else in the ocean universe. This community perspective is essential for understanding the distribution and function of microorganisms in Earth's oceans and aids our understanding of the sources and functions of the vast genomic diversity housed in the ocean's microbes (STROM 2008).. 3.
(8) Introduction. Work Integration. Despite the technological evolution, the oceans remain extremely under sampled, in both time and space. The emergence of sustained time-series measurements is as important as undeniable. Large-scale ecological experiments that are centered on microbial community structure and its interaction with the ocean ecosystem dynamic symbolize a fruitful area for future development (KARL 2007). Formidable challenges remain however unsolved, such as quantifying accurately the energy and material flux through newly recognized marine microbial plankton metabolic pathways and understanding better the net metabolic balance of the ocean surface waters. The aim of this work is to describe the sea surface microbial planktonic community structure and dynamics within the Azores plateau region, focusing in the seasonal variability south of Pico Island. This work results of a challenge to describe an important but overlooked community at the ocean sea surface that is exposed to extreme environmental changes caused by different physical, chemical and biological factors of this particular portion of the water column. In order to determine spatial/temporal variations, the abundance and microbial community structure was assessed through the use of molecular techniques. The community structure was then correlated with environmental factors such as sea surface temperature, geostrophic currents, chlorophyll a, and nutrients concentration. The metadata set was built from in situ measurements and water sample collections performed during several cruises on board the R/V Arquipélago (November 2007 to July 2008) between 35°-39° N and 32°-27° W. The sampling area encompasses not only the south of Pico Island region but encompassed also other offshore geographical areas for comparison purposes of geographical distinct regions. This project was developed to address two main questions related with microbial spatial/temporal variations: 1). Are there major differences between nearshore and offshore microbial community structure of sea surface waters?. 2). Does south of Pico Island region presents a unique microbial community structure?. This work was developed under the framework of the following projects: European Science Foundation (ESF) project DEECON (06-EuroDEEP-FP-008 & SFRH-EuroDEEP/0002/2007):. 4.
(9) Introduction. “Unravelling population connectivity for sustainable fisheries in the Deep Sea”, regional DRCT funded projects CIMBA (2006/06-M2.1/I/014/2005): “Implementation and development of a regional, national, and international network for Oceanographic Monitoring (Hidrodynamic and Biological) for the Azores Archipelago”, LAMAR (M2.1.2/F/008/2007): “Large-scale and Mesoscale dynamics of the Azores Region from remote-sensing and in-situ data and their effect on biological productivity”, and FCT/ESA funded project OPALINA (PDCTE/CTA/49965/2003): “Ocean Dynamics and related Productivity of the Northeast Subtropical AtLantIc Near the Azores region using ENVISAT, ERS, SeaWiFS, NOAA, and in situ data”. The following Section presents background information on microbial plankton ecology, characterization of area of study, introduction to some molecular techniques, and main work underlying projects. Section 3 describes the data set and the methodology. Section 4 presents the results. Section 5 discusses the results obtained and section 6 presents the conclusions from this study.. 5.
(10) Background. II. BACKGROUND 2.1. Microbial Plankton Ecology The history of microbial evolution in the oceans is probably as old as the history of life itself. In contrast to terrestrial ecosystems, microorganisms are the main form of biomass in the oceans. Microorganisms form some of the largest populations on the planet. Certain characteristics of the ocean environment, in particular the prevailing low-nutrient state of the ocean surface are used as reasoning grounds to regard this environment as an extreme ecosystem (GIOVANNONI & STINGL, 2005). Through the use of ribosomal RNA gene sequences (ss-rDNA), three phylogenetically distinct cellular lineages have been identified, two of which are prokaryotic, the Bacteria and Archaea, and one eukaryotic, the Eukarya. All three groups are thought to have diverged from a common ancestral organism early in the Earth’s Life history (MADIGAN et al. 2000). Planktonic Bacteria, Archaea and Eukarya reside and compete in the ocean's photic zone under the pervasive influence of light (DELONG et al. 2006). Even though about 70% of the Earth is covered by the connected water mass of the global ocean, and despite the paramount importance of microbial plankton for the functioning of the marine ecosystem, global perspectives on diversity and distribution of these organisms have been largely overlooked. Neverthless, FINLAY (2002) and FENCHEL & FINLAY (2004) have proposed that a majority of marine planktonic microorganisms should be cosmopolitan, endemic species should be rare, and their global diversity should be low. Accordingly, marine planktonic microorganisms should not exhibit biogeographical patterns like the latitudinal gradient of increasing species richness from polar to equatorial regions, which is characteristic of many macroscopic animal and plants (HILLEBRAND, 2004). Regarding one of the main arguments behind the 'everything is everywhere' dictum is idea that dispersal and subsequent microbial colonization into new locations is so great that it prevents any spatial differentiation (FINLAY, 2002; FENCHEL & FINLAY, 2004). Small body sizes, huge populations sizes, few geographical barriers and mixing of waters due to wind, waves and currents, should facilitate the dispersal of marine microbial plankton (COLLINS, 2001 fidé POMMIER et al. 2007) creating an equal world of opportunities for microbial dispersal. The recent studies of large-scale shotgun sequencing of seawater genomic DNA (gDNA) provide much higher resolution via 16S rRNA gene (16S rDNA) phylogenies and biogeographical 6.
(11) Background. distributions for marine microbial plankton (GIOVANNONI & STINGL, 2005). Our ignorance regarding patterns of microbial diversity is primarily due to significant theoretical and practical problems that have, until recently, hindered the quantification of microbial diversity. These problems include the very small proportion of microbial species that can be cultured (AMANN et al. 1995), the very large number of individuals that may be present per sample, the high diversity that may be present at small scale and difficulty on defining a microbial species (GOODFELLOW & O'DONNELL, 1993). However, solutions to many of these problems have recently been developed, like for example a number of new techniques that allow us to assess microbial diversity without depending upon culturing were recently developed (HUGHES et al., 2001). The most promising of these suites of techniques is the use of ribosomal gene sequences (obtained directly from environmental gDNA) as microbial phylogenetic richness indicators (S TACKEBRANDT & RAINEY 1995 fidé HORNER-DEVINE et al. 2003). Microbial plankton are essential regulators of biogeochemical cycles (FALKOWSKI et al. 2008). While acquiring resources for metabolic maintenance and growth, archaea, bacteria, and protists transform C-, N-, P- and S-containing compounds in ways that affect their availability for the remaining biological production. By doing so, they directly influence the ecosystem function and end up indirectly playing an important role on the Earth's climate balance. Questions about the relationships between plankton ecology and these transformations are at the heart of much ocean research and have existed since a century ago (S TROM, 2008). Understanding the distribution of organisms and investigating patterns of biodiversity is a primary goal of Ecology (RISSER et al. 1991) therefore the ability to detect microbial groupings in real time, at their natural environment is a crucial step towards achieving this goal within Microbial Ecology. While many factors likely affect the biodiversity of a region, primary productivity (PP) (the rate at which primary producers capture energy and perform carbon fixation) is emerging as a key determinant factor for plant and animal biodiversity, especially species richness (i.e. the number of species present; MITTELBACH et al. 2001). However, from the sparce data available it is not clear yet how, or even if, microbial diversity varies with PP. Understanding patterns of microbial diversity is an important challenge because microorganims may well compromise the majority of Earth's biodiversity and mediate critical ecosystem processes (HORNER-DEVINE et al. 2003).. 7.
(12) Background. 2.2. Molecular Ecology Aproaches: Ecology in a Changing World 2.2.1. Molecular Techniques Microbial diversity assessments and community structure characterizations directly from environmental samples have been made possible by technical developments in molecular biology during the last two decades. Since MUYZER et al. (1993), first reported the use of Denaturing Gradient Gel of Electrophoresis (DGGE) for the analysis of whole bacterial communities this fingerprint technique became the most popular tool to quickly characterize and compare microbial communities (VERSEVELD & RÖLING, 2004). This technique can be used to generate fingerprints not only of rRNA gene (rDNA) fragments but also of other functional genes of interest that may be PCR-amplified from the whole community genomic DNA (gDNA) or RNA (LIESACK & DUNFIELD, 2002 fidé SMALLA et al. 2007). The strength of these fingerprinting techniques lays in that a large numbers of samples can be analyzed and compared in a timely manner, making this ideal for ecological studies. The general principle of most molecular fingerprinting techniques is based on the electrophoretic separation of PCR-amplified marker gene fragments (SMALLA et al. 2007). Contemporary microbial community analysis frequently involves PCR-amplified sequences of the 16S rDNA. This technology carries however, for some species, the inherent problem of 16S rDNA heterogeneity (DAHLLÖF et al. 2000). Microbial community analysis using molecular methods such as PCR amplification of the 16S rDNA in combination with DGGE is commonly performed in microbial ecology (M UYZER & SMALLA, 1998). These methodologies have provided a new insight into microbial diversity and a more rapid, high-resolution description of microbial communities than that provided by the traditional approach of isolation of microorganisms (DAHLLÖF et al. 2000).. 2.2.1.1. Denaturing Gradient Gel and Microbial Community Fingerprinting. The DGGE gel banding pattern is being increasingly used for community analysis by correlating the number of bands (environmental sample richness) with environmental factors by calculating different similarity indices in order to trace changes in community structure due to environmental constrainments (NUBEl et al. 1999; VAN HANNEN et al. 1999). The band separation is based on the electrophoretic mobility of a partially melted DNA 8.
(13) Background. molecule within a polyacrilamide gel. The double strand fragments melting proceeds in discrete so-called melting domains: stretches of base pairs (bp) with an identical melting temperature. Once the melting domain with the lowest melting temperature arrives at a particular position in the DGGE gel, a transition of helical to partially melted molecules occurs, and the migration of the molecule will halt. Sequence variation within such domains causes their melting temperatures to differ. Sequence variants of particular fragments will therefore stop migrating at different positions in the denaturing gradient and hence, can be separated effectively using DGGE (LERMAN et al. 1984 fidé MUYZER 1993). This technique has been successfully applied to identifying sequence variations in a number of genes from several different organisms. DGGE can be used for direct analysis of gDNA from organisms with genomes of millions of bp. PCR can be used to selectively amplify a sequence of interest before the DGGE sorting (C ARIELLO et al. 1988 fidé MUYZER 1993). A modification of the method, GC-rich sequences can be incorporated into one of the primers to modify the melting behavior of the fragment of interest. This latter method improvement increases sorting stringency to the extent that sequence variations almost close to 100% can be detected (MYERS et al. 1988; SHEFFIELD et al. 1989 fidé MUYZER 1993). The intra-species heterogeneity observed in a DGGE banding pattern results of the presence of multiple copies of ribosomal genes and from the fact that gene copies have evolved differently (UEDA et al. 1999). For example, the 16S rDNA amplified fragment will appear as several bands on a DGGE gel, instead of a single band, each band presents a different migration rate that is representative of that particular gene sequence (DAHLLÖF et al. 2000). When using ss rRNA fingerprinting it is common practice to assume each band as representative of a particular bp sequence that contains enough phylogenetic information to describe a specific microbial grouping or species. These bands represent in the ecological sense operational taxonomic units (OTUs) and can be used as if of a species list that describes the community for a given environmental sample.. 2.2.2. Fluorescence Microscopy: Precision and Quantification. Direct observations of microbial cells from aquatic environment became an important technique that has improved the understanding of whole microbial populations effectives and allows for the study of shifts within the studied communities. The use of membrane filter 9.
(14) Background. techniques in combination with fluorochromes and microscopy techniques has permitted microbiologists to observe directly microbial cells and to estimate their density in many habitats (AMANN et al. 1992). The fluorescence microscope is used to visualize specimens that fluoresce, that is, emit light of one wavelength when light of another wavelength shines upon them. Fluorescence occurs either because of the presence within cells of naturally fluorescent substances such as chlorophyll a or other fluorescent components or because the cells have been treated with a fluorescent dye (MADIGAN et al. 2000). One of the mainstream staining methods to visualize living cells uses DAPI (4’,6Diamido-2-phenylindole) as the staining agent (MADIGAN et al., 2000). DAPI stains mainly the interior of the cells permitting the cells to fluoresce bright blue. More specifically, it binds to double stranded DNA, especially to the portions rich in adenine plus thymidine and the cells become easy to see and enumerate (BLOEM & VOS, 2004). Depending on the environmental sample, nonspecific background staining can be a problem but for most samples DAPI staining gives reasonable estimation of the total cell numbers. Planktonic cells can be immobilized and stained onto a membrane filter surface. These simple staining techniques have the one on one hand advantage of being non-specific, which allows for whole microbial community density estimates in a sample (MADIGAN et al. 2000).. 2.3. Microbial Ecology Data: within the ecological context. 2.3.1. Band Community Profile: community fingerprinting. Fingerprints results, such as DGGE profiles, can be analyzed based on qualitative (absence/presence) or quantitative (intensities) comparisons among different samples for OTUs that exhibit the same migration patterns (along same row). Relations between different bands are obtained by clustering the descriptors, the bands, instead of the objects, the community profiles. Clustering of community profiles, followed by clustering of bands, provides insight into which bands contribute to the observed cluster of the environmental samples (VERSEVELD & RÖLING, 2004).. 10.
(15) Background. 2.3.2. Jaccard´s Index. Diversity is the essential measure used to compare ecosystems. It enables the comparison of how different (or similar) a range of habitats or samples are in terms of variety (and sometimes abundances) of species found in them. One common approach to differentiate diversity is to look at how species or OTUs diversity changes along gradients (WILSON & MOHLER, 1983 fidé MAGURRAN, 1988). Another way of viewing diversity shifts is to compare the species compositions of different communities. The fewer species these communities or gradients share, the higher is the diversity differentiation among them (MAGURRAN, 1988). Similarity indices are frequently used to study the coexistence of species or the similarity of sampling sites. Jaccard´s index is one of the oldest similarity coefficient used and it is also one of the most useful (MAGURRAN, 1988). Moreover, it can be used in species conservation because it may be applied to the power function of the relationship between species and areas to determine a measure of optimum size for natural conservation reserves (HIGGS & USHER, 1980). This index is designed to equal “1” in case of complete similarity (that is, when the two sets of species are identical) and “0” if the sites are dissimilar (have no species in common) (MAGURRAN, 1988). The Jaccard’s index does not take into account negative matches. In this way the similarity between two operational taxonomic units (OTUs) is not influenced by other OTUs included in the analysis, and the Jaccard´s value is independent of the number of OTUs studied (REAL & VARGAS, 1996). One of the great advantages of this measure is the simplicity. However, this virtue may also be a disadvantage in that the coefficient takes no account for OTUs abundance. All OTUs are count equally in the equation irrespective of whether they are abundant or rare (M AGURRAN, 1988).. 2.4. The Atlantic Ocean: Azores Region. The vast oligotrophic areas of the open ocean have been the less explored areas (DAM et al. 1995; ZANG et al. 1995), especially in the Atlantic Ocean. It is of high importance to fill in this gap since it is estimated that these oligotrophic regions contribute up to 80% of the global ocean production and 70% of the total exported production (KARL et al. 1996). These areas are usually 11.
(16) Background. characterized by low levels of biological productivity, but the presence of hydrodynamics mesoscale features such as fronts (LE FÈVRE, 1986), eddies (FALKOWSKI et al. 1991) or topographic features like seamounts (BOEHLERT & GENIN, 1987) has been suggested as means to sustain enhanced levels of plankton biomass and production (HUSKIN et al. 2001). These features represent an input of nutrients to the photic layer, leading to increases in biological production favoring short food webs (LEGENDRE & LE FEVRE, 1989 fidé HUSKIN et al. 2001). The Azores region is located at the northern edge of the North Atlantic Subtropical Gyre (SG)- the rotor of the North Atlantic (NA) circulation (BASHMACHNIKOV et al. 2004) between the latitudes of 36º 45’N and 39º 43’N and the longitudes of 24º 45’W and 31º 17’W (S ANTOS et al., 2004). This area is characterized by a rather high horizontal temperature gradient (BASHMACHNIKOV et al. 2004). During most of the year (September to March), the region is frequently crossed by the North Atlantic storm-track, the main path of rain-producing weather systems. During late spring and summer, the Azores climate is influenced by the Azores anticyclone (SANTOS et al. 2004). Although the Azores are a group of islands located in the NE Atlantic, and therefore, open ocean dynamics are important to explain marine biological diversity, their coastal areas are prone to be also affected by local dynamics and near-coast circulation variability Coastal zones are, in general, more productive than offshore waters (LONGHURST et al. 1998) and nutrient enrichment can be expected to yield a succession of effects that is dependent upon local hydrodynamics of the area. Significant nutrients inputs to the coastal zones can arrive via rivers or streams, groundwater, and/or atmosphere. Nutrient fluxes through these routes have been increased by human activity. In addiction, the N:P:Si input ratios have shifted (normally by an increase on total N) and many coastal management practices exacerbate these perturbations. Nevertheless, nutrient fluxes through the coastal zone appear to be still dominated by large inputs from the open-ocean, and there is little evidence of anthropogenic disruption (JICKELLS , 1998) It is relatively straightforward to schematically understand the processes regulating the behavior of the key inorganic nutrients in coastal areas. However, the overall impact of these processes is strongly dependent on the physical characteristics of the system in question, primarily because of the very large dilution that occurs in the open-ocean waters adjacent to the coastal systems. Hence, it is the extent of exchange between the two systems that is strongly influenced. In recent years, there have been a number of attempts to try to synthesize the 12.
(17) Background. knowledge of coastal zones into a more generalized understanding, notably in a series of articles addressing the N and P budgets for the NA (GALLOWAY et al., 1996 fidé JICKELLS, 1998). Differences between coastal and oceanic gyre microbial plankton populations have been reported (MULLINS et al. 1995). Typically, continental shelves (coastal seas) are far more productive than ocean gyres because of physical processes such as upwelling and mixing, which bring nutrients to the surface. However, most of the microbial taxa found in oceanic gyres also tend to occur in large numbers on coastal seas (GIOVANNONI & STINGL, 2005).. 2.5. Present work integration in ongoing umbrella projects. 2.5.1. DEECON ”Unravelling population connectivity for sustainable fisheries in the Deep Sea”. The aim of this EU funded project is to unravel population structure and population connectivity in economically important deep-sea fish species, using molecular genetic markers, otolith microchemistry, and oceanographic modeling within a common statistical modeling framework. By adopting an interdisciplinary concerted approach, this project will provide guidance to the exploration of spatial distribution of intra-specific biodiversity for specific species of bony fish and sharks sampled from the continental slopes and from the Mid Atlantic Ridge (MAR). Data obtained through genetic, phenotypic and oceanographic environmental assessments will be integrated. DEECON should help to unravel processes responsible for shaping the patterns of population connectivity in the deep-sea. To identify stock that will react independently to exploitation, provide a platform for evidence-base management strategies, and evaluate the potential for biodiversity loss caused by deep-sea fisheries and other anthropogenic pressures are some of the main objectives contemplated in the projects framework. The Azores region is an area of interest since the water masses represent a complex combination of factors that might be responsible in shaping genetic structure in marine organisms. This work, as a microplanktonic community characterization, represents and important tool to better understand this specific on going dynamics in the coastal region south of Pico Island. 13.
(18) Background. 2.5.2. LAMAR “Large-scale and Mesoscale dynamics of the Azores Region from remote-sensing and insitu data and their effect on biological productivity.”. Regional funded project LAMAR (M2.1.2/F/008/2007). In the open ocean the upper photic layer is nutrient poor due to the constant decrease of the nutrient pool caused by the sinking of organic particles away from the photic layer. Released in the deep waters, the nutrients can return to the biologically active upper layers mainly through the areas of enhanced vertical water transport. In subtropical regions, ocean frontal zones and vortex structures often are associated with enhanced vertical transport and are supposed to play an important role in maintaining primary productivity and biodiversity in the ocean. With this general motivation in mind, the project objectives are to study multi-scale variability and dynamics of circulation patterns in the Azores region, and their effect on primary productivity. The region of study includes the Azores Archipelago and the surrounding waters (33-43oN and 22-32oW). The project is executed in collaboration with the Department of Oceanography at the St. Petersburg State University (Russia).. 2.5.3. CIMBA “The Implementation and Development of a Regional, National and International network for Oceanographic Monitoring (Hidrodynamic and Biological) of the Azores Archipelago”. Regional funded project CIMBA (2006/06-M2.1/I/014/2005). CIMBA is an important contribution for to the Azores regions and constitutes a great effort to the development of and integrated regional/national/international data systems for the Oceanography in the region. The Azores region, surface waters of which are a part of subtropical gyre circulation, is a dynamically relatively calm area of the Subtropical North Atlantic. Short term scale movements in oceanic regions are dominated by tides. Coming from the southwest, the tidal wave front, near the Azores archipelago, experience high level of distortion due to high bathymetric variations. Insufficiency of the sustained observations in the Azores region makes it difficult to perform detailed predictions even for the main tidal waves propagating in topographically complex areas of the archipelago. Also, due to lack of 14.
(19) Background. observations, no attempts are made for prediction of tidal currents.. With this general. motivation in mind, CIMBA project main goals are: a) to delineate a 3D picture of mean ocean flows, as well as, study their seasonal variability using previous records; b) to delineate a picture of barotropic tidal currents in the Azores region; c) to evaluate places for future observational network for circulation monitoring: c) to identify areas of enhanced vertical mixing on the basis of internal tidal wave energy distribution: and d) to evaluate the regions of enhanced biological productivity. CIMBA is an important contribution to the Azores region and constitutes a great effort to the development of integrated regional/national/international data systems for Oceanography.. 2.5.4. OPALINA “Ocean Dynamics and related Productivity of the Northeast Subtropical AtLantIc Near the Azores region.”. FCT/ESA funded project OPALINA (PDCTE/CTA/49965/2003). The main objective of this project is to study ocean dynamics and productivity in the Azores region. In particular, spatial and temporal variability of SST and phytoplankton distributions are assessed using satellite and in situ data. These in turn, are related to physical processes to infer possible underlying forcing mechanisms (e.g. North Atlantic Oscillation (NAO), Azores current/front system (AzC/F), wind, internal waves and mixing, exchange across fronts). In addition, satellite data is combined with fisheries data to study meridional and zonal distributions. In order to accomplish this, and according to the objectives proposed, four sub-regions are studied. New imagery processing methods, more accurate algal biomass derivation, intercalibration parameters determination improvement, and automated processing and backup routines development are expected.. 15.
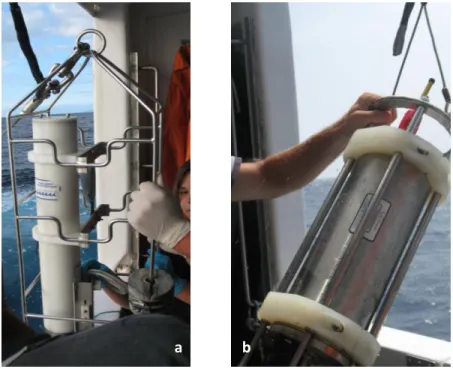
(20) Materials and Procedures. III. MATERIALS AND PROCEDURES. 3.1. Field sites and sample collection. In order to study temporal and spatial variations within microbial community composition, surface seawater was collected on board the R/V Arquipélago during five independent cruises: CIMBA I02, in November 2007 (Fall) (hereafter as referred to as CIMBA); DEECON Mooring, in April 2008 (Spring) (hereafter as referred as DEECON-1), DEECON V08, in July 2008 (Summer) (here after as referred to as DEECON-2); LAMAR-OCE-2008-V01/DEECONOCE-2008-V02, July 2008 (Summer) (hereafter as referred to as LAMAR) and OPALINA V03, in August 2008 (Summer) (hereafter as referred to as OPALINA) For cruise detailed information please consult the Appendix 1 (Figs.1-5). The study area was comprised between 35°-39°N and 32°-27°W (cf. Figs. 1 and 2) with a seasonal sampling effort focused on the south of Pico Island region since this was the study target area. The sampling stations were selected in order to cover different spatial areas from near shore, to further away from the islands shoreline, in open ocean, and near seamounts. In each cruise, sea surface water was collect at the selected sites using a black plastic bucket. The seawater was immediately transferred into a 5 L plastic bottle, protected from direct sunlight, and processed as soon as possible onboard.. 3.1.1. Physical parameters. Abiotic environmental parameters were simultaneously collected with the biological sampling. Such parameters were measured using different profilers: a Sea Bird conductivitytemperature-depth (CTD) profiler (SBE 19plus V2 SEACAT Profiler) (Fig. 3.a.) and a Midas CTD profiler (Valport) (Fig. 3.b.). Additionally, surface as well as three meters depth seawater temperatures were measured with a hand held digital thermometer (Crison).. 16.
(21) Materials and Procedures. a. b. Figure 3. CTD profilers used for this work. a. SeaBird CTD (maximum depth at 600m); b. Valport CTD (maximum depth at 2000m).. 3.1.2. Biological parameters. To describe the microplanktonic community composition, several different subsamples were performed. For nutrient analyses, a seawater subsample was separate in to 300 ml white bottles and stored at -20 C, onboard. For photosynthetic pigments analysis (the main pigment analyzed was chlorophyll a) 1 L of seawater per station was vacuum filtered (cf. Fig. 4) onto a 0.47 mm glass microfiber filter (Whatman GF/F, 0.45 μm pore diameter). The filter was blotted dried, folded several times, and stored dry, protected from sunlight, in eppendorfs at -20 C. For microplanktonic community composition analysis 1.5 L of well mixed seawater was filtered under low vacuum pressure conditions through a filtration system (cf. Fig. 4) onto a 47 mm Ø cellulose acetate filter (Sartorius Biolab, 0.2 µm pore Ø) which was handled with flamed sterilized tweezers. The filter with the immobilized cells was folded and stored into sterilized. 17.
(22) Materials and Procedures. eppendorfs in a 50% ethanol/seawater solution and was immediately frozen at -20ºC. Per station, two 1.5L filtrations were processed in order to produce two replicas: DNA1 and DNA2.. Figure 4. Filtration system settings as used onboard the R/V Arquipelago for the cruises.. To estimate the microplanktonic cells abundance, a sub-sample of a well mixed seawater (0.5 L) was filtered onto 0.2 µm polycarbonate filter membranes (Whatman, 47 mm Ø), under low vacuum pressure conditions. The filters were preserved in petri dishes with 200 µl of 50% ethanol/seawater solution and stored, protected from sunlight, at -20 C.. 3.2. Sample processing. 3.2.1. Physical Parameters. Physical parameters such as temperature, conductivity and depth were compiled in order to create different charts per cruise. The data was often overlaid with bathymetry, temperature, and ocean color images for the correspondent collection dates. Mean geostrophic currents derived from AVISO altimetry data and from CTD data were also computed.. 18.
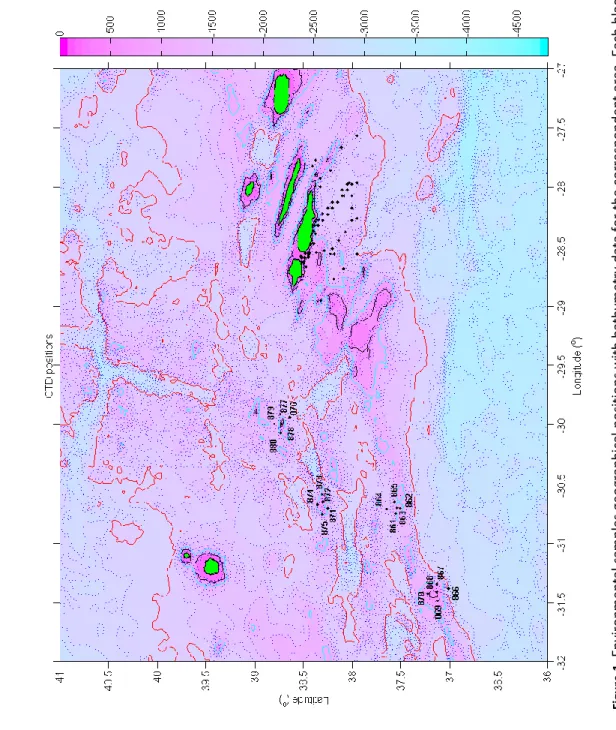
(23) represent sampling stations from CIMBA and OPALINA cruises that can be better visualized in Fig. 2.. Stations numbered from 860 to 881 were sampled during the DEECON-2 cruise in Summer 2008. All other black dots. dot corresponds to a single sampling station where physical, biological and chemical data collections occurred.. Figure 1. Environmental samples geographical positions with bathymetry data for the correspondent area. Each black. 19. Materials and Procedures.
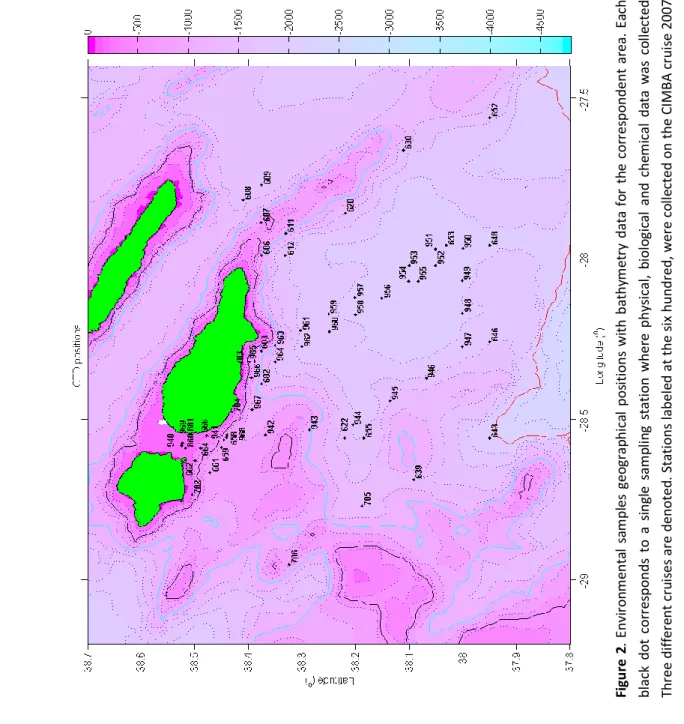
(24) 930 and 940 represent the reference stations.. cruise, in fall; Stations from the 940 to 969 represent collections from the OPALINA cruise in summer 2008; Stations from 702 to 706 represent the DEECON-1 (spring 2008). The stations labeled with the numbers 860, 881,. Three different cruises are denoted. Stations labeled at the six hundred, were collected on the CIMBA cruise 2007. black dot corresponds to a single sampling station where physical, biological and chemical data was collected. Figure 2. Environmental samples geographical positions with bathymetry data for the correspondent area. Each. 20. Material and Procedures.
(25) Materials and Procedures. 3.2.2. Biological Parameters. Nutrient Analysis Nutrients concentration for dissolved nitrate (NO22-) and phosphate (ortophosphates and total phosphate) were determined using the San++ Automated Wet Chemistry Analyzer which is based on a continuous flow analysis (CFA) technique. This equipment uses a multichannel peristaltic pump to mix the samples and the chemical reagents in a continuously flowing stream determining the several parameters by using automated colorimetric analysis. To nutrients parameters were measured at the Department of Oceanography and Fisheries (DOP/UAç).. Photosynthetic Pigments. Chlorophyll a was extracted with acetone, according to the “Turner Fluorometer” method suggested by YENTSCH and MENZEL (1963) and subsequently revised by HOLM-HANSEN and colleagues (1965). The pigment concentration was determined using a fluorescence spectrometer, the LS 55 FluorescenceSpectrometer (DOP/UAç). This method is based on the samples acidification, which corrects for the presence of phaeophytin pigments allowing for a more accurate reading of chlorophyll a pigment. The filters that were preserved on board are transferred into plastic tubes with 8 mL of 90% acetone to extract the cells pigments and are maintained overnight, in the fridge, protected from light. Once the pigments were extracted an aliquot of the supernatant was read at two different times: first reading was made with the supernatant alone and the second reading was made with the supernatant plus three drops of 0.1 HCl, to acidify the sample. Each sample was read three times through the fluorescence spectrometer.. Microplankton abundance. For the cell enumeration, membrane filtered samples were stained with 4’,6’diamidino-2-phenylindole (DAPI) and counted under epifluorescence microscopy (DM600B Leica) using the DAPI filter and the maximum magnification. Microbial cells densities for cells. 21.
(26) Materials and Procedures. containing natural occurring fluorescence was also estimated for each site using the appropriate filters (DAPI, FLUO and TexasRed filters). The cells were incubated for 10 min with 1000 µl of DAPI solution (2 µl/ml) in the dark, at room temperature. After the incubation the cells were washed and cleaned with 1x PBS buffer solution (1000 µl) for 5 min, in the dark, at room temperature. The PBS solution was removed and the filter was cut in two parts and placed on the microscope slide using immersion oil as the mounting media (SOURNIA 1978). Various images were taken (with a Leica DFC340FX fluorescence camera) per sampling station. The microphotographs were taken at different magnifications (10x, 20x, 40x, 63x and 100x) with the DAPI filter (spectrum: 260nm – 600nm; maximum emission: 462nm). Five images were randomly selected from all maximum magnification images taken (with the 100x objective). These images were used to determine microbial microplankton densities. Magnifications below 100x were used to detect the presence of characteristic pico and microeukaryotes in the samples.. 3.2.3. Molecular biology procedure to determine microplanktonic composition. The study of the microbial plankton community composition was done using culturing independent techniques that involved nucleic acid fingerprinting. In order to conduct this analysis a suite of molecular techniques was used. These are described within the following paragraphs.. Genomic DNA extraction. The whole community genomic DNA was extracted according to the CTAB method by AUSUBEL et al. 1994 optimized by AGUIAR et al. 2004. For a complete detailed, step by step procedure see Appendix 1 (Protocol 1).. 22.
(27) Materials and Procedures. Genomic DNA Concentration. Genomic DNA concentration was measured with different reading systems and each sample was read two times. For DNA 1 and DNA 2 correspondent to CIMBA cruise, the NanoPhotometer (IMPLEN) was used to quantify the gDNA. Per sample, one drop (~2 μl) of gDNA sample was used. For the other three cruises: DEECON-1, DEECON-2, 2008 and OPALINA, the GENEQUANT II (from Pharmacia Biotech) was used. Per sample, a 2 μl aliquote for 98 μl of ddH2O was used for gDNA quantification.. Polymerase Chain Reaction to detect Archaea incidence. PCR amplification was used to test for the presence and quality of Archaea representatives among the microplanktonic communities studied. The amplification cycles used were as described in AGUIAR (2005). For Archaea amplification, the primer set used was the universal Archaeal primers 4F and 1492R (AGUIAR 2005; BURR et al. 2006). Per PCR reaction, 1.5 μl of each primer (10 pmol each), 10 μl of 5x Go Taq Flexi Buffer, 2 μl of 25 mM of MgCl 2 solution (25 mM), 0.4 μl of dNTPs (25 mM each), 0.25 μl (5 u/μl) of GoTaq Flexi DNA Polymerase (Promega) and 32.35 μl RNA/DNA free water were combined with 1 μl of genomic DNA template. The DNA template was the last component to be added to the mix. The PCR reaction products (5 μl) were visualized with ethidium bromide in a 2.0 % agarose gel (w/v) after a run of more or less 20 min, in TAE (1x) buffer solution at 90 V.. Denaturing Gradient Gel of Electrophoresis. The DGGE technique works by sorting the different genetic components contained in a small sample of specially amplified PCR product. This separation is achieved using an electrophoresis gel that contains chemical denaturing agents. The phylogenetic marker used for this part of the work was the 16S RNA gene. This gene target was directly PCR amplified from the environmental genomic DNA using the 519R primer (AGUIAR 2005) and the Bacteria specific 338F-GC primer (MUYZER 1993). PCR amplification conditions can be obtained from the detailed procedure in Apendix 1 (Protocol 2). DGGE procedures for Bacteria community. 23.
(28) Materials and Procedures. fingerprinting can be checked in Appendix 1 (Protocol 3). The gel photo was taken using a digital camera (Kodak Digital Science; Electrophoresis Documentation and Analysis System 120) with the syber green filter. The DGGE analyses was performed at the “Serviço Especializado de Epidemiologia e Biologia Molecular, Hospital de Sto Espirito de Angra do Heroísmo (SEEBMO)”.. 3.3. Data Analyses. The data set was organized in different ways. In order to study the temporal variability of the microplanktonic community composition for each sampling site, values from temperature, depth, geostrophic currents, chlorophyll a concentration in situ, nutrients concentration and molecular biology data were related and plotted into different graphs per station of the year. Data of two cruises were used to conduct community diversity evaluation. The DGGE data was rearranged in order to compare community patterns in the south of Pico Island corresponding to CIMBA cruise (Fall, 2007) with the seamount area, DEECON-2 (Summer, 2008) cruise. Data from DEECON-2 was analyzed thoroughly. Therefore, each seamount was analyzed first, separately, then with each other, and finally, with the data obtained from CIMBA.. 3.3.1. Physical and Environmental Parameters. Values from temperature were sorted and plotted in a pair wise manner using scatter plot graphs with the rest of the environmental factors, like nutrients and chlorophyll a, and with molecular parameters like total genomic DNA concentration (gDNA) and cell abundance. This data treatment was made for the whole data set, per season, and per cruise and was correlated with bathymetry and mean geostrophic currents (obtained from altimetry and CTD data) to evaluate the spatial and temporal tendency of the whole community structure. Not only this kind of analysis was applied to the whole r DEECON-2 cruise dataset, but was also applied to each single seamount separately so that one could have a specific view between seamounts communities. The in situ chlorophyll a concentration was compared with the same month MODIS/AQUA satellite derived monthly mean chlorophyll a concentrations computed for the same area using the same program (ArcGis 9.2) but with MODIS Ocean Color data referent to. 24.
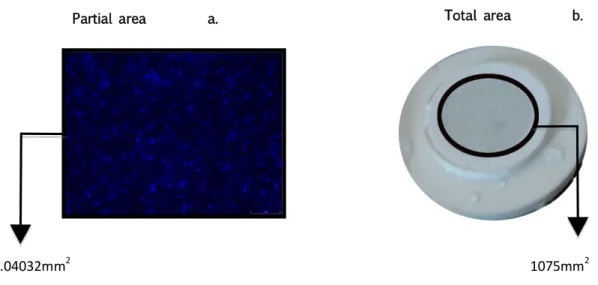
(29) Materials and Procedures. the same months of each cruise. The same comparison and procedure was made for sea surface temperature.. 3.3.2. Microplanktonic Community Characterization. Microplanktonic cells abundance. The bacterial community cells density was estimated by direct cell counts of DAPI stained slides. For cell counts, five randomly chosen microphotographs were selected per sample for cell counts. The cell counts per area of the microphotograph (Fig. 5.a) were then converted to the total exposed area (Fig. 5.b) to determine the cell abundance per 500 ml of seawater. Partial area. a.. Total area. 0.04032mm2. b.. 1075mm2. Figure 5. a. Overview of a microphotograph with DAPI stained cells, taken under epifluorescence light. The picture represents the final processed area analyzed for the direct cell counts. In b. the black circle represents the membrane filter total area covered by the 500 mL seawater sample.. Total Genomic DNA data Analysis. Different maps of genomic DNA concentrations were made using MatLab program in order to analyze the gDNA variation among stations. These gDNA concentrations correspond to the average mean from the two replicas of DNA 1 and DNA 2 collected. These values were. 25.
(30) Materials and Procedures. independently plotted using excel to correlated with the several environmental variables analyzed.. Archaea and Bacteria spatial identification. The presence of representatives of the Archaea and Bacteria domains was determined using universal primers for each domain as described previously. Archaeal and bacterial PCR product band intensity was analyzed according to a 1 to 0 scale in which 1 represents the brighter domain amplified band and 0 no amplification products. This intensity most likely will correspond to higher amount of archaeal 16S rRNA genes within the genomic DNA, which consequently may represent a higher abundance of Archaea within the environmental sample. The band intensity data resulted from the average mean from the two replicas treated per sample. The Archaea and Bacteria intensity gradient was plotted with MatLab to study its spatial distribution pattern. This data was also correlated with cell abundances, total genomic DNA and with physical and environmental parameters described above.. DGGE Analyses. The DGGE gel image was manually examined having in account two internal markers of Escherichia coli 16S rDNA runed in each gel. Each DGGE band is considerate as a phylotype or an Operational Taxomomic Unit (OTU). The different OTUs in each lane were counted for each environmental sample. These OTUs were also compared according to their migration pattern with the OTUs contained in all the remaining lanes. This data set provides information about OTUs presence/absence and allows a comparison of the bacterial community composition. Once this information is compiled it is possible to compare the several bacterial communities among environmental samples using a similarity index like the Jaccard’s index. The Jaccard’s index is determined taking into account the ratio of species or unique phylotypes, in this case OTUs, shared by two sites and the total number of species or OTUs in the two sites (BOHANNAN et al. 2003).. 26.
(31) Materials and Procedures. The index was calculated through the following formula:. Cj = j(a+b-j) Where: CJ – Jaccard similarity index between community A and B j – number of OUT’s found in both communities a – number of OUT’s in community A b – number of OUT’s in community B.. Jaccard’s index for Microplanktonic Community Comparisons. Similarity matrices were constructed using the Jaccard’s index for a pairwise comparison of the microplanktonic community. The similarity matrices were converted to distance matrices in order to generate dendograms using PHYLogeny Inference Package (PHYLIP) (FELSENSTEIN, 1989, 2005; TUIMATA, 2005). The distance matrices were exported into simple text files and imported into PHYLIP. Dendograms were computed using the Kitsch Method (KITSCH) (KIDD & SGARAMELLA-ZONTA, 1971; RZHETSKY & NEI, 1993). The dataset was rearranged and analyzed in different ways in order to compare the various studied areas. For DEECON-2, the Jaccard’s index was calculated for the DGGE profiles from sampling sites within the same seamount, to compare the biological diversity in each seamount. Then, it was calculated for the whole community to have a general overview. The dendograms were also generated for each seamount. For CIMBA cruise, the Jaccard’s index was calculated among all sampling sites. This data was compared with the data from DEECON-2 to address eventual biogeographical patterns between nearshore and open ocean bacterial communities.. 27.
(32) Results. IV. RESULTS A broad variety of ocean surface environments were sampled during five different cruises within the Azores plateau area from November 2007 to July 2008. Physical (geographic position, mean geostrophic currents, sea surface temperature), chemical (nitrate and phosphates) and biological (chlorophyll a, microbial plankton community composition) data was collected at the selected sites in order to perform a multidisciplinary study of these environments. The different cruises plans, with general oceanography as well as, with the biological stations geographical position are presented in Appendix 1 (cf. Figs. 1 to 5). A compiled master table, in Appendix 2 (cf. Tab. 1) is provided for additional cruise information.. 4.1. Physical Data. 4.1.1. Geostrophic currents The mean geostrophic currents derived from AVISO altimetry for July 2008 are represented the study area in Fig. 6 . In the chart it is possible to observe a main current flow that crosses over the seamounts area (36,5°-39,0° N; 31,5°-29,5° W) in direction northeast-southwest as a result of a large anticyclonic vortex.. 10 cm/s. Figure 6. Main geostrophic currents within the study area for summer of 2008, based on altimetry data. Pink dots represent the stations at which biological sampling occurred during DEECON-2 and OPALINA cruises.. 28.
(33) Results. At this scale, and with this dataset, the south of Pico Island region seems to be affected by two main flows during July 2008; one main flow at the easter side of the study area that crosses the region from SSE direction in to NNW mainly, resulting from a cyclonic vortex and a second smaller scale geostrophic current that seems to flow from south to north in an anticyclonic way. Local detailed geostrophic currents where computed for the south of Pico Island region from in situ data collected from the CIMBA cruise Fall 2007 (Fig. 7) (Bashmashnikov, unpublished data). These computations were made for 50 and 800 m depths. The currents direction is represented by the vectors and it is possible to observe two different cell flow patterns, one that it is moving east (37,9°-38,2° N) and the other one moving south (27,7° - 28,0° W).. Figure 7. Computed geostrophic currents at 50 meters depth for the region south of Pico Island during fall 2007 (Bashmashnikov, unpublished data). Open circles represent biological sampling stations done during CIMBA.. 4.1.2. Sea surface temperature (SST) MODIS (aboard Aqua satellite) 1.1 km resolution Sea surface Temperature (SST) product derived from NLSST algorithm are regularly obtained from the Ocean Colour Level. 29.
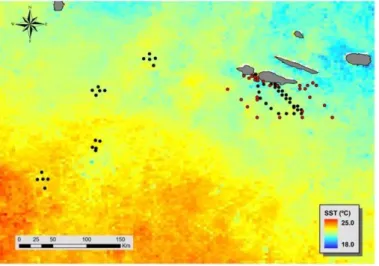
(34) Results. 1/2 browser for the Azores region. These images are mapped at the Department of Oceanography and Fisheries (DOP/UAz) (Level2-map) with SeaDAS. An SST image for the main sampling period, summer of 2008, and area of study is presented in (Fig. 8). It is possible to observe higher surface temperatures above the seamount areas (located southwest of main islands) and lower towards NE. South of Pico Island, SST values decrease significantly.. Figure 8. MODIS/Aqua-derived Sea surface temperature (SST) for July 2008 (summer, region of study). Black dots represent biological sampling stations made during summer 2008 while red dots represent the biological stations made during fall 2007 and spring 2008 .. The lowest in situ surface temperature (See Tab. 1, Appendix 2) was registered south of Pico Island, during fall 2007 (19-20,8 C). During summer 2008, in situ surface temperatures presented a broader range of variation with oscillations that ranged 20,6 C and 23,3 C for the seamounts region and between 21,4 C and 23,9 C south of Pico area.. 4.1.3. Chlorophyll a concentration MODIS (aboard AQUA satellite) 1.1 km resolution Level 2 chlorophyll a products, derived from the OC3M algorithm are regularly obtained from the Ocean Colour Level 1/2 browser for the Azores region. These images are mapped at the Department of Oceanography and Fisheries (DOP/UAz) (Level2-map) with SeaDAS. A chlorophyll a image for the main sampling period, summer of 2008, and area of study is presented in Fig. 9. Inversely with SST, the chlorophyll a concentration is higher in the northeast area and decreases towards southwest, with higher values in the northern seamounts and south of Pico Island.. 30.
(35) Results. Chlorophyll a in situ concentrations (Table 1, Appendix 2) are higher for fall 2007. The concentrations are very low during summer 2008, varying between 0-0,48 mg/m3.. Figure 9. MODIS/Aqua-derived Chlorophyll a concentration for July 2008 (summer, region of study). Black dots represent biological. sampling. stations. made during summer 2008, while red dots represent the biological stations made during fall 2007 and spring 2008.. 4.2. Chemical Data At the current time, due to technical difficulties, only orthophosphate, total dissolved phosphorus and nitrate data is available for all the biological stations used in this data set. As an overall tendency, the phosphates are always at low concentrations (varying from 0,04 umol P/L to 0,75 umol P/L ) reaching the lowest values at the south of Pico Island region. The only exception to this trend is the highest total phosphate registered at a single station within the seamount region (station 862 from Voador Seamount with 3,01 umol P/L) that is 10 times higher than the average values obtained during the same time period for the region. The nitrite values were always low, ranging from 0,01 umol N/L to 0,56 umol N/L. The available nutrient data was integrated with some of the biological data for some areas of interest and will be presented further in this chapter.. 4.3. Biological Microplanktonic Data Several microbial ecology approaches were taken in order to achieve a multilayer perspective of the microbial community structure harbored within this region studied.. 31.
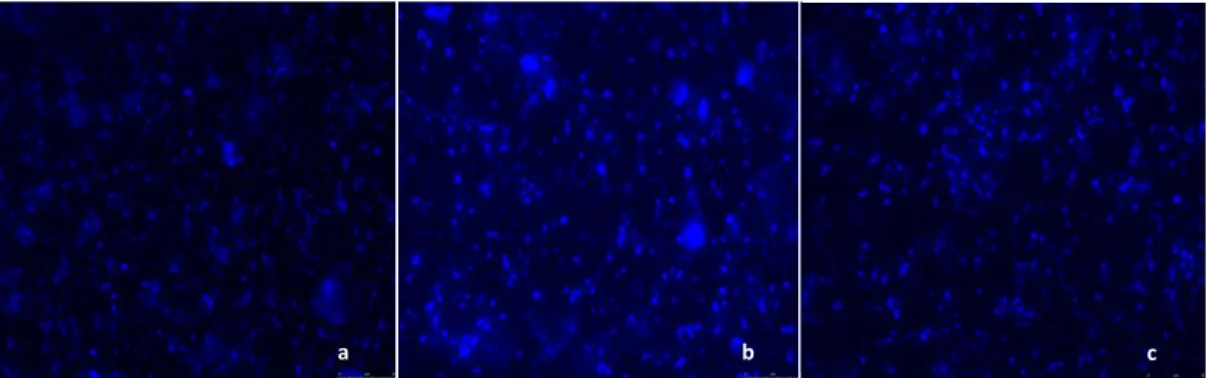
(36) Results. 4.3.1. Microbial plankton cells density Cell number was calculated for the whole microplanktonic cells, as well as for naturally fluorescence pigmented cells like cyanobacteria and prochlorococcus-like microorganisms. These were analyzed for three of the five cruises (DEECON-2, LAMAR and OPALINA), all of which taken place during July 2008. In addition, a list of presence for microeukaryote in each station was also made. This allows for the relative comparison of this groups richness variation for the area. Despite the temporal constraint (all samples were collected during July 2008) it was possible to evaluate the total microbial cell number and the micro-eukaryotic richness variability associated with the different study areas. Non-pigmented microplanktonic cells abundances were always higher than pigmented microplanktonic cells. No correlation was found between the two cell types. Some micrographs were chosen as representatives of the whole microplanktonic community. These are shown in Fig. 10 and were stained with DAPI and the image was captured at the highest magnification (100x objective). The lowest values of total microplanktonic cells were registered for samples obtained from of south of Pico Island (Fig. 11), which were collected during OPALINA. Constantly high relative values of cyanobacteria cells were found for all sites during OPALINA however, the prochlorococcus-like cell densities were the lowest registered. The highest total microplanktonic cell densities were registered during the LAMAR cruise, which mainly conducted through a predicted biotic front area (Bashmashnikov, unpublished data). The first LAMAR stations were sampled near the south of Pico Island area and showed lower cells densities just like the ones obtained for the OPALINA cruise. Microbial planktonic total cells densities was highly variable in the seamount area (Fig. 11).. 32.
(37) Results. a. b. c. Figure 10. Microphotographs taken with epifluorescence microscope after DAPI stainning. The blue dots are the microplanktonic cells. The blue color is due to the stainning reagent, DAPI that binds to dsDNA. a is a general aspect of the DEECON-2 environmental sample, b is a general aspect of the LAMAR environmental sample, and c is a general aspect of the to OPALINA . environmental sample. In terms of micro-eukaryote richness estimated for this work only higher taxa diversity was considered for this analysis. These constraints may mask the true species diversity for certain taxa. Samples from LAMAR and OPALINA cruise (Fig.12) showed the highest richness values. However, the differences were not very sharp. It is possible to detect major differences between the seamounts area, that display in general, lowest values of richness comparing to the LAMAR biotic front area. In situ chlorophyll a data was plotted with the micro-eukaryote richness (Fig. 12) but these seems to be no direct correlation between these variables. As it can be verified, the chlorophyll a concentration does not present values correlated with the total microbial cell numbers, since these behaves independently. Micro-eukaryotes as dinoflagellates, diatoms and other golden algae, as well as some Zooplankton and Synedococcus and Prochlorococcus like microbial cells were identified in the samples collected during July 2008 within the studied region.. 33.
(38) Prochlorococcus-like cells are represented in yellow and green, respectively. Each value presented is in cells per milliliter of seawater.. 34. position of the other four stations in relation to the central site. Total microbial planktonic cells are represented in blue. Cyanobacteria cells and. Figure 11. Microbial planktonic cells density, per station, for DEECON-2, LAMAR and OPALINA cruises (summer of 2008). DEECON-2 data is arranged per seamount and geographical position of the samples in relation with each other is indicated by the letters C, as in central station, S, N, E , and W stand for the. Results.
(39) detection limit (<0.01).. 35. concentration is the green squares. Sites for which there is no Chlorophyll a correspond to stations where the chlorophyll a value was bellow the method. arranged per seamount and geographical position of the samples in relation with each other. Richness number is represented in orange and chlorophyll a. Figure 12. Richness number and chlorophyll a concentration, per station, for DEECON-2, LAMAR and OPALINA cruises during summer of 2008. DEECON data is. Results.
(40) Results. 4.3.2. Archaea and Bacterial spatial distribution based on PCR detection The microbial planktonic community spatial/temporal variations were studied by the presence/absence of Archaea and Bacteria domain representatives tested using PCR domain specific primers. The band intensity for the PCR-amplification were plotted accordingly with the environmental sample origin (Fig.13).. a a. b. Figure 13. Archaea spatial distribuition within the study area. Circles represent the environmental sample geographical position. The color gradient represents the intensity of the Archaea 16S rDNA bands obtained from the PCR amplification and varies from 0 to 1.Zero represents no Archaea amplification and 1 the highest band intensity for Archaea amplification. a. Results for the full study area. b. Zoom of south of Pico Island.. 36.
(41) Results. From a total of 81 samples tested for Archaea, only 16 samples did not test positive. An intensity gradient score, in a scale of 0 to 1, was given to the PCR amplified products in which 0 represents no Archaea amplification and 1 is the highest band intensity obtained from the data set. The highest PCR amplified band intensity was encountered at the environmental samples collected in the seamounts area (between 37,0°-39,0° N and29,8°31,7° W). Within the South of Pico area some stations positioned closer to the shoreline displayed higher PCR-product band intensity. The remaining samples, in the south of Pico area, present lower values that vary between 0,1 to 0,5 band intensity. The same dataset (81 samples) was tested for Bacteria presence. From these only three samples had no Bacteria gDNA successfully amplified. The same band intensity scoring system was applied to the Bacteria PCR products (Fig. 14). In this case, and contrary to what happened with the Archaea results, the Bacteria band intensities did not widely vary within the study area.. a. b. Figure 14. Bacteria spatial distribuition within the study area. Circles represent the environmental sample geographical position. The color gradient represents the intensity of the Bacteria 16S rDNA bands obtained from the PCR amplification and varies from 0 to 1 in which 0 represents no Bacteria amplification and 1 the highest band intensity for Bacteria amplification.a. Full study area overview. b. Detailed of south of Pico Island data.. b. 37.
(42) Results The highest band intensity was found in the two seamounts located further north (between 38,1°-39,0° N and 29,8°-30,8° W). Some stations within the south of Pico Island area and at near shore sites showed a similar behavior. The medium band intensity values were detected on the seamount samples located further south and on five samples at south of Pico area. The remaining samples presented the lowest value of band intensity.. 4.3.3. Bacterial microplanktonic community fingerprint assessed using DGGE Overall, a total of 35 microbial plankton community samples from surface seawater were screened for Bacteria community structure comparisons using DGGE.. The DGGE. separation of the rDNAs segments result in specific band profiles for each sampling site (Appendix 2, Fig. 6). These band patterns were manually analyzed and compared and each profile was characteristic of the bacterial community at a given time in a particular geographical region. For detailed information on the specific Bacteria community structure at each station please refer to Tables 3 through 4 in Appendix 2. Not all environmental samples yield positive amplification products for the DGGE analyzes therefore the samples data set analyzed with DGGE was smaller than the one for which Archaea and Bacteria presence was detected. A total of 21 DGGE profiles were obtained for the DEECON-2 cruise (seamounts study area) for summer of 2008 and other 14 DGGE profiles were analyzed for CIMBA cruise that took place during fall of 2007. The DEECON-2 environmental samples had the highest DGGE Bacteria richness value (12). This maximum richness was found at the Agulha do Sul (Gigante) Seamount, for stations 877 and 878 (east and center of the seamount respectively). The lowest DGGE Bacteria richness values (2, 5 and 6) as the environmental samples 876, 860 and 881, respectively. The last two samples were collected at the same geographical station that is actually the reference station for this dataset, situated in the Faial-Pico channel. There is a nine days time interval between the two environmental samples collection date. The richness values for the remaining environmental samples varied between 7 and 11. Only one environmental sample from the set of CIMBA cruise displayed a richness of 12 (station 628, southeast Pico Island). The lowest DGGE Bacteria richness (2) was also found in an environmental sample collected during the CIMBA cruise at the near shore station 666.. 38.
(43) Results. 4.3.4. Microbial Community Similarites Using Jaccard’s Index Similarity matrices were created from the pair wise comparison of the environmental samples using Jaccard’s index (Tab. 2 Appendix 2) for all microbial communities for which there was DGGE data. The similarity matrices were than converted into distance matrices that were inputted in to PHYLIP. A similarity dendogram was generated for DEECON-2 and CIMBA data set, using the Kitsch Program (KITSCH).. Bacteria community comparisons for South of Pico Island area: CIMBA I02 Cruise The dendogram obtained for CIMBA, fall 2007 (Fig. 15) shows a very consistent cluster of all samples for this time period. This can be confirmed by the relative position of the outgroup environmental sample used in the analysis (“open ocean”). This outgroup is apart of a set of the main cluster. It is possible to observe that most of the nearshore samples close to the Pico-Faial channel tend to form a minor cluster that may be representative of some small scale microhabitat. Station 651 has a unique bacterial community because it always clusters separately from all the other samples (cf. Fig.15). Two other clusters can be identified from the dendogram branching pattern (cf. Fig.15).. Figure 15. Bacteria dendogram. for. community similarity. environmental. samples. collected South of Pico Island during fall of 2007. The dendogram is based on Jaccard’s index comparisons and was obtained using PHYLIP assuming for the analysis the Kitsh program. The Opean ocean station was used as an outgroup (31,9° N 27,9° W) and it was collected during May of 2007. The numbering refers to stations at which environmental samples occurred.. 39.
(44) Results. Bacteria community comparison for the open ocean seamount area: DEECON V08 Cruise Four seamounts were sampled during this cruise. The geographical position of each seamount is displayed in Fig. 16.A. Since there were five stations at each seamount a Bacteria community similarity dendogram was generated, based on the Jaccard’s index values (Fig. 16.B.). These dendograms were built to compare the community similarity within each seamount. Samples from other locations were chosen to test the seamount samples branching pattern. With the exception of the southern station, at Agulha do Sul (Gigante) all seamount samples cluster together displaying a high similarity when compared to the reference station environmental samples that are pushed into a separate clade (cf. Fig. 16.B.). Figure 16.A. Correlation between the microbial community structure and the environmental variables measured at the time of sampling. A. Seamounts relative position within the area of study overlaid on bathymetry. The colored squares correspond to the environmental plots presented in 16. B. The seamounts names are as follows: 1- Voador; 2- Monte Alto; 3-Cavala; 4-Agulha do Sul (Gigante).. In an attempt to test if some of the seamount internal clade branching pattern is due to any of the environmental variables measured at the time of sampling, a spatial projection of the sites relative position containing independent variables such as temperature, total gDNA, microbial cells abundance, and total phosphates was projected in. 40.
(45) Results. a 2D diagram and paired with the corresponding seamount microbial community dendogram (Fig. 16.B.). From the current data set no direct correlation was found between the samples clustering pattern and the measured environmental variables. The nitrite (NO22-) and phosphate (PO4) data did not display much variation between the seamounts, but the southern station of Cavala seamount registered a high level of phosphate and nitrite.. Sea surface microbial community spatial distribution: Data Merge With the intention of establishing a more robust habitat characterization off the area contemplated in this study (open ocean seamount area and south of Pico Island area) several biotic and abiotic environmental variables were analyzed using Principal Component Analysis (PCA). This data were projected into a 2D scatter plot (Fig. 17.) where independent variables such as geographical position (i.e. longitude) (0.89), archaeal pcr band intensity (-0.88), and dissolved nitrite concentration (-0.66) are better expressed along the horizontal axis. Environmental variables such as chlorophyll a (0.66) and dissolved phosphate concentration (0.68) are better represented along the vertical axis. All other environmental variables like temperature (0.76), samples geographical position (latitude) (0.74), and microbial cell abundances (-0.75) displayed good correlations but were better represented at other axis and could not be represented within the 2D scatter plot. The remaining variables included in the analysis did not show strong correlations and therefore, did not seem to contribute to the spatial resolution of the data points (environmental samples). After the multivariable analysis it becomes clear that geographical position is an important variables for this data set. This seems to occur if more than one habitat or environment is encountered within the range of the study area. The longitudinal position of the environmental samples seems to account for 90% of the environmental data distribution found along the horizontal axis (Fig. 17). However, the strongest correlations found among environmental variables are encountered between the phosphate and the nitrite concentrations (positively correlated; r=0,95) and between the samples longitudinal position and the archaeal pcr-band intensity (negative correlation; r=0,80). Bacterial pcrband intensity, chlorophyll a concentration, gDNA, and microbial cell abundances did not show any significant correlation with any of the other variables measured and used in this data analysis. 41.
Imagem

+7


Documentos relacionados