CC-BY-NC 2014, i-Proclaim | GDEB Page 143
Statistical Analysis of the Leadership Perceptions
in a Public Administration Office
Áurea Sandra Toledo de Sousa
1*, Maria da Graça Batista
2, Ana Carolina Arruda
31
Assistant Professor, Department of Mathematics, CEEpIA, University of Azores, Ponta Delgada, PORTUGAL
2
Assistant Professor, Department of Economics and Management, CEEpIA, University of Azores, Ponta Delgada, PORTUGAL
3
Graduate Student, Department of Economics and Management, University of Azores, Ponta Delgada, PORTUGAL *Corresponding Contact: Email: [email protected] Cell Phone: +351967864946 Handle: http://hdl.handle.net/20.500.11903/gdeb.v4n2.7
ABSTRACT
The main purpose of this paper is to identify and characterize the leadership features in a public administration office of the Azores (Autonomous Region of the Azores), in orders to verify the existence or not of a positive leadership based on the employees’ perceptions. The main conclusions are attained using data gathered via a previously tested and validated questionnaire. Overall, we conclude that subordinates don’t consider that their leaders show behaviors that they can associate with a totally positive and effective leadership although they are pleased with the fact that they are not extremely controllers and that they seek to do what the majority of the subordinates wants.
Key Words: Leadership, Positive Organizations, Public Administration Office, Zoom Star Representation, Paired-Sample Wilcoxon Signed Rank Test, Ascendant Hierarchical Cluster Analysis
I
NTRODUCTIONLeadership is dependent on factors such as the interaction with others; the leader credibility; accomplishments; belief that everyone can develop their talent and that they can help others in this task; and the search for innovative ways to improve organizations based on personal experiences. The leadership can be apprehended and considered as a positive force (Kouzes and Posner, 2002), because of the associated benefits, including its role in the organization strategy, which is extremely determinant, especially in times of difficulties or crisis.
A positive leadership assumes a flexible organizational culture, based on constant learning and respect for all of its members, encouraging their participation in the definition and implementation of the organizational mission, values, and strategy (Cockerell, 2008). Some leaders’ attitudes (positive attitudes) can potentiate the team work, increase the productivity and satisfaction, particularly when they inspire a new joint vision, search for new opportunities, test new solutions, take chances, stimulate cooperation and convey strength
Page 144 Volume 4, No 2/2015 | GDEB and motivation (Cockerell, 2008; Kouzes and Posner, 2002). Some thoughts and negative emotions that result from interpretations of reality can destroy the impact of a positive leadership. Thus, the assessment of subordinates’ perceptions regarding leaders’ characteristics is important, so that policies can be adopted to allow the development of a positive leadership style in a team context, of a public administration office.
The paper has the following organization: The second section briefly summarizes the main features of a positive leadership. The third section is related to the methodology and study variables used in the present work. We present, in the fourth section, the main results obtained by the application of the Wilcoxon signed rank test and of the Ascendant Hierarchical Cluster Analysis (AHCA) to a data set obtained from a questionnaire about the characteristics of an exemplary leader and the characteristics of their leader in a public organism of the Autonomous Region of the Azores. Finally, the fifth section contains some concluding remarks and directions for further research.
P
OSITIVEL
EADERSHIPLife experiences play an important role in the development of leadership. In fact, some personal experiences shared by leaders emphasize the role of family and childhood experiences that have had a sustained impact on their lives (Sahgal and Pathak, 2007). Thus, leaders do not emerge as a consequence of events or incidents but of a journey of life experiences and processes. The leadership dimension covers four areas (Bolden et al., 2003): “a) Leaders develop the mission, vision and values and are role models of a culture of Excellence; b) Leaders are personally involved in ensuring the organization’s management system is developed, implemented and continuously improved; c) Leaders are involved with customers, partners and representatives of society; and d) Leaders motivate, support and recognize the organization’s personnel.”
Among many factors that promote an entrepreneurial environment in an organization, are the personal characteristics of the leader. Regarding the leadership style, an entrepreneurial leader must have the ability to dream big (e.g., Bennis, 1989; Spears, 2010) and to overcome obstacles, focusing on positive results (Sahgal and Pathak, 2007) and open discussion. The leader must be able to identify, promote and explore new opportunities, be creative, persistent and create management options, being receptive to changes in the organizational structure, understanding that entrepreneurship involves making decisions under conditions of uncertainty. In this process, some conflicts can arise, so the leader must also be a diplomat (importance of the emotional intelligence) and recognize that the disagreements and criticism in an open discussion are a part of the learning process in order to find the best solution. An ideal leader must seek to understand the surrounding environment (internal and external) to identify new opportunities and threats that are related to the entrance of new competition in the market. In this context, the leader must distinguish between real and false opportunities and threats in the new operating environment of the Creative Economy (Denning, 2014), and assess the perceptions of the employees concerning their leadership style. Another determinant quality of a good leader is the reliance on persuasion, rather than on one’s positional authority, in making decisions within an organization (Spears, 2010). The sharing of experiences between managers and employees at various levels of management has an important role in the motivation of the employees. Issues related to the development of new ideas and projects shall be communicated to all regularly so as to involve the entire organization in finding solutions and implementing them. Moreover, an ideal leader must be receptive to customer suggestions. As is referred in Bolden et al. (2003), “relationship-oriented leaders are at their best when greater customer satisfaction is gained, and a positive company image is established”.
CC-BY-NC 2014, i-Proclaim | GDEB Page 145 Studies on leadership have emphasized the idea of a positive leadership (Cameron, 2008), which requires that leaders know and can mobilize the human or intellectual capital, the positive psychological capital and the social capital. Some leaders’ actions, according to a positive leadership, have a positive impact on organizations and their human resources, since their perceived experiences improve wellness and higher achievability. Positive emotions expand attention and thinking; stimulate creativity, actions and social bonding, according to their impact on employees’ well-being (Lopes and Nascimento, 2014).
An effective leader must have four types of skills: technical, social, cognitive, and personal. On the one hand, technically competent leaders, who lack social or relational abilities, frequently struggle with difficulties regarding team management; struggle with relationships with subordinates, peers, superiors and external entities. On the other hand, leaders, who don’t have the adequate conceptual and strategically abilities, will hardly succeed in top management positions.
M
ETHODOLOGY ANDS
TUDYV
ARIABLESData regarding 153 employees of a public office in the Azores were collected through a tested and validated questionnaire (non-probabilistic sample). The questionnaire was composed of six general sample characterization variables (gender, age group, marital status, literary qualifications, professional category and link to the organization). It also comprised a scale, composed of seventeen items, that was used to assess the leader’s characteristics (their leader) and the effective leader’s characteristics (see Table I). Each participant selected one and just one of six modalities of response (1 = Totally Disagree (TD), 2 = Disagree (D), 3 = Neither Disagree Nor Agree (NDNA), 4 = Hardly Agree (HA), 5 = Agree (A) and 6 = Totally Agree (TA)), regarding each item.
Table I: Scale Items and their labels
Labels
Items Leader
(L)
Exemplary Leader (LE)
1: Motivating employees 1-L 1-EL
2: Having self-confidence 2-L 2-EL
3: Delegating tasks and responsibilities 3-L 3-EL
4: Being a controller 4-L 4-EL
5: Worrying about employees’ needs 5-L 5-EL
6: Establishing the organization structure 6-L 6-EL
7: Defining routines 7-L 7-EL
8: Promoting team work 8-L 8-EL
9: Consulting employees on decision-making 9-L 9-EL
10: Setting goals 10-L 10-EL
11: Being focused on goals 11-L 11-EL
12: Solving conflicts 12-L 12-EL
13: Emphasizing the interpersonal relationship 13-L 13-EL
14: Promoting training activities 14-L 14-EL
15: Trying to do what the majority of collaborators want 15-L 15-EL 16: Creating a good internal and external image of the public office 16-L 16-EL
Page 146 Volume 4, No 2/2015 | GDEB The sample (non-probabilistic) consists of 153 employees (67 (43.8%) male and 86 (56.2%) female) of a public office in the Azores. It was considered five age groups (18-25, 26-35, 36-45, 46-55, more than 55 years old), to which belong, respectively, 3.9%, 16.3%, 28.8%, 39.2%, and 11.8% of respondents. It was found that 63.4% of the respondents are married, 19% are single and 17.6% have other civil status. The percentages of respondents with qualifications “up to 4th grade”, “up to 9th grade”, “up to 12th grade”, “professional education”, “bachelor degree”, “university degree”, “postgraduate studies” and “master’s degree” are, respectively, 13.1%, 20.9%, 24.8%, 9.2%, 5.9%, 20.9%, 1.3% and 3.9%. It should be also noted that 22.4% of the respondents are “operational assistants”, 48% are “technical assistants”, 25.6% are “senior technicians”, 2% (3 employees in 153) are “computer experts”, and 2% (3 employees in 153) are “computer technicians”. In what regards the professional bond with the public office, most respondents (79.7%) have a tenured employment contract, 14.4% have an employment contract for an indefinite period of time, 3.3% (5 in 153) have an employment contract for a definite/indefinite period of time and 2.6% (4 in 153) have some other employment contract.
We conducted a Kolmogorov-Smirnov test to check the assumption of normality for both total scores (total score of the leader and total score of the exemplary leader), and the obtained p-values indicated that this assumption was not satisfied (p<0.01) in both cases. In order to assess the perceptions of employees regarding leaders’ characteristics, several statistical methods were applied, from which we can point out the 2D Zoom Star representation, the Wilcoxon signed rank test, and some algorithms of Ascendant Hierarchical Cluster Analysis (AHCA) in the cluster analysis context.
The paired-sample Wilcoxon signed rank test (nonparametric alternative method to the paired sample t-test when the sample data are not normally distributed or when the data are in an ordinal scale) is used for within-subjects design with data that are at least ordinal in scaling (e.g., Siegel and Castellan, 1988). Here, we analyse two sets of ordinal data (“Characteristics of their leader” and “Characteristics of an exemplary leader”) obtained from the same individuals (employees of the public office). The analysis will be effectuated for all items (1-EL/1-L; ....; 17-EL/17-L) and for the total scores (total LE/total score-SL)), sum of the scores of the seventeen scale items; in the entire sample and in the groups defined by the categories of the socio demographic variables.
“The purpose of cluster analysis is to identify groups (clusters) of entities (data units/objects or variables), homogeneous and, preferably, well separated, based on similarities or dissimilarities between these entities” (Sousa et al., 2015). The basic affinity coefficient is a similarity measure between pairs of variables or of subjects in cluster analysis context (corresponding to pairs of columns or rows of a data matrix) proposed by Bacelar-Nicolau (1980, 1988) from the affinity coefficient between two discrete probability distributions proposed by Matusita (1951). Subsequently, Bacelar-Nicolau extended that coefficient to different types of data, including complex and heterogeneous data (e.g., Bacelar-Nicolau, 2000; Bacelar-Nicolau et al., 2009, 2014). The AHCA of the scale items was performed based on the affinity coefficient (Bacelar-Nicolau, 1980, 1988), and on three probabilistic aggregation criteria (AVL, AV1, and AVB), that belong to a family of parametric methods in the context of the VL methodology (e.g., Nicolau, 1983; Bacelar-Nicolau, 1988; Nicolau and Bacelar-Nicolau, 1987, 1998; Lerman, 1972, 1981). Its use allowed the identification of two typologies of variables which are related, respectively, to the leader’s characterization and to the effective leader’s characterization. The validation index named global statistics of levels STAT (e.g., Lerman 1970, 1981; Bacelar-Nicolau, 1980, 1985) was used to select the best partitions.
CC-BY-NC 2014, i-Proclaim | GDEB Page 147
S
TATISTICALA
NALYSISFigure 1 shows, for each item that assesses the characteristics of an effective leader, the percentage of employees, who are in total agreement with the feature associated with this item, considering the overall sample. Most respondents are in total agreement regarding the following characteristics of a good leader (effective leader): Being able to motivate employees (70.6%), contributing to a positive management (69.9%), creating a good internal and external image of the public office (69.3%), being self-confident (66%), delegating tasks and responsibilities (58.8%), promote teamwork (58.8%), worry about employees’ needs (58.2%), solving conflicts (53.6%), defining the structure of the public office (52.3%), emphasizing interpersonal relationship (51.6%) and setting goals (50.3%). The items that recorded the lower percentages of total agreement were the items 15-EL and 4-EL. In fact, only 22.2% of the respondents strongly agree with the idea that an effective leader must be able to try to do what the majority of the employees wish, and just 28.1% of the respondents strongly agree with the idea that an effective leader must be a controller.
Figure 1: Percentage of employees who totally agree with the feature associated with each item - Effective Leader
Their Leader
Effective Leader
Figure 2: 2D Zoom Star representation (in a 2D graphic)
70.6% 66.0% 58.8% 28.1% 58.2% 52.3% 43.8% 58.8% 48.4% 50.3% 41.2% 53.6% 51.6% 43.1% 22.2% 69.3% 69.9%
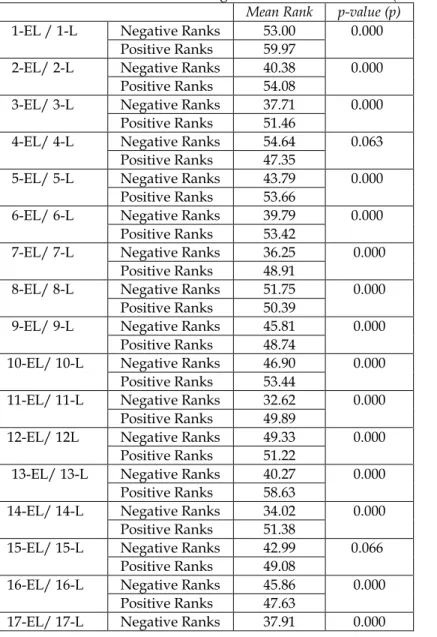
Page 148 Volume 4, No 2/2015 | GDEB In the 2D Zoom Star, axes are linked by a line that connects the most frequent values of each scale item, so allows us to identify the main perceptions of the individuals about their leader and about an effective leader. As it is shown in Figure 2, most collaborators don’t consider that their leaders behave as totally effective leaders, although they are pleased with the fact that the leaders are not the extreme controllers and try to do what most employees want. According to the Wilcoxon signed rank test, at a 0.01 level of significance, there were significant differences between the evaluation of the leader and the evaluation of the effective leader (p≤0.01), on all scale items, except for items “4-Being a Controller” (4-EL/4-L; p= 0.063) and “15- Trying to do what the majority of collaborators want” (15-EL/15-(4-EL/4-L; p= 0.066). Table II shows a summary of the results.
Table II: Results of the Wilcoxon signed rank test for all items (overall sample)
Mean Rank p-value (p)
1-EL / 1-L Negative Ranks 53.00 0.000 Positive Ranks 59.97
2-EL/ 2-L Negative Ranks 40.38 0.000 Positive Ranks 54.08
3-EL/ 3-L Negative Ranks 37.71 0.000 Positive Ranks 51.46
4-EL/ 4-L Negative Ranks 54.64 0.063 Positive Ranks 47.35
5-EL/ 5-L Negative Ranks 43.79 0.000 Positive Ranks 53.66
6-EL/ 6-L Negative Ranks 39.79 0.000 Positive Ranks 53.42
7-EL/ 7-L Negative Ranks 36.25 0.000 Positive Ranks 48.91
8-EL/ 8-L Negative Ranks 51.75 0.000 Positive Ranks 50.39
9-EL/ 9-L Negative Ranks 45.81 0.000 Positive Ranks 48.74
10-EL/ 10-L Negative Ranks 46.90 0.000 Positive Ranks 53.44
11-EL/ 11-L Negative Ranks 32.62 0.000 Positive Ranks 49.89
12-EL/ 12L Negative Ranks 49.33 0.000 Positive Ranks 51.22
13-EL/ 13-L Negative Ranks 40.27 0.000 Positive Ranks 58.63
14-EL/ 14-L Negative Ranks 34.02 0.000 Positive Ranks 51.38
15-EL/ 15-L Negative Ranks 42.99 0.066 Positive Ranks 49.08
16-EL/ 16-L Negative Ranks 45.86 0.000 Positive Ranks 47.63
CC-BY-NC 2014, i-Proclaim | GDEB Page 149 The Wilcoxon signed rank test was also used to test for differences between the leader evaluation and the effective leader evaluation, concerning the scale items, in the groups defined by the categories of the socio-demographic variables (see Appendix A). We concluded that, at a 0.05 level of significance, among women there were significant differences between the scores given to the effective leader and the scores given to their leader on all items (p≤0.05) except item 4 (4-EL/4-L; p= 0.092), while among males there were significant differences on all items (p≤0.05) except items 4 (4-EL/4-L; p=0.384) and 15 (15-EL/15-L; p =0.942). Regarding the age groups, the less critical employees were the younger ones (18-25 years old) since, in this age group, for the considered significance level, there were no significant differences between the two vectors of scores on all items of the scale (p > 0.05). As for civil status, the individuals in the group defined by the category "married" are the most critical ones. In fact, among married respondents, there were significant differences on all items (p≤0.05) except items 4 (4-EL/4-L; p=0.023) and 15 (15-EL/15-L; p=0.237). Regarding qualifications, the less critical ones are those who have a postgraduate degree, professional education, qualifications up to the 4th grade, master’s and bachelor degrees. The most critical ones were the graduated employees and those with qualifications up to the 12th grade, groups in which significant differences were observed (p ≤ 0.05) between the scores given to the effective leader and their leader on all items except items 4 and 15. Regarding the link of the employee to the public office, the most critical ones were those with tenure, with significant differences (p ≤ 0.05) between the two vectors of scores on all items except for item 15 (p=0.059). As for professional category, the most critical were the technical assistants and senior technicians (see Appendix A).
1-L --*---* |---* 5-L --*---* |---* | | 14-L --*---* | | 2-L --*---* | |---* | 3-L --*---* | | | | 6-L --*---* | |--* |---* |---* | | 7-L --*---* |---* | | | | | | | | | | 8-L --*---* | | | | | |--* | | | 10-L --*--* | | | | |---* | | | | 11-L --*--* | | | | | |---* |--* | 12-L --*---* | | |--* |--* | | | 16-L --* | | | | |---* | | | 17-L --* | | | | | | 9-L --*---* | | | |---* | | 13-L --*---* | | | | 4-L --*---* | | 15-L --*---*
Page 150 Volume 4, No 2/2015 | GDEB The Wilcoxon signed rank test was also performed to test the differences between the total scores (sum of the scores obtained on the scale items) of the leader’s evaluation and the total scores of the effective leader’s evaluation in the entire sample (overall sample) in the groups defined by the categories of the socio-demographic variables (see the last column of the table of the Appendix A). At a significance level of 0.05, the only groups in which were not observed significant differences between the overall evaluation of the leader and the overall evaluation of the effective leader are the groups of individuals of 18 to 25 year-olds (p=0.225), with post graduations (p=0.180), with employment contract for a definite/ indefinite period of time (defined extension period contract) (p=0.225), with employment contract in the category “other” (p=0.109), computer experts (p=0.109), and computer technicians (p=0.317).
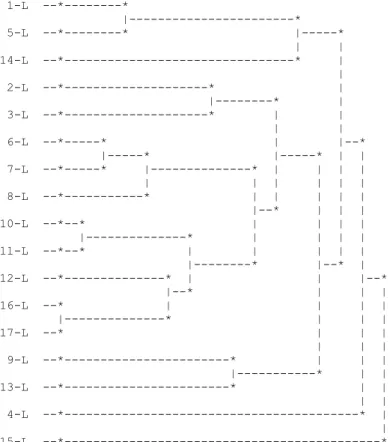
According to the STAT (6.9853), the most significant level (the best cut-off level) corresponds to a partition into six clusters given by the methods AV1 and AVB:
C1: {1-L, 5-L}; C2: {14-L};
C3: {2-L, 3-L, 6-L, 7-L, 8-L, 10-L, 11-L, 12-L, 16-L, 17-L}; C4: {9-L, 13-L}; C5:{4-L}; C6:{15-L}.
The first cluster contains the items 1-L and 5-L linked to motivation. The second cluster contains only the item 14-L (promoting training activities).
1-EL --*---* |---* 2-EL --*--* | | |---* | 3-EL --*--* | |---* 5-EL --*---* | | |---* | | 6-EL --*---* | | | | | | 7-EL --*---|---* | | | 8-EL --*---* | |--* |---* | | 10-EL --*---* | | | | 9-EL --*---* | | |---* | | 11-EL --*---* | | | | |---* | | | 13-EL --*---* |--* | | |--* 12-EL --*---* | | | |---* | | 14-EL --*---* | | | |---* | | 16-EL --* | | | |---* | | 17-EL --* | | | | 4-EL --*---* | | 15-EL --*---*
CC-BY-NC 2014, i-Proclaim | GDEB Page 151 The third cluster comprises the subclasses {2-L, 3-L}, {6-L, 7-L, 8-L}, and {10-L, 11-L, 12-L, 16-L, 17-L}, linked, respectively, to the organizational climate of trust on self (leader) and on the team; work method (establishing the organization structure and routines, promoting team work); and leadership/management actions (setting goals and being focused on goals, solving conflicts, creating a good internal and external image of the public office, and contributing to a positive management). Cluster 4 contains items related to the emotional intelligence/interpersonal relationship, namely, the items 9-L (“Consulting employees on decision-making”) and 13-L (“Emphasizing the interpersonal relationship”). Clusters C5 and C6, both constituted by a single item, are concerned, respectively, with the items 4-L (“Being a controller”) and 15-L (“Trying to do what the majority of collaborators want”). Regarding the effective leader, according to the STAT (8.4426), the most significant level (the best cut-off level) corresponds to a partition into three clusters given by the methods AV1 and AVB: C1:{1-EL, 2-EL, 3-EL, 5-EL, 6-EL, 7-EL, 8-EL, 10-EL, 9-EL, 11-EL, 13-EL, 12-EL, 14-EL, 16-14-EL, 17-EL}; C2:{4-EL}; C3:{15-EL}.
The first cluster is composed by items regarding leader characteristics and management/leadership options. The items 4-EL (“Being a controller”) and 15-EL (“Trying to do what the majority of collaborators want” are included, respectively; in the clusters C2 and C3. It should be noted, the high proximity between the items 16 and 17 (see Figures 3 and 4). In fact, a good image (internal and external) of the public office is generally associated with a positive management.
C
ONCLUSIONS ANDF
UTURER
ESEARCHIn general, we can conclude that for most staff members, except for employees of 18 to 25 years old, for post graduated employees, for staff with an employment contract of definite/indefinite period, for computer specialists and computer technicians, their leaders don’t present totally positive and effective leadership behaviours, although they are pleased with the fact that the leaders are not extreme controllers and try to do what the majority of the employees want. The AHCA, in the cluster analysis context, allowed the identification of two typologies of variables concerning, respectively, the leader’s characterization (partition into six clusters) and the effective leader’s characterization (partition into three clusters).
Regarding possible future developments of this research and, concerning only the leader evaluation, we are considering doing the analysis using other non-parametric statistical tests (Mann-Whitney, Kruskal-Wallis and Dunn’s multiple comparisons), using the Categorical Principal Components Analysis (CatPCA) and using Ordinal Regression. We can also consider the recodification of some variables into a smaller number of categories.
The sample size used is a limitation to the results’ generalization. The development of this research regarding the possible differences in perceptions when the leader is a woman could be useful to expand the knowledge concerning the gender differences in the leadership.
R
EFERENCESBacelar-Nicolau, H. (1980), Contributions to the study of comparison coefficients in cluster analysis, Ph.D. Thesis (in Portuguese), Universidade de Lisboa, Portugal.
Bacelar-Nicolau, H. (1985), "The affinity coefficient in cluster analysis", M.J. Beckmann, K.-W. Gaede, K. Ritter, & H. Schneeweiss (Eds.), Methods of Operations Research, vol. 53, Verlag Anton Hain, Munchen, pp. 507-512.
Page 152 Volume 4, No 2/2015 | GDEB
Bacelar-Nicolau, H. (1987), “On the distribution equivalence in cluster analysis”. In Devijver, P.A. & Kittler, J. (Eds.) Pattern Recognition Theory and Applications, NATO ASI Series, Series F: Computer and Systems Sciences, vol. 30, Springer - Verlag, New York, pp. 73-79.
Bacelar-Nicolau, H. (1988), “Two probabilistic models for classification of variables in frequency tables”. In: Bock, H.-H. (Eds.), Classification and related methods of data analysis, Elsevier Sciences Publishers B.V., North-Holland, pp. 181-186.
Bacelar-Nicolau, H. (2000), “The affinity coefficient”. In: H.-H. Bock & E. Diday (Eds.), Analysis of symbolic
data: Exploratory methods forextracting statistical information from complex data, Series: Studies in
Classification, Data Analysis, and Knowledge Organization, Springer-Verlag, Berlin, pp. 160-165. Bacelar-Nicolau, H., Nicolau, F.C., Sousa, Á., & Bacelar-Nicolau, L. (2009), “Measuring similarity of
complex and heterogeneous data in clustering of large data sets”, Biocybernetics and Biomedical
Engineering, vol. 29, no. 2, pp. 9-18.
Bacelar-Nicolau, H., Nicolau, F.C., Sousa, Á., & Bacelar-Nicolau, L. (2014), “On cluster analysis of complex and heterogeneous data”, Proceedings of the 3rd Stochastic Modeling Techniques and Data
Analysis International Conference (SMTDA2014), C. H. Skiadas (Eds.), 2014 ISAST, pp. 99-108.
Bennis, W. G. (1989), Managing the dream: Leadership in the 21st Century, Journal of Organizational
Change Management, vol. 2 no. 1, pp. 6-10.
Bolden, R., Gosling, J., Marturano, A., & Dennison, P. (2003), A review of leadership theory and competency
frameworks. Edited Version of a Report for Chase Consulting and the Management Standards
Centre. Centre for Leadership Studies, University of Exeter, United Kingdom.
Cameron, K. (2008), Positive leadership: Strategies for extraordinary performance, Berrett-Koehler, São Francisco.
Cockerell, L. (2008), Creating magic: 10 common sense leadership strategies from a life at Disney, Doubleday Publishing Group, Nova Iorque.
Denning, S. (2014), Identifying the new opportunities and threats in the Creative Economy, Strategy &
Leadership, vol. 42, no. 6, pp. 3-9.
Kouzes, J. M., & Posner, B. Z. (2002), The Leadership Challenge, Jossey-Bass, Wiley, São Francisco, CA. Lerman, I.C. (1970), “Sur l`analyse des données préalable à une classification automatique (Proposition d’une
nouvelle mesure de similarité)”, Rev. Mathématiques et Sciences Humaines, vol. 32, no. 8, pp. 5-15. Lerman, I.C. (1972), Étude distributionelle de statistiques de proximité entre structures algébriques finies
dumême type: Apllication à la classification automatique, Cahiers du B.U.R.O., 19, Paris.
Lerman, I.C. (1981), Classification et analyse ordinale des données, Dunod, Paris.
Lopes, M. P., & Nascimento, G. J. (2014), Liderança. In Palma, P., & Bancaleiro, M. (Ed.) Psicologia para
não psicólogos: A gestão à luz da psicologia, Editora RH, Lda, Lisboa.
Matusita, K. (1951), “On the theory of statistical decision functions”, Annals of the Institute of Statistical
Mathematics, vol. 3, pp. 17-35.
Nicolau, F.C. (1983), “Cluster analysis and distribution function”, Methods of Operations Research, vol. 45, pp. 431-433.
Nicolau, F.C., & Bacelar-Nicolau, H. (1998), ”Some trends in the classification of variables”. In: Hayashi, C., Ohsumi, N., Yajima, K., Tanaka, Y., Bock, H.-H., & Baba, Y. (Eds.), Data Science,
Classification, and Related Methods, Springer-Verlag, pp. 89-98.
Sahgal, P., & Pathak, A. (2007), “Transformational leaders: Their socialization, self-concept, and shaping experiences”, International Journal of Leadership Studies, vol. 2, no. 3, pp. 263-279.
Siegel, S.; Castellan, N.J. (1988), Non Parametric Statistics for the Behavioral Sciences, McGraw-Hill, Nova Iorque.
Sousa, Á., Bacelar-Nicolau, H., Nicolau, F.C., & Silva, O. (2015), "On clustering interval data with different scales of measures: Experimental results", Asian Journal of Applied Science and Engineering, vol. 4, no. 1, pp. 17-25, 2015.
Spears, L.C. (2010), “Character and servant leadership: Ten characteristics of effective, caring leaders”, The Journal of Virtues & Leadership, vol. 1, no. 1, pp. 25-30.
CC-BY-NC 2014, i-Proclaim | GDEB Page 153
Appendix A:
Results of the Wilcoxon signed rank test –Differences among leader appraisal and effective leader appraisal concerning scale items in the groups defined by the categories of the sociodemographic variables Scale Items 1 2 3 4 5 6 7 8 9 10 11 12 13 14 15 16 17 Total Score Gender Male .000 .000 .000 .384 .000 .000 .000 .000 .000 .000 .000 .000 .000 .000 .942 .000 .000 .000 Female .000 .000 .000 .092 .000 .000 .000 .000 .000 .000 .000 .000 .000 .000 .027 .000 .000 .000 Age group 18-25 years old .059 .157 .083 .705 .157 .317 .083 .180 .783 .783 .414 .257 1.000 1.000 1.000 1.000 .317 0.225 26-35 years old .000 .014 .004 .265 .001 .001 .010 .005 .000 .006 .001 .004 .000 .000 .031 .001 .002 .000 36-45 years old .000 .000 .000 .375 .000 .000 .000 .000 .000 .000 .000 .000 .000 .000 .252 .000 .000 .000 46-55 years old .000 .000 .000 .260 .000 .000 .001 .000 .000 .000 .001 .000 .000 .006 .651 .000 .000 .000 > 55 years old .073 .024 .016 .319 .016 .034 .003 .047 .031 .041 .159 .009 .006 .297 .672 .070 .022 0.013 Marital status Single .000 .013 .002 .938 .003 .001 .001 .044 .003 .025 .001 .001 .002 .026 .403 .013 .002 .000 Married .000 .000 .000 .023 .000 .000 .000 .000 .000 .000 .000 .000 .000 .000 .237 .000 .000 .000 Other .001 .001 .006 .772 .000 .001 .049 .005 .005 .023 .066 .051 .005 .019 .239 .021 .012 .000 Literary qualifications Up to4th grade .057 .003 .057 .009 .001 .078 .083 .115 .710 .033 .305 .198 .051 .874 .896 .107 .113 0.013 Up to9th grade .000 .000 .002 .335 .002 .000 .003 .003 .000 .010 .053 .003 .000 .195 .726 .002 .001 .000 Up to 12th grade .001 .000 .003 .820 .000 .000 .004 .004 .002 .019 .000 .001 .000 .001 .160 .000 .000 .000 Professional education .007 .272 .034 .564 .059 .066 .059 .038 .144 .470 .084 .084 .054 .047 .726 .783 .141 0.026 Bachelor degree .048 .238 .052 .518 .068 .026 .039 .027 .016 .101 .041 .131 .040 .084 .234 .020 .014 0.018 University degree (graduated employees) .000 .000 .000 .184 .000 .000 .000 .000 .000 .000 .000 .000 .000 .000 .143 .000 .000 .000 Postgraduate studies .157 .180 .317 .180 .317 .180 .180 .317 .317 .180 .157 .317 .317 1.000 .317 1.000 .317 0.180 Master’s degree .026 .066 .039 .577 .041 .063 .057 .059 .026 .026 .026 .034 .180 .102 .098 .059 .026 0.027
Public administration bond Tenured employment
contract .000 .000 .000 .017 .000 .000 .000 .000 .000 .000 .000 .000 .000 .000 .059 .000 .000 .000 Contract for an indefin
ite period of time .070 .007 .133 .846 .013 .001 .263 .254 .016 .507 .199 .178 .002 .223 .714 .008 .007 0.007 Contract for a definite/
Indefinite period of time .066 .317 .317 .317 .102 .180 .180 .102 .713 .785 .414 .157 .157 1.000 .492 .414 .257 0.225 Other .109 .317 .317 .102 .180 1.000 .157 .157 .109 .102 .102 .180 .655 .655 .180 .317 .180 0.109 Professional category Operational Assistant .000 .000 .005 .000 .000 .000 .008 .210 .058 .047 .003 .182 .001 .733 .841 .012 .016 .000 Technical Assistant .000 .000 .000 .806 .000 .000 .000 .000 .000 .001 .000 .000 .000 .000 .266 .000 .000 .000 Senior Technician .000 .000 .000 .815 .000 .000 .000 .000 .000 .000 .000 .000 .000 .000 .052 .000 .000 .000 Computer Expert .109 .180 .102 .180 .109 .109 .285 .109 .180 .102 .109 .317 .102 .180 .317 .180 .180 0.109 Computer Technician .317 .317 1.000 1.000 .317 .317 .317 .317 .317 .317 .317 1.000 .317 .317 .317 1.000 .317 0.317 --0--
Page 154 Volume 4, No 2/2015 | GDEB
Publish Online and Print Version Both Issue Link: http://hdl.handle.net/20.500.11903/gdeb.v4n2