jei
Trade Integration and Business Cycle Synchronization in the Euro Area: The Case of Southern European Countries
Abstract
This paper examines synchronization in the euro area and the role of intra-EMU trade from 1981 to 2011, focusing in particular on southern European countries. The results indicate that the intensification of synchronisation that occurred in the nineties across almost all countries could partially be explained by the increase in trade, which has been strengthened since the start of the run-up to the EMU. For southern European economies, the results are mixed. We find also that trade imbalances have grown over time, becoming more evident in the common currency period. Furthermore, we document a positive and significant relationship between intra-EMU trade linkages and cyclical correlations.
JEL Classifications: E32, F15, F41
Key Words: Business Cycle, Synchronisation, Trade, European Integration, Southern Europe
Trade Integration and Business Cycle
Synchronization in the Euro Area:
The Case of Southern European Countries
jei
Journal of Economic Integration
Sofia Gouveia
University of Trás-os-Montes and Alto Douro (UTAD), Vila Real, Portugal Leonida Correia
University of Trás-os-Montes and Alto Douro (UTAD), Vila Real, Portugal
* Corresponding Author: Sofia Gouveia; Department of Economics, Sociology and Management (DESG), Centre for Transdisciplinary
Development Studies (CETRAD), University of Trás-os-Montes and Alto Douro (UTAD), Complexo Pedagógico, Quinta de Prados
5001-801 Vila Real, Portugal, Tel: +351 259350725, E-mail: [email protected].
Co-Author: Leonida Correia; Department of Economics, Sociology and Management (DESG), Centre for Transdisciplinary
Develop-ment Studies (CETRAD), University of Tras-os-Montes and Alto Douro (UTAD), Complexo Pedagógico, Quinta de Prados, 5001-801 Vila Real, Portugal, Tel: +351 259350737, E-mail: [email protected].
Vol.28 No.1, March 2013, 85~107 http://dx.doi.org/10.11130/jei.2013.28.1.85
pISSN: 1225-651X eISSN: 1976-5525
jei
Vol.28 No.1, March 2013, 85~107 Sofia Gouveia and Leonida Correia http://dx.doi.org/10.11130/jei.2013.28.1.85I. Introduction
The current financial and economic crisis has played an important role in the revival of interest in business cycle synchronisation (BCS) within the euro area. It is widely argued that the success of the euro rests on the uniformity of cycles among member states across the European Monetary Union (EMU). More specifically, the OCA theory, pioneered by Mundell (1961), McKinnon (1963), and Kenen (1969), asserts that the closer the degree of cyclical synchronisation, the lower the stabilization costs of giving up monetary policy independence will be.
The creation of the euro may be expected to stimulate trade among its members because the adoption of a common currency reduces the transaction costs and riskiness of trade within the EMU. Theorists have tended to follow two different views about the effects of economic integration on synchronisation: the “specialization hypothesis” and the “OCA endogeneity hypothesis”. The former argues that deeper integration results in greater sectoral specialization, inducing greater vulnerability to asymmetric shocks and, consequently, less synchronised cycles (Krugman, 1993). The latter hypothesis assumes a positive link between trade integration and cyclical convergence in business cycles (Frankel and Rose, 1998). One reason for this second hypothesis is that, according to the Keynesian multiplier, the business cycle of one country could spill over to trading partners. Another explanation is that, if higher trade linkages increase intra-industry trade, aggregate demand shocks induce industry-specific shocks, which are similar among the countries which make up the monetary union. Thus, intra-industry trade leads to similar shocks between trading partner countries and strengthens their synchronisation.
Recently, several empirical studies have discussed the existence of a euro area cycle, but few authors have addressed the specific question of whether the business cycles of euro area countries have become more synchronised due to the EMU. The conclusions of these studies are also far from being consensual, and the short data sample makes robust results hard to find.1
There is also a complementary strand of literature that examines the determinants of synchronisation. Several factors have been explored, namely, the degree of trade integration, sectoral similarity, financial integration, and policy coordination. Regarding bilateral trade, the majority of authors provide evidence that countries with higher levels of bilateral trade have higher synchronisation (see Frankel and Rose, 1998; Clark and van Wincoop, 2001; Baxter and Kouparitsas, 2005; Imbs, 2004 and 2006; Cerqueira and Martins, 2009; Antonakakis and Tondl, 2011, among others).2 For the second determinant, sectoral specialization, the
results are mixed. Some studies conclude that countries with more similar structures are more
1 See, for example, De Haan et al. (2008) and Giannone et al. (2009) for a survey of this research program and the references
therein.
2 In a meta study, Rose (2008) provides a very good overview of the literature linking monetary union, international trade, and
jei
Trade Integration and Business Cycle Synchronization in the Euro Area: The Case of Southern European Countries
synchronous (Imbs, 2004 and 2006; Siedschlag, 2010), but others find that industrial similarity is not significant (Clark and van Wincoop, 2001; Cerqueira and Martins, 2009) or conclude that this relationship is not robust (Baxter and Kouparitsas, 2005). Concerning financial integration, the empirical results are not consensual; with some papers showing that economies with more financial interaction have a higher degree of synchronisation (Imbs, 2004 and 2006) and others going in the opposite direction (Cerqueira and Martins, 2009). Monetary and fiscal policy coordination is another determinant that has been evaluated with different results: some evidence suggests that policy coordination plays a positive role in explaining synchronisation (Darvas et al., 2007). On the other hand, another survey does not find a direct link (Clark and van Wincoop, 2001).
Summarising, we can conclude that while there seems to be a relative consensus among economists that close bilateral trade tends to accompany highly correlated business cycles, the literature provides mixed, less conclusive, results concerning the robustness or significance of other determinants. However, the studies that deal with trade integration focus mainly on industrial and developing countries; empirical evidence on the role of intra-EMU trade intensity on BCS in EMU countries is still scarce.
Furthermore, the results of several studies indicate that there are important differences between certain groups of countries within the euro area. Although all economies are subject to asymmetric shocks, there is a core of countries which are not affected as much as others. Germany, France, Austria, the Netherlands, and Belgium are almost always part of the core group, but its membership varies according to which authors are consulted. On the other hand, the four southern European countries, i.e. Greece, Italy, Portugal, and Spain, are almost always included in a peripheral group considered to be more vulnerable to asymmetric shocks. The current financial and economic crisis – the worst since the Great Depression of the 1930s – has focused particular attention on these economies, mainly as a result of their financial, budgetary, and public debt problems which have worsened appreciably since its onset in 2007. Given the fragility of their economic recovery, these countries are now facing problems of adjustment, but in a different way. The adjustment has been particularly difficult for Greece and Portugal, which have already been the subjects of intervention by the European Commission, the European Central Bank, and the International Monetary Fund. These two economies need to handle a complex situation that combines high fiscal deficits, governmental debt, and external debt with low growth rates, to be able to establish overall and external sustainability. Spain and Italy seem to be less problematic cases than Greece and Portugal. However these economies are also being forced to pursue restrictive measures even though they have not, until now, been in receipt of external recovery programmes.
To study the synchronization of the euro area countries is especially relevant when considering economic policy. In fact, the EMU is built on the notion that more integration across countries (in terms of trade, capital, and labour) will make the business cycles of those countries more similar, permitting the coordination of policies and creating better conditions
jei
Vol.28 No.1, March 2013, 85~107 Sofia Gouveia and Leonida Correia http://dx.doi.org/10.11130/jei.2013.28.1.85for common decisions to be made. If, however, integration does not make the cycles more convergent, the loss of the option of employing an independent monetary policy and giving up the exchange rate policy instrument, would constitute a major cost for euro area countries. Monetary and exchange rate instruments are especially important in the presence of asymmetric shocks, where they can help to stabilize idiosyncratic fluctuations. On the other hand, as the EMU is characterized by a mixture of some countries oriented towards the European market and more open to the rest of the world, it is important to explore whether trade integration should be seen as a factor fostering BCS.
The importance and relevance of these problems and the fact that there is a major lack of research on them, especially in the case of the above-mentioned southern European countries, has contributed to our decision to undertake the research described in this paper, which aims to provide answers to a number of questions raised in the literature for which, so far, no definitive answers have been provided. In summary, the purpose of this paper is threefold: 1) to analyse how trade integration has evolved over time in the euro area and, in particular, in southern European member countries; 2) to bring to light new evidence about BCS in the euro area, covering both the period prior to the current crisis and the period of crisis itself, and to analyse the role of trade integration in this process; 3) to explore whether the cycles of Greece, Italy, Portugal, and Spain are becoming increasingly synchronised relative to that of the euro area as a whole.
The remainder of this paper is organized as follows. In the next section the data and the methods are described. After this, some relevant facts about trade within the euro area are presented and discussed in section III. The fourth section contains the results of BCS and econometric analysis. Section V concludes.
II. Data and Methods
Our sample includes the first 12 countries that formed the euro area3, namely Austria
(AUT), Belgium (BEL), Finland (FIN), France (FRA), Germany (DEU), Spain (ESP), Greece (GRC), Ireland (IRL), Italy (ITA), Luxembourg (LUX), the Netherlands (NLD), and Portugal (PRT).
The methodology consists of three stages. First, in order to assess whether the process of economic integration in Europe has been accompanied by an increase in intra-EMU trade, we construct and analyse four different measures of intra-EMU trade intensity, paying the closest attention to the southern European countries.
3 As it is well known, at the present time, Slovenia (since 2007), Cyprus and Malta (since 2008), Slovakia (since 2009), and Estonia
(since 2011) are members of the EMU. These countries were excluded from the analysis due to the unavailability of data. Data for EMU12 is available for the whole sample whereas the compilation of data for enlarged EMU aggregates is still in progress. However, differences between these aggregates are rather small due to the diminutive weight of these 5 new member states in the euro area GDP.
jei
Trade Integration and Business Cycle Synchronization in the Euro Area: The Case of Southern European Countries
Our first measure (Trade1) is trade (exports and imports of goods) with other EMU members normalised by total trade:
t i t i t EMU i t EMU i t EMU i X M M X TRADE , , , , , , , , 1 + + =
where Xi,EMU,t is nominal merchandise exports from country i to the other 11 member
countries of the EMU, in year t; Mi,EMU,t is nominal merchandise imports of country i from
the others 11 EMU members in year t; Xi,t and Mi,t indicate, respectively, i’s total exports and
imports in year t.
The second measure (Trade2) is a usual measure of trade openness, total trade with other EMU members as a fraction of the country’s GDP:
t i t EMU i t EMU i t EMU i GDP M X TRADE , , , , , , , 2 = +
In addition to using the second measure as an index of total euro area trade we also calculate analogous measures for exports and imports individually. The third measure (Trade3) is the country’s exports to other EMU members as a fraction of the country’s GDP:
t i t EMU i t EMU i GDP X TRADE , , , , , 3 =
The fourth measure (Trade 4) is country’s imports from other EMU members as a proportion of the country’s GDP: t i t EMU i t EMU i GDP M TRADE , , , , , 4 =
The larger the values of these measures the more intensive the trade between country i and the other EMU member countries is. The trade intensity measures are calculated by aggregating annual bilateral trade flows (exports f.o.b., imports c.i.f.) for the period of 1981~2011 from the OECD´s Monthly Statistics of International Trade Database. Statistics of GDP data are collected from the OECD’s Main Economic Indicators.
To analyse changes in trade flows over time, we consider four sub-periods with breaks at important moments in the history of European economic and monetary integration. The first sub-period, which runs from 1981 to 1989, was marked by great stability in the functioning of the EMS, and includes the implementation of the Single European Act. The second sub-period goes from 1990 to 1998, covering the implementation of several proposals made in the Delors Report. The third sub-period begins in 1999 with the inception of the EMU and goes to 2007, the onset of the current crisis. The last sub-period, from 2008 to 2011, corresponds to the economic and sovereign debt crisis in the euro area.
Next, in the second stage, we analyse synchronisation in the euro area, emphasizing the
1
2
3
jei
Vol.28 No.1, March 2013, 85~107 Sofia Gouveia and Leonida Correia http://dx.doi.org/10.11130/jei.2013.28.1.85comparison between the four southern European countries and the other euro area members. We use seasonally adjusted quarterly real GDP, which in general covers the 1981:1~2011:4 period (see full details Table 1A in Appendix). We focus on euro area activity as a whole, measured by real GDP, against which we measure the synchronization of the real GDP of individual countries. We use the euro area aggregate, EMU12. To check the robustness of our findings, we consider as another measure of euro area aggregate activity the sum of the ten countries, EMU10, for which we have figures for the entire period (the twelve members of the euro area, with the exception of Luxembourg and Ireland, for which quarterly data was only available for quite a short period of the total period we covered).
We begin by calculating the cyclical component of GDP. Because empirical results might depend on the specific filter adopted to obtain the cycle (Canova, 1998), in order to make our results robust, we apply a high band-pass filter, the band-pass (BP) filter (Baxter and King, 1999), and the Hodrick-Prescott (HP) filter (Hodrick and Prescott, 1997).4 Among the filters
used, the BP filter is preferable from a theoretical point of view (Stock and Watson, 1998). For this reason, and because we have obtained similar results, for the sake of brevity, in the study of BCS we only present the BP filtered correlations.
Next, we calculate the Spearman correlation coefficients. For each country under study, we analyse the coefficients of contemporary correlation as well as the maximum correlation. We consider a window of a maximum of 5 quarters of leads and lags and from among those 11 correlations the highest figure is chosen. To examine the evolution of the degree of BCS along the sample period, we compute the correlation coefficients for the four sub-samples defined above.
The third stage concerns econometric analysis. In order to examine the empirical relationship between trade intensity and BCS among euro area countries we employ the general model developed by Frankel and Rose (1998). We apply panel data with instrumental variable (IV) estimation. Instruments serve to separate the exogenous from the endogenous components in trade intensity variables. The instruments chosen are the ones provided by the gravity models and include the log of the geographic distance between the capital cities.
III. Trade Integration: A Descriptive Analysis
This section looks at some aspects of trade integration in euro area countries and compares
4 For example, Baxter and King (1999) and Croux et al. (2001) show that the degree of synchronization of cycles differs across
frequency bands. We examine whether our results are sensitive to the configuration of the band pass filter. In particular we have configured the high band-pass filter to extract fluctuations between 0.5 and 8 years and the BP filter with durations of between 1.5 and 8 years. For the HP filter we use l = 1600, which is the conventional value for quarterly data. Although this indeed affects our correlation
jei
Trade Integration and Business Cycle Synchronisation in the Euro Area: The Case of Southern European Countries
the intra-EMU trade patterns of southern European countries (SE4) to that of other EMU countries over the last thirty years.
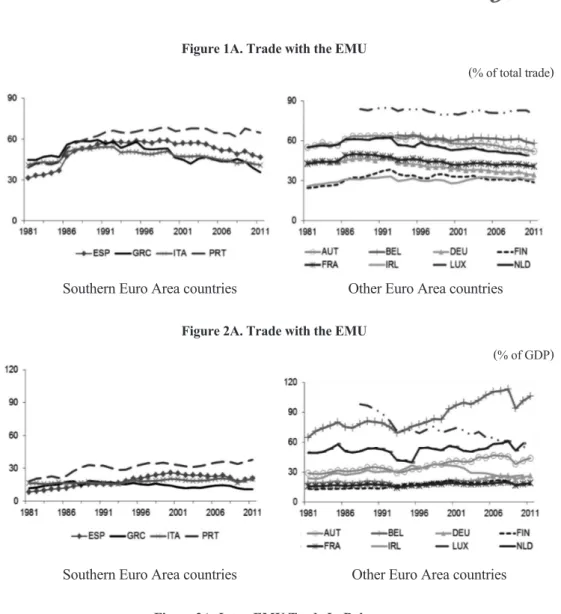
In the period under analysis there appears to be a gradual increase in trade integration among euro area countries. In particular, in the second half of the 80s and the early 90s, there is a visible intensification of intra-EMU trade which is greater in the SE4 countries than in the other group (Figures 1A and 2A in Appendix).
Table 1 shows intra-EMU trade both as a percentage of overall trade and of GDP and Table 2 provides intra-EMU exports and imports as a percentage of GDP for the four sub-periods and for the full period.
Table 1. Intra-EMU Trade for Euro Area Countries, 1981~2011
Share of Exports plus imports in total trade (%) Share of Exports plus imports in GDP (%) Country 1981~1989 1990~1998 1999~2007 2008~2011 1981~2011 1981~1989 1990~1998 1999~2007 2008~2011 1981~2011 ESP 41.8 57.7 55.6 48.7 51.3 11.8 18.8 24.0 19.9 18.4 GRC 51.3 55.5 45.7 40.8 49.5 15.2 16.2 13.3 11.9 14.5 ITA 46.8 51.3 46.9 42.0 47.5 16.4 17.3 19.5 19.0 17.9 PRT 48.6 65.5 66.4 65.0 60.8 24.3 31.7 33.5 35.8 30.6 Av. SE4 47.1 57.5 53.6 49.1 52.3 16.9 21.0 22.6 21.7 20.4 AUT 59.4 62.4 57.5 53.2 59.0 30.5 33.4 42.5 42.2 36.3 BEL 62.5 63.0 61.3 59.9 61.5 75.0 76.3 100.1 103.6 86.5 DEU 47.1 46.5 42.0 38.7 44.4 20.7 19.3 24.9 27.4 22.4 FIN 28.5 34.6 32.5 30.1 31.6 13.3 16.8 20.1 18.0 16.9 FRA 49.4 52.6 50.4 48.0 50.4 17.5 18.8 21.8 21.1 19.6 IRL 30.6 32.9 32.8 34.1 32.4 28.4 35.0 33.3 28.3 31.8 LUX 83.4 83.5 80.9 81.9 82.3 97.3 77.2 68.3 55.8 72.0 NLD 58.2 58.5 53.1 50.0 55.9 51.7 49.0 54.1 56.9 52.1 Av. Others 51.0 54.2 51.3 49.5 52.2 41.8 40.7 45.7 44.2 42.2
jei
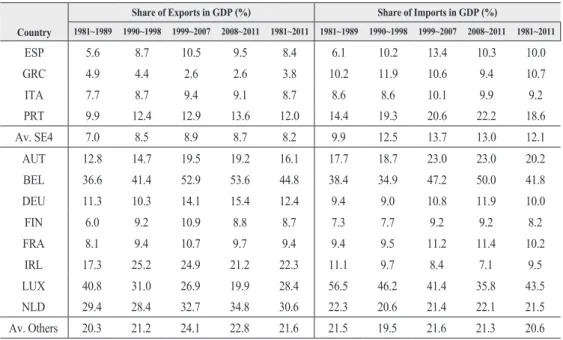
Vol.28 No.1, March 2013, 85~107 Sofia Gouveia and Leonida Correia http://dx.doi.org/10.11130/jei.2013.28.1.85Table 2. Intra-EMU Exports and Imports for Euro Area Countries, 1981~2011
Share of Exports in GDP (%) Share of Imports in GDP (%)
Country 1981~1989 1990~1998 1999~2007 2008~2011 1981~2011 1981~1989 1990~1998 1999~2007 2008~2011 1981~2011 ESP 5.6 8.7 10.5 9.5 8.4 6.1 10.2 13.4 10.3 10.0 GRC 4.9 4.4 2.6 2.6 3.8 10.2 11.9 10.6 9.4 10.7 ITA 7.7 8.7 9.4 9.1 8.7 8.6 8.6 10.1 9.9 9.2 PRT 9.9 12.4 12.9 13.6 12.0 14.4 19.3 20.6 22.2 18.6 Av. SE4 7.0 8.5 8.9 8.7 8.2 9.9 12.5 13.7 13.0 12.1 AUT 12.8 14.7 19.5 19.2 16.1 17.7 18.7 23.0 23.0 20.2 BEL 36.6 41.4 52.9 53.6 44.8 38.4 34.9 47.2 50.0 41.8 DEU 11.3 10.3 14.1 15.4 12.4 9.4 9.0 10.8 11.9 10.0 FIN 6.0 9.2 10.9 8.8 8.7 7.3 7.7 9.2 9.2 8.2 FRA 8.1 9.4 10.7 9.7 9.4 9.4 9.5 11.2 11.4 10.2 IRL 17.3 25.2 24.9 21.2 22.3 11.1 9.7 8.4 7.1 9.5 LUX 40.8 31.0 26.9 19.9 28.4 56.5 46.2 41.4 35.8 43.5 NLD 29.4 28.4 32.7 34.8 30.6 22.3 20.6 21.4 22.1 21.5 Av. Others 20.3 21.2 24.1 22.8 21.6 21.5 19.5 21.6 21.3 20.6
(Note) Av. : Average
In summary the following main conclusions are suggested by Tables 1 and 2:
- From the first to the second sub-period the share of intra-EMU trade in total trade has increased. Since then, there has been a downward trend in almost all countries, which worsened in the crisis period, with the exception of Ireland. In the cases of Italy and Germany, the proportion of trade with other EMU members in the crisis period was lower than that of the first sub-period. It is worth noting that on average in SE4 countries the values of intra-EMU trade to total trade ratio are smaller than in the other group, in both the first sub-period and in the crisis period.
- The degree of openness with other countries in the euro area has increased over the three sub-periods for almost all countries but has decreased for Spain, Italy, Austria, Finland, France, Ireland, and Luxembourg in the crisis period. In the SE4 group, Portugal is the country that has the highest degree of openness, followed by Spain and Italy. In contrast, the least open is Greece. From the first to the fourth sub-period, the share of intra-EMU trade went from 15% of its GDP to 12%, while the share of intra-EMU exports in GDP decreased from 5% to 3%.5
- Within the other group of countries, in the crisis period, the proportion of intra-EMU trade varied widely from 18%-21% of GDP in Finland and France compared with 57% and 104% for the Netherlands and Belgium, respectively.
5 Trade data refers only to goods. If we include services, Greece would have reported a higher degree of openness because of the
jei
Trade Integration and Business Cycle Synchronization in the Euro Area: The Case of Southern European Countries
- Comparison between exports and imports reveals that trade imbalances within the EMU have grown since the introduction of the euro. While SE4 countries have widened their deficits, the other group has seen an increase in their intra-UEM trade surplus, with the exception of Austria, France, and Luxembourg.6
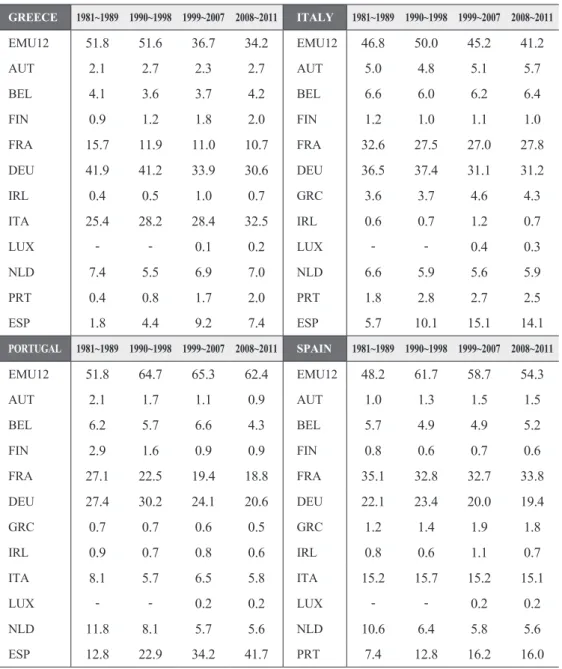
Moreover, a detailed analysis of the exports and imports of southern countries by examining the origin and destination of goods (Tables 2A and 3A, in Appendix) shows that Portugal has a high ratio of exports to EMU countries as a percentage of its total exports and this trend increased until the onset of the financial crisis. Intra-EMU imports represent a significant proportion of total imports: these range from 67% in Portugal, followed by Spain (45%) to 43% in Italy and Greece, in the last sub-period. These countries sell/buy goods mainly to/from Germany and France, although since the second sub-period Portugal has increased its shares of exports and imports to Spain whilst decreasing those to Germany.
Overall, the results of this section suggest that deepening European integration was associated with a rise in intra-EMU trade. However, after the formation of the EMU and in the period from 2008 to 2011 the increase in trade seems small, a result in line with Berger and Nitsch (2008) and Silva and Tenreyro (2010), who conclude that the creation of the European common market had a greater effect on trade than the introduction of the euro itself.
IV. Trade Integration and Synchronisation
In this section we present and analyse the results of the correlation coefficients between the business cycle of each country and the reference business cycle (EMU12).7 Then we estimate
the effect of intra-euro trade intensity on BCS.
A. Synchronisation: Southern Countries versus other Euro Area Countries
Figure 4A in Appendix displays the cyclical components of GDP, band-pass filtered, over the period of 1981:1~2011:4. It is clear that synchronization fluctuates substantially over time and differs across countries. Nevertheless, it seems that the degree of synchronization has increased over the last 30 years, particularly in the period corresponding to the current financial and economic crisis. The results for the lead-lag correlations presented in Table 4A in Appendix6 Figure 3A in Appendix provides more insight into this situation, showing intra-EMU trade balances as a country’s exports to the
other 11 EMU countries, minus imports from those countries.
jei
Vol.28 No.1, March 2013, 85~107 Sofia Gouveia and Leonida Correia http://dx.doi.org/10.11130/jei.2013.28.1.85provide similar conclusions. Over the whole sample euro area countries reveal a heterogeneous degree of association with the EMU12 cycle. We can also conclude that, with the exception of Greece, all countries increased their BCS with the euro area after the inception of the EMU.
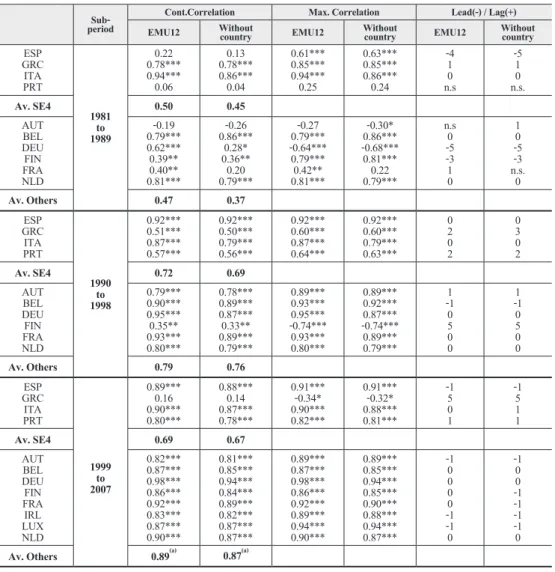
In order to assess additional information about the dynamic pattern of business cycles in the euro area we perform correlation coefficients for the sub-periods previously defined (Table 3). Moreover, we calculate the correlations between the business cycles of each country and of the aggregate EMU12 excluding that country. This was thought applicable because, essentially for the largest countries (i.e. Germany, Spain, France, and Italy), comparisons might suffer from the obvious bias that those countries contribute the most to the oscillations of real output in the euro area.
Table 3. Correlations for Euro Area Countries
Sub-period EMU12Cont.CorrelationWithout country EMU12Max. CorrelationWithout country EMU12Lead(-) / Lag(+)Without country
ESP GRCITA PRT 1981to 1989 0.22 0.78*** 0.94***0.06 0.13 0.78*** 0.86***0.04 0.61*** 0.85*** 0.94***0.25 0.63***0.85***0.86***0.24 n.s-410 n.s.-510 Av. SE4 0.50 0.45 AUT BEL DEUFIN FRA NLD -0.19 0.79*** 0.62***0.39** 0.40** 0.81*** -0.26 0.86***0.28* 0.36**0.20 0.79*** -0.27 0.79*** -0.64***0.79*** 0.42** 0.81*** -0.30* 0.86*** -0.68***0.81*** 0.22 0.79*** n.s0 -5 -3 1 0 1 0 -5 -3 n.s.0 Av. Others 0.47 0.37 ESP GRCITA PRT 1990 to 1998 0.92*** 0.51*** 0.87*** 0.57*** 0.92*** 0.50*** 0.79*** 0.56*** 0.92*** 0.60*** 0.87*** 0.64*** 0.92*** 0.60*** 0.79*** 0.63*** 0 2 0 2 0 3 0 2 Av. SE4 0.72 0.69 AUTBEL DEUFIN FRA NLD 0.79*** 0.90*** 0.95***0.35** 0.93*** 0.80*** 0.78*** 0.89*** 0.87***0.33** 0.89*** 0.79*** 0.89*** 0.93*** 0.95*** -0.74*** 0.93*** 0.80*** 0.89*** 0.92*** 0.87*** -0.74*** 0.89*** 0.79*** 1 -10 5 0 0 1 -10 5 0 0 Av. Others 0.79 0.76 ESP GRCITA PRT 1999to 2007 0.89***0.16 0.90*** 0.80*** 0.88***0.14 0.87*** 0.78*** 0.91***-0.34* 0.90*** 0.82*** 0.91***-0.32* 0.88*** 0.81*** -15 0 1 -15 1 1 Av. SE4 0.69 0.67 AUTBEL DEUFIN FRAIRL LUX NLD 0.82*** 0.87*** 0.98*** 0.86*** 0.92*** 0.83*** 0.87*** 0.90*** 0.81*** 0.85*** 0.94*** 0.84*** 0.89*** 0.82*** 0.87*** 0.87*** 0.89*** 0.87*** 0.98*** 0.86*** 0.92*** 0.89*** 0.94*** 0.90*** 0.89*** 0.85*** 0.94*** 0.85*** 0.90*** 0.88*** 0.94*** 0.87*** -10 0 0 0 -1 -10 -10 0 -1 -1 -1 -10 Av. Others 0.89(a) 0.87(a)
(Note) *, **, and *** denote significance at the 10%, 5%, and 1% levels, respectively. (a) Average excluding
jei
Trade Integration and Business Cycle Synchronization in the Euro Area: The Case of Southern European Countries
One important outcome from Table 3 is that only in the first sub-period are there overestimations for Germany, France, and, albeit to a much smaller extent, Italy, when taking the EMU12 aggregate instead of EMU12 minus each country. These differences are diluted in the second and third sub-periods.
Secondly, it is obvious that the business cycles of southern European countries are, on average, comparably synchronised with the euro area aggregate in a manner that is similar to that of other EMU countries in the first and second sub-periods; only in the third period is the degree of BCS substantially lower. In any case, the difference is insignificant if we do not consider Greece (0.86).
A third main finding is that the average of estimated correlations has increased considerably from the first to the second sub-period, which is more pronounced for the other group. From the second to the common currency period there is no relevant change in the average correlation coefficients of SE4 countries, while the average for the group of the rest of the EMU economies records a slight increase with the introduction of the euro in 1999. The largest economies and some small countries such as Austria, Belgium, and the Netherlands display a strong association with the euro area cycle, right from the start of the run-up to the EMU. The inception of the EMU does not seem to have had a strong effect on synchronisation for these seven countries.8
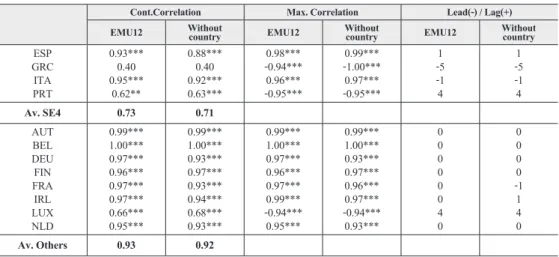
These findings are consistent with some related literature (for example, Weyerstrass et al., 2009). To better understand the role of the recent crisis in the BCS of the euro area countries we calculate the correlations for the 2008~2011 period (Table 4).
Table 4. Correlations for Euro Area Countries, 2008:1~2011:4
Cont.Correlation Max. Correlation Lead(-) / Lag(+) EMU12 Without country EMU12 Without country EMU12 Without country
ESP GRC ITA PRT 0.93*** 0.40 0.95*** 0.62** 0.88*** 0.40 0.92*** 0.63*** 0.98*** -0.94*** 0.96*** -0.95*** 0.99*** -1.00*** 0.97*** -0.95*** 1 -5 -1 4 1 -5 -1 4 Av. SE4 0.73 0.71 AUT BEL DEU FIN FRA IRL LUX NLD 0.99*** 1.00*** 0.97*** 0.96*** 0.97*** 0.97*** 0.66*** 0.95*** 0.99*** 1.00*** 0.93*** 0.97*** 0.93*** 0.94*** 0.68*** 0.93*** 0.99*** 1.00*** 0.97*** 0.96*** 0.97*** 0.99*** -0.94*** 0.95*** 0.99*** 1.00*** 0.93*** 0.97*** 0.96*** 0.97*** -0.94*** 0.93*** 0 0 0 0 0 0 4 0 0 0 0 0 -1 1 4 0 Av. Others 0.93 0.92
(Note) *, **, and *** denote significance at the 10%, 5%, and 1% levels, respectively.
8 In order to test the statistical significance of these results we have applied the Z test statistic of Fisher to the difference between
the contemporaneous correlation coefficients of the second and third periods. The test does not allow the rejection of the null hypothesis of no change in correlations for these seven countries. In contrast, we reject the null hypothesis of similar coefficients in these two
sub-jei
Vol.28 No.1, March 2013, 85~107 Sofia Gouveia and Leonida Correia http://dx.doi.org/10.11130/jei.2013.28.1.85It is remarkable that there is a substantial increase in synchronization in the recent recession period for almost all euro area countries. With the exception of Greece, Portugal, and Luxembourg, the contemporaneous correlations are higher than 0.9. It is also evident that the group of other economies is more homogeneous than the SE4 group. Excluding Luxembourg, the seven countries have a similar and very strong (1.0) association with the euro area cycle. Within the SE4 group, the cycles are not contemporaneously synchronized with the EMU aggregate: Spain and Portugal lag by one and four quarters, respectively, contrasting with Greece and Italy that lead by five and one quarter, respectively.
B. The Effect of Intra-EMU Trade on Synchronisation
In order to study the effect of trade integration on synchronization we estimate the following equation:
t t
t α0 α1 , , , ,
,
,EMU iEMU iEMU
i TRADE u
BCS = + +
where BCSi,EMU,t denotes the Spearman correlation coefficient between the cyclical
component of GDP in country i and the cyclical component in the euro area over time period t. The measure of the cycle has been obtained by both BP and HP filters of real output date (designated BCS1 and BCS2, respectively). TRADEi,EMU,t denotes the natural logarithm of the
average trade intensity between country i and the other 11 euro area countries at period t, using the four measures. Lastly, ei,EMU,t expresses the disturbances on cyclical correlations beyond
the influences of trade within the EMU. Our main interest lies in the sign of the coefficient α1.
As stated above, most empirical evidence seems to be consistent with the possibility that higher trade intensity in a currency area leads to a greater synchronisation of member countries’ cycles.
A problem with this equation is that trade intensity itself may be endogenous. Based on the literature, we run the following regression for trade:
t t
t β0 β1 , , e , ,
,
,EMU iEMU iEMU
i DIST
TRADE = + +
where TRADEi,EMU,t corresponds to the country´s trade intensity with other countries in
the EMU and DISTi,EMU,t is distance between country i and the EMU. We use two alternative
measures of distance: the natural logarithm of the average geographic distance between a single country and the other EMU countries and the natural logarithm of the maximum geographic distance between a single country and the other EMU countries.
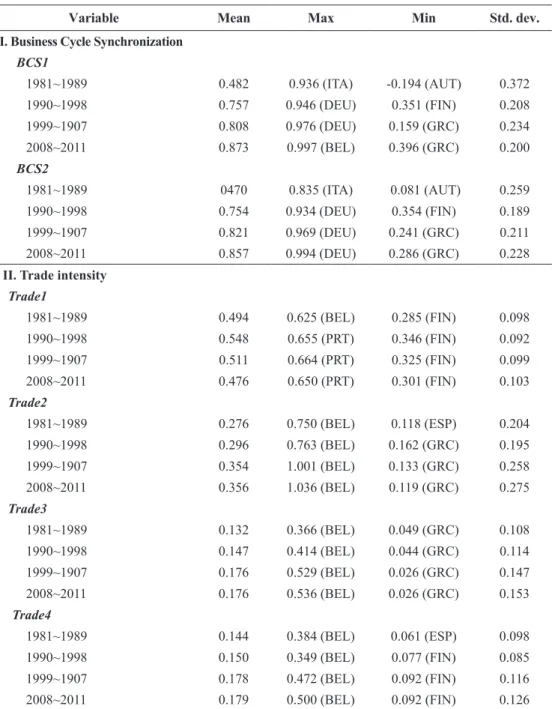
The summary descriptive statistics of the variables used in the regression estimations are given in Table 5.9 The average business cycle correlation increased for all the sub-periods.
jei
Trade Integration and Business Cycle Synchronization in the Euro Area: The Case of Southern European Countries
Almost all the measures of trade intensity (except the first) show a steady upward trend during the three first sub-periods and a levelling off in the crisis period.
Table 5. Cycle Correlations and Trade Intensity: Summary Statistics
Variable Mean Max Min Std. dev.
I. Business Cycle Synchronization BCS1 1981~1989 0.482 0.936 (ITA) -0.194 (AUT) 0.372 1990~1998 0.757 0.946 (DEU) 0.351 (FIN) 0.208 1999~1907 0.808 0.976 (DEU) 0.159 (GRC) 0.234 2008~2011 0.873 0.997 (BEL) 0.396 (GRC) 0.200 BCS2 1981~1989 0470 0.835 (ITA) 0.081 (AUT) 0.259 1990~1998 0.754 0.934 (DEU) 0.354 (FIN) 0.189 1999~1907 0.821 0.969 (DEU) 0.241 (GRC) 0.211 2008~2011 0.857 0.994 (DEU) 0.286 (GRC) 0.228
II. Trade intensity Trade1 1981~1989 0.494 0.625 (BEL) 0.285 (FIN) 0.098 1990~1998 0.548 0.655 (PRT) 0.346 (FIN) 0.092 1999~1907 0.511 0.664 (PRT) 0.325 (FIN) 0.099 2008~2011 0.476 0.650 (PRT) 0.301 (FIN) 0.103 Trade2 1981~1989 0.276 0.750 (BEL) 0.118 (ESP) 0.204 1990~1998 0.296 0.763 (BEL) 0.162 (GRC) 0.195 1999~1907 0.354 1.001 (BEL) 0.133 (GRC) 0.258 2008~2011 0.356 1.036 (BEL) 0.119 (GRC) 0.275 Trade3 1981~1989 0.132 0.366 (BEL) 0.049 (GRC) 0.108 1990~1998 0.147 0.414 (BEL) 0.044 (GRC) 0.114 1999~1907 0.176 0.529 (BEL) 0.026 (GRC) 0.147 2008~2011 0.176 0.536 (BEL) 0.026 (GRC) 0.153 Trade4 1981~1989 0.144 0.384 (BEL) 0.061 (ESP) 0.098 1990~1998 0.150 0.349 (BEL) 0.077 (FIN) 0.085 1999~1907 0.178 0.472 (BEL) 0.092 (FIN) 0.116 2008~2011 0.179 0.500 (BEL) 0.092 (FIN) 0.126
jei
Vol.28 No.1, March 2013, 85~107 Sofia Gouveia and Leonida Correia http://dx.doi.org/10.11130/jei.2013.28.1.85Table 6 shows the results for the first stage regressions of trade intensity on the two measures of distance.
Table 6. Estimates of First-stage Regressions, 1981~2011
Trade1 Trade2 Trade3 Trade4
Average distance (in logs) -0.248**
(-2.22) -1.099***(-3.33) -1.644***(-5.35) -0.715**(-2.62) R2
F-Statistics 0.124.93 16.020.30 28.580.43 0.156.84
Maximum distance (in logs) -0.261
(-1.59) -1.114**(-2.59) -1.666***(-3.24) -0.691*(-1.69) R2
F-Statistics 0.062.52 0.156.70 10.510.20 0.072.86
(Note) *, **, and *** denote significance at the 10%, 5%, and 1% levels, respectively. Numbers in parenthesis represent t-statistics. Intercepts are not reported. Annual trade data for 10 Euro area countries, from 1981 to 2011, split into four sub-periods. Sample size = 40.
The average and maximum geographic distance are both highly significant and strongly negatively associated with intra-EMU trade intensity, as predicted by standard “gravity” models of international trade. This means that EMU members that are closer in distance, trade more intensively with each other. Additionally, all trade measures are better instrumented by average distance.
Table 7 reports the IV estimates of the effect of intra-euro area trade on BCS, using trade measures instrumented by average distance.10
Table 7. IV Estimates of the Effects of Trade Integration on Synchronization, 1981~2011
Trade1 Trade2 Trade3 Trade4
BCS1 1.814*
(1.74) 0.410**(2.56) 0.274***(2.90) 0.631**(2.07)
BCS2 1.762*(1.81) 0.398***(2.77) 0.266***(3.22) 0.613**(2.13)
(Note) *, **, and *** denote significance at the 10%, 5%, and 1% levels, respectively. Numbers in parenthesis represent t-statistics. Intercepts are not reported. The instrumental variable for trade intensity is the log of average distance. Annual trade data for 10 Euro area countries, from 1981 to 2011, split into four sub-periods. Sample size = 40. IV: Instrumental Variable
10 Table 5A, in Appendix, is analogous to Table 7, but excludes the crisis period. Although two estimated coefficients lost their
jei
Trade Integration and Business Cycle Synchronization in the Euro Area: The Case of Southern European Countries
The estimated coefficients take the expected positive sign and are generally statistically significant. These positive coefficients imply that the more one country trades with other euro area members, the more highly correlated the country’s business cycle with the EMU cycle will be. These results are robust with respect to different measures of business cycle co-movement and trade intensity. The regression results support the hypothesis that trade integration, in the EMU context, tends to foster BCS and therefore, has reduced the costs associated with the adoption of the euro. This is in line with the results of Abbott et al. (2008), Furceri & Karras (2008), Siedschlag (2010), and Dées & Zorell (2011).
V. Summary and Conclusions
We have examined whether the introduction of the euro has changed the historical pattern of the business cycle correlation of euro area member countries and the effects of trade integration on this process. We give particular attention to southern European countries that have displayed significant growth constraints, along with budgetary and external debt fragilities, compared with core euro economies.
It is widely argued that the success of the common currency area in Europe rests on the uniformity of business cycle fluctuations. Overall, we find that almost all euro area countries have become increasingly synchronized over time. The intensification of synchronization that occurred in the nineties can partially be explained by the increase in trade, which had been strengthened since the start of the run-up to the EMU. The inception of the EMU does not seem to have had a strong effect on almost any of the economies.
For southern European countries the results are diverse. Italy and Spain do not stand out distinctly from these common features. Portugal is a particular case only due to having become significantly correlated with the euro area and because it has had the highest share of intra-EMU trade since the adoption of the euro. Greece is an exception: starting from a high level of synchronization, it experienced a decrease in the nineties and a decoupling from the euro area cycle after the introduction of the euro. This would seem to be related to the fact that it was one of the countries that decreased its trade openness.
During the crisis period (2008~2011) there was remarkable business cycle synchronization in euro area countries; the exceptions being Greece, Portugal and Luxembourg. On average, the intensity of intra-EMU trade stabilised in this period and some countries recorded a decrease.
Another key result is that trade imbalances have grown over time, with more expression in the common currency period. The group of southern European countries has become more negatively distinct from the remaining EMU countries. The situation is particularly problematic for Greece and Portugal which have consistently run trade deficits.
jei
Vol.28 No.1, March 2013, 85~107 Sofia Gouveia and Leonida Correia http://dx.doi.org/10.11130/jei.2013.28.1.85and significantly associated with the correlations between the individual cycles of member countries and the EMU cycle as a whole.
Overall, the results of this research allow us to undertake a diagnosis of how the participation southern European countries in the euro project has affected their convergence dynamics in the past. It remains to be seen whether recent developments in the euro area, especially the effects of the ongoing euro area crisis, will aggravate or alleviate the disparities between southern economies and the economies of other EMU members. Southern countries are in need of a rapid adjustment, budgetary consolidation, and a strengthening of competitiveness. An in depth understanding of how each of these countries acquired their fragile status and of how the so-called “crisis on Europe’s periphery” altered their convergence dynamics within the euro area will be of enormous help in defining and evaluating economic policies. There is clearly a considerable amount of research that will continue to merit our attention in the future, when more information on the durability of the euro with new analytical methods will emerge.
Received 11 January 2012, Revised 4 October 2012, Accepted 20 October 2012
References
Abbott, A., Joshy, E., Xing, E. (2008) Trade integration and Business cycle Convergence: Is the Relation Robust across Time and Space? Scandinavian Journal of Economics, 110 (2), 403-417
Antonakakis, N., Tondl, G. (2011) Has Integration Promoted Business Cycle Synchronization in the Enlarged EU? FIW Working Paper series, 75, FIW
Baxter, M., Kouparitsas, M. (2005) Determinants of Business Cycle Comovement: a robust analysis, Journal of Monetary Economics, 52(1), 113-57
Baxter, M., King, R. (1999) Measuring Business Cycles: Approximate Band-Pass Filters for Economic Time Series, Review of Economics and Statistics, 81, 575-93
Berger, H., Nitsch, V. (2008) Zooming out: The trade effect of the euro in historical perspective, Journal of International Money and Finance, 27(8), 1244-1260
Canova, F. (1998) Detrending and Business Cycle Facts, Journal of Monetary Economics, 41, 475-512 Cerqueira, P., Martins, R. (2009) Measuring the determinants of business cycle synchronization using a panel approach, Economic Letters, 102(1), 106-108
Clark, T., van Wincoop, E. (2001) Borders and business cycles, Journal of International Economics, 55, 59-85 Croux, C., Forni, M., Reichlin, L. (2001) A Measure for Comovement of Economic Variables: Theory and Empirics, The Review of Economics and Statistics, 83, 232-41
Darvas, Z., Rose, A., Szapáry, G. (2007) Fiscal divergence and business cycle synchronization: Irresponsibility is idiosyncratic, in NBER International Seminar on Macroeconomics 2005 (Ed.) J. Frankel, Pissarides, C., MIT Press, Cambridge, pp. 261-98
jei
Trade Integration and Business Cycle Synchronization in the Euro Area: The Case of Southern European Countries
De Haan, J., Inklaar R., Jong-A-Pin, R. (2008) Will business cycles in the euro area converge? A critical survey of empirical research, Journal of Economic Surveys, 22, 234-273
Dées, S., Zorell, N. (2011) Business Cycle Synchronisation – Disentangling Trade and Financial Linkages, ECB Working Paper Series 1322
Frankel, J., Rose, A. (1998) The Endogeneity of the Optimum Currency Area Criteria, Economic Journal, 108, 1009-1025
Furceri, D., Karras, G. (2008) Business-Cycle Synchronization in EMU, Applied Economics, 40 (12), 1491-1501
Giannone, D., Lenza M., Reichlin L. (2009) Business Cycles in the Euro Area, ECB Working Paper Series 1010
Hodrick, R., Prescott, E. (1997) Postwar U.S. Business Cycles: An Empirical Investigation, Journal of Money Credit and Banking, 29, 1-16
Imbs, J. (2004) Trade, Finance, Specialization and Synchronization, Review of Economics and Statistics, 86, 723-34
Imbs, J. (2006) The Real Effects of Financial Integration, Journal of International Economics, 68, 296-324 Kenen, P. (1969) The Theory of Optimum Currency Areas: An Eclectic View, in Monetary Problems of the International Economy (Ed.) Mundell, R., Swoboda, A. K. University of Chicago Press, Chicago, pp. 41-60 Krugman, P. (1993) Lessons from Massachusetts for EMU, in Adjustment and Growth in the European Union (Ed.) Torres, F., Giavazzi, F., Cambridge University Press, Cambridge, pp. 241-60
McKinnon, R. (1963) Optimum Currency Areas, The American Economic Review, 53, 717-25
Mundell, R. (1961) A Theory of Optimum Currency Areas, The American Economic Review, 51, 657-65 Rose, A.K. (2008) EMU, Trade and Business Cycle Synchronization. University of California, Berkeley working paper, mimeo
Siedschlag, I. (2010) Patterns and determinants of business cycle synchronization in the enlarged European Economic and Monetary Union, Eastern Journal of European Studies, 1(1), 21-44
Silva, J., Tenreyro, S. (2010) Currencies Unions in Prospect and Retrospect, Annual Review of Economics, 2, 51-74
Stock, J., Watson, M. (1998) Business Cycle Flutuations in U. S. Macroeconomics Time Series, NBER 6528 Weyerstrass, K., van Aarle, B., Kappler M., Seymen, A. (2009) Business Cycle Synchronization with(in) the Euro Area: in search of a ‘Euro Effect, Open Econ Rev (published online: 3 September 2009, DOI 10.10077s11079-009-9131-y)
jei
Vol.28 No.1, March 2013, 85~107 Sofia Gouveia and Leonida Correia http://dx.doi.org/10.11130/jei.2013.28.1.85Appendices
Table 1A. Data and Sources
Country Code Sample Period Source
Austria AUT 1981:1~2011:4 OECD (1968:1~2012:1)
Belgium BEL 1981:1~2011:4 OECD (1980:1~2012:1)
Finland FIN 1981:1~2011:4 OECD (1970:1~2011:4)
France FRA 1981:1~2011:4 OECD (1968:1~2012:1)
Germany DEU 1981:1~2011:4 OECD (1970:1~2012:1)
Greece GRC 1981:1~2011:1 OECD (1970:1~2011:1)
Ireland IRL 1997:1~2011:4 OECD (1997:1~2011:4)
Italy ITA 1981:1~2011:4 OECD (1968:1~2012:1)
Luxembourg LUX 1995:1~2011:4 OECD (1995:1~2011:4)
Netherlands NLD 1981:1~2011:4 OECD (1977:1~2012:1)
Portugal PRT 1981:1~2011:4 OECD and BdP (1978:1~2012:1)
Spain ESP 1981:1~2011:4 OECD (1970:1~2012:1)
Euro area EMU12 1981:1~2011:4 OECD (1970:1~2012:1)
The main source is the OECD National Accounts Database. In the case of Portugal the data published by the OECD in the period 1995:1-2012:1 has been completed retrospectively with data from the Bank of Portugal (BoP), “Quarterly Series for the Portuguese Economy” in the Economic Bulletin , Summer of 2010.
jei
Trade Integration and Business Cycle Synchronization in the Euro Area: The Case of Southern European Countries
Figure 1A. Trade with the EMU
(% of total trade)
Southern Euro Area countries Other Euro Area countries
Figure 2A. Trade with the EMU
(% of GDP)
Southern Euro Area countries Other Euro Area countries
Figure 3A. Intra-EMU Trade ImBalances
(% of GDP)
jei
Vol.28 No.1, March 2013, 85~107 Sofia Gouveia and Leonida Correia http://dx.doi.org/10.11130/jei.2013.28.1.85Table 2A. SE4 Exports as a Share of Total Intra-EMU Exports for Southern European Countries (%) GREECE 1981~1989 1990~1998 1999~2007 2008~2011 ITALY 1981~1989 1990~1998 1999~2007 2008~2011 EMU12 51.8 51.6 36.7 34.2 EMU12 46.8 50.0 45.2 41.2 AUT 2.1 2.7 2.3 2.7 AUT 5.0 4.8 5.1 5.7 BEL 4.1 3.6 3.7 4.2 BEL 6.6 6.0 6.2 6.4 FIN 0.9 1.2 1.8 2.0 FIN 1.2 1.0 1.1 1.0 FRA 15.7 11.9 11.0 10.7 FRA 32.6 27.5 27.0 27.8 DEU 41.9 41.2 33.9 30.6 DEU 36.5 37.4 31.1 31.2 IRL 0.4 0.5 1.0 0.7 GRC 3.6 3.7 4.6 4.3 ITA 25.4 28.2 28.4 32.5 IRL 0.6 0.7 1.2 0.7 LUX - - 0.1 0.2 LUX - - 0.4 0.3 NLD 7.4 5.5 6.9 7.0 NLD 6.6 5.9 5.6 5.9 PRT 0.4 0.8 1.7 2.0 PRT 1.8 2.8 2.7 2.5 ESP 1.8 4.4 9.2 7.4 ESP 5.7 10.1 15.1 14.1 PORTUGAL 1981~1989 1990~1998 1999~2007 2008~2011 SPAIN 1981~1989 1990~1998 1999~2007 2008~2011 EMU12 51.8 64.7 65.3 62.4 EMU12 48.2 61.7 58.7 54.3 AUT 2.1 1.7 1.1 0.9 AUT 1.0 1.3 1.5 1.5 BEL 6.2 5.7 6.6 4.3 BEL 5.7 4.9 4.9 5.2 FIN 2.9 1.6 0.9 0.9 FIN 0.8 0.6 0.7 0.6 FRA 27.1 22.5 19.4 18.8 FRA 35.1 32.8 32.7 33.8 DEU 27.4 30.2 24.1 20.6 DEU 22.1 23.4 20.0 19.4 GRC 0.7 0.7 0.6 0.5 GRC 1.2 1.4 1.9 1.8 IRL 0.9 0.7 0.8 0.6 IRL 0.8 0.6 1.1 0.7 ITA 8.1 5.7 6.5 5.8 ITA 15.2 15.7 15.2 15.1 LUX - - 0.2 0.2 LUX - - 0.2 0.2 NLD 11.8 8.1 5.7 5.6 NLD 10.6 6.4 5.8 5.6 ESP 12.8 22.9 34.2 41.7 PRT 7.4 12.8 16.2 16.0
jei
Trade Integration and Business Cycle Synchronization in the Euro Area: The Case of Southern European Countries
Table 3A. SE4 Imports as a Share of Total Intra-EMU Imports for Southern European Countries (%) GREECE 1981~1989 1990~1998 1999~2007 2008~2011 ITALY 1981~1989 1990~1998 1999~2007 2008~2011 EMU12 51.1 57.1 48.6 43.3 EMU12 47.0 52.8 48.6 42.8 AUT 2.4 2.0 2.0 2.7 AUT 4.3 4.3 5.1 5.5 BEL 6.1 6.2 7.3 8.6 BEL 8.7 9.1 8.8 8.8 FIN 1.5 1.4 2.3 1.7 FIN 0.9 1.1 1.4 1.1 FRA 14.0 14.2 13.4 12.0 FRA 28.7 26.1 22.1 19.8 DEU 38.2 29.9 27.1 26.7 DEU 39.3 37.2 36.2 37.4 IRL 0.8 1.3 1.8 2.0 GRC 1.8 1.4 1.1 1.2 ITA 21.8 27.7 26.0 24.8 IRL 0.9 1.6 2.7 2.0 LUX - - 0.6 0.8 LUX - - 0.7 0.8 NLD 12.2 11.5 11.5 12.2 NLD 10.9 11.1 12.0 12.5 PRT 0.4 0.6 0.6 0.6 PRT 0.6 0.7 0.9 0.9 ESP 2.6 5.1 7.5 7.9 ESP 4.0 7.3 8.9 10.1 PORTUGAL 1981~1989 1990~1998 1999~2007 2008~2011 SPAIN 1981~1989 1990~1998 1999~2007 2008~2011 EMU12 46.7 66.1 67.2 66.6 EMU12 37.2 54.8 53.4 44.5 AUT 1.4 1.1 1.0 0.9 AUT 1.7 1.7 1.9 1.8 BEL 6.1 5.4 4.3 4.1 BEL 5.9 6.1 5.8 5.7 FIN 1.1 1.0 0.7 0.6 FIN 1.3 1.5 1.3 1.2 FRA 20.5 18.0 14.3 11.4 FRA 28.1 30.8 28.9 24.9 DEU 27.4 22.5 20.8 19.0 DEU 33.6 28.4 29.0 29.2 GRC 0.3 0.2 0.3 0.3 GRC 0.6 0.5 0.4 0.4 IRL 0.7 0.8 1.1 1.5 IRL 1.5 1.7 2.7 3.2 ITA 14.5 13.5 9.2 8.1 ITA 17.3 17.4 16.6 15.9 LUX - - 0.4 0.2 LUX - - 0.3 0.4 NLD 8.4 7.8 6.8 7.3 NLD 6.8 7.0 7.4 9.3 ESP 19.7 29.7 41.1 46.6 PRT 3.1 5.0 5.7 8.0
jei
Vol.28 No.1, March 2013, 85~107 Sofia Gouveia and Leonida Correia http://dx.doi.org/10.11130/jei.2013.28.1.85Figure 4A. Business Cycles of Euro Area Countries and EMU 12
jei
Trade Integration and Business Cycle Synchronization in the Euro Area: The Case of Southern European Countries
Table 4A. Correlations for Euro Area Countries
Whole period 1981:1~1998:4Pre - EMU 1999:1~2011:4Post - EMU
D N correlCont. correlMax. Lead/ lag CorrelCont. correlMax. Lead/ lag correlCont. correl Lead/ Max. lag ESP 124 0.73*** 0.73*** 0 0.61*** 0.65*** -1 0.90*** 0.90*** 0 (+) GRC 121 0.39*** 0.45*** 1 0.62*** 0.66*** 1 0.14 0.42*** 5 (-) ITA 124 0.90*** 0.90*** 0 0.89*** 0.89*** 0 0.93*** 0.93*** 0 (+) PRT 124 0.58*** 0.58*** 0 0.41*** 0.45*** 3 0.76*** 0.77*** -1 (+) Av. SE4 0.65 0.63 0.68 (+) AUT 124 0.59*** 0.59*** 0 0.30** -0.34*** -5 0.89*** 0.89*** 0 (+) BEL 124 0.89*** 0.89*** 0 0.87*** 0.87*** 0 0.91*** 0.91*** 0 (+) DEU 124 0.88*** 0.88*** 0 0.76*** 0.76*** 0 0.99*** 0.99*** 0 (+) FIN 124 0.58*** 0.59*** -1 0.30** 0.56*** -3 0.89*** 0.89*** 0 (+) FRA 124 0.82*** 0.82*** 0 0.73*** 0.73*** 0 0.94*** 0.94*** 0 (+) IRL 60 0.82*** 0.83*** -1 _ _ _ 0.84*** 0.86*** -1 _ LUX 68 0.79*** 0.86*** -1 _ _ _ 0.84*** 0.92*** -1 _ NLD 124 0.87*** 0.87*** 0 0.82*** 0.82*** 0 0.93*** 0.93*** 0 (+)
Av. Others 0.77 (a) 0.63 0.93 (b) (+)
(Note) *, **, and *** denote significance at the 10%, 5%, and 1% levels, respectively; (a)Average excluding
IRL and LUX; with these countries the figure is 0.78; (b)Average excluding IRL and LUX; with these countries
the figure is 0.90.
Table 5A. IV Estimates of the Effects of Trade Integration on Synchronisation, 1981~2007
Trade1 Trade2 Trade3 Trade4
BCS1 1.746 0.433** 0.290** 0.664
(1.63) (2.08) (2.35) (1.65)
BCS2 1.581* 0.391** 0.263** 0.601*
(1.70) (2.22) (2.51) (1.73)
(Note) *, **, and *** denote significance at the 10%, 5%, and 1% levels, respectively. Numbers in parenthesis represent t-statistics. Intercepts are not reported. The instrumental variable for trade intensity is the log of average distance. Annual trade data for 10 Euro area countries, from 1981 to 2007, split into three sub-periods. Sample size = 30. IV: Instrumental Variable