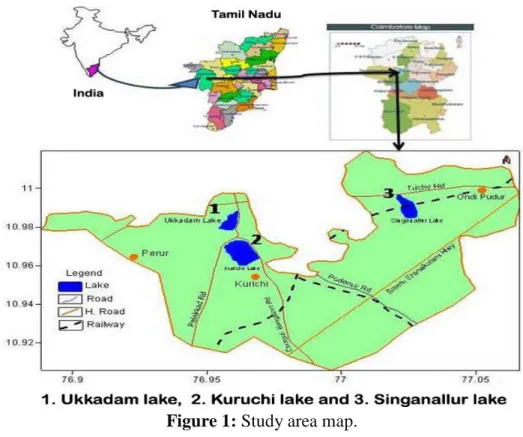
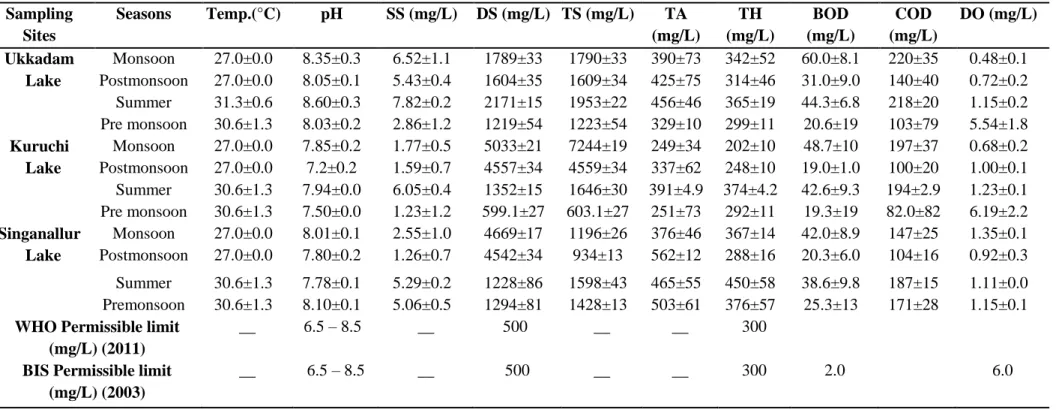
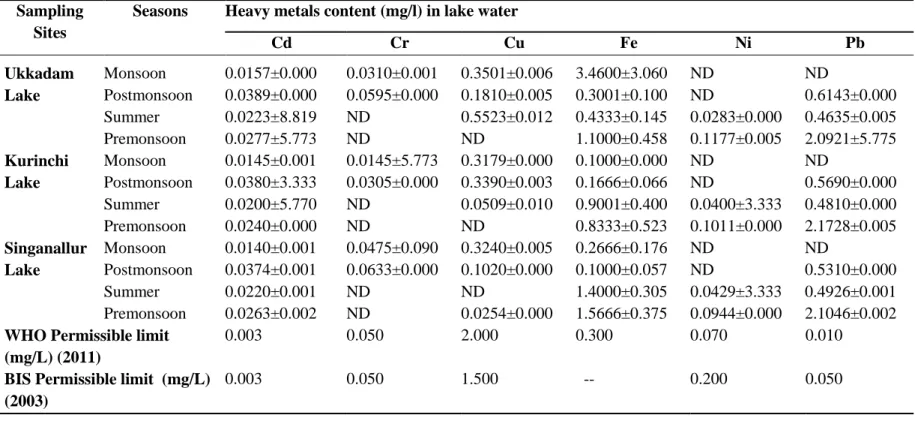
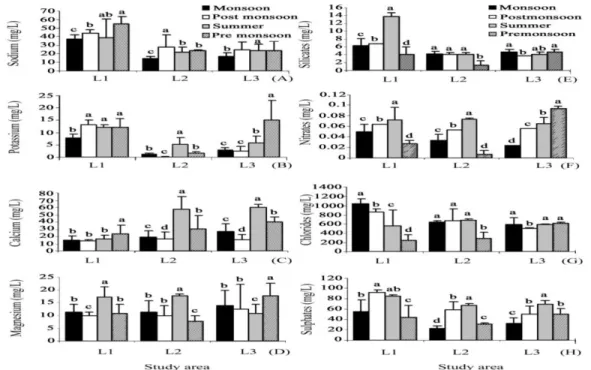
Assessment of physicochemical characteristics and the level of nutrient contents as well as heavy metal ions in waters of three lakes at Coimbatore, Tamil Nadu, India
Texto
Imagem
Documentos relacionados
É uma ramificação da ginástica que possui infinitas possibilidades de movimentos corporais combinados aos elementos de balé e dança teatral, realizados fluentemente em
The probability of attending school four our group of interest in this region increased by 6.5 percentage points after the expansion of the Bolsa Família program in 2007 and
This log must identify the roles of any sub-investigator and the person(s) who will be delegated other study- related tasks; such as CRF/EDC entry. Any changes to
Além disso, o Facebook também disponibiliza várias ferramentas exclusivas como a criação de eventos, de publici- dade, fornece aos seus utilizadores milhares de jogos que podem
É nesta mudança, abruptamente solicitada e muitas das vezes legislada, que nos vão impondo, neste contexto de sociedades sem emprego; a ordem para a flexibilização como
social assistance. The protection of jobs within some enterprises, cooperatives, forms of economical associations, constitute an efficient social policy, totally different from
Ousasse apontar algumas hipóteses para a solução desse problema público a partir do exposto dos autores usados como base para fundamentação teórica, da análise dos dados
The objective of this work was to study the effect of steel slag compared to limestone on soil chemical characteristics, biomass production and contents of nutrient and heavy metals
