Research Article
Multiyear Measurements of the Aerosol Absorption Coefficient
Near the Surface in a Small-Sized Urban Area in Portugal
Sérgio Nepomuceno Pereira,
1,2Frank Wagner,
1,3and Ana Maria Silva
1 1Evora Geophysics Centre (CGE), Rua Rom˜ao Ramalho 59, 7000 ´´ Evora, Portugal2Andalusian Institute for Earth System Research (IISTA-CEAMA), Avenida del Mediterr´aneo s/n, 18006 Granada, Spain 3Hohenpeißenberg Meteorological Observatory, Albin-Schwaiger-Weg 10, 82383 Hohenpeißenberg, Germany
Correspondence should be addressed to S´ergio Nepomuceno Pereira; [email protected] Received 12 September 2013; Accepted 19 December 2013; Published 3 February 2014
Academic Editor: Mrinal Biswas
Copyright © 2014 S´ergio Nepomuceno Pereira et al. This is an open access article distributed under the Creative Commons Attribution License, which permits unrestricted use, distribution, and reproduction in any medium, provided the original work is properly cited.
Measurements of the aerosol absorption coefficient, between 2007 and 2013, were made at the ground level in ´Evora, a Portuguese small town located in the southwestern Iberia Peninsula. Such a relatively long time series of absorbing aerosols is unique in Portugal
and uncommon elsewhere. The average aerosol absorption coefficient was close to 9 Mm−1and clear cycles at both daily and seasonal
time scales were found. An average increase by a factor of two (from 6 to 12 Mm−1) was observed in winter if compared to summer
season. The daily variations were similarly shaped for all seasons, with two morning and afternoon peaks, but with magnitudes modulated by the seasonal evolution. That was not the case if Sundays were considered. These variations can be explained in terms of the impact of local particle sources, related mainly to traffic and biomass burning and upward mixing of the aerosol due to variable mixing layer heights, either daily or seasonally. Also, a strong negative correlation between the aerosol absorption coefficient and the wind speed was verified, and an exponential decay function was found to fit very well to the data. The wind direction seems to be not correlated with the aerosol absorption coefficient.
1. Introduction
It is recognized that light absorbing aerosol particles influence directly the radiative balance and exert a net warming effect on the atmosphere [1–4]. Hence, they can eventually counter-balance the radiative cooling effect of the other aerosol types which are mostly light scatterers [5,6]. The radiative warming induced by absorbing particles can even be as important as the effect due to greenhouse gases [7,8]. However, the dis-crepancies between different scientific contributions in terms of quantifying their importance to the radiative forcing (e.g., [8,9]) keep the uncertainties high. The influence of absorbing particles seems to be more important at the regional than at the global scale [10]. Changes in the regional atmospheric stability due to atmospheric heating, in the presence of absorbing particles, can cause changes in the hydrological cycle [2,8,11].
Other effects, for example, observations of reduced albedo resulting from long-range transported particles into
Arctic areas, were reported by Stohl et al. [12]. Recently, it was estimated that absorbing particles may have contributed to more than half of the observed Arctic warming since 1890, most of this occurring during the last decades [13].
Additionally, these absorbing particles exert an indirect radiative effect due to their influence in modifying cloud properties [14,15]. Furthermore, their absorption of sunlight contributes to degraded visibility in polluted regions [16] and also to adverse effects on human health [17–19] as their size is mostly in the fine size range (e.g., [20,21]). They also have impact on atmospheric chemistry and photochemistry (e.g., [22]) and through absorption of solar radiation [23]. In urban areas, the absorption of radiation in the visible spectrum is dominated by black carbon (BC) [24,25], which is primarily introduced in the atmosphere as primary particles from combustion processes. Motor vehicles constitute the main source of black carbon in many European urban areas [26–29]; the emission levels of absorbing particles depend on multiple factors, for example, type of fuel and engine
Volume 2014, Article ID 830349, 8 pages http://dx.doi.org/10.1155/2014/830349
characteristics; for this reason its prediction is difficult and measurements must be carried out.
Globally, biomass burning, fuel burned for cooking and heating, on-road and off-road diesel engines and industrial activities of many kinds represent the largest contribution for the emitted BC mass. The difficulty in quantifying emissions from such diverse sources is a basic contribution to the uncertainty in evaluating BC’s climate role. Bond et al. [30] provide a large uncertainty range of 2000 to 29000 Ggy−1 for its global emissions which inevitably reflects in the large uncertainty bonds (90%) related to the recent estimates for the total climate forcing of BC.
The absorption coefficient of atmospheric particles is a fundamental optical parameter that needs to be known with good accuracy in order to improve our knowledge of the effects of aerosols on the climate. Models of radiative transfer require the amount of absorption (and scattering) by particles in the atmosphere. Therefore, long-term measurements of this aerosol optical property are important for improving our understanding of aerosol climatology and predictive modeling capabilities.
2. Measurements
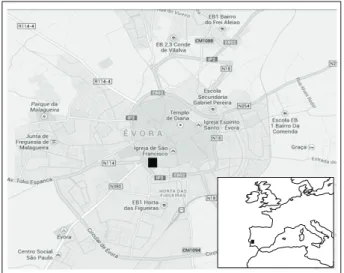
´Evora, Portugal (38.5 N, 7.9 W, 290 m a.s.l), is located in the southwestern region of the Iberian Peninsula as shown in
Figure 1. It is a Portuguese municipality with less than 60000 inhabitants. More than 40000 inhabitants reside in the urban area of the city itself, which is the biggest one within a vast rural and sparsely populated region. The distance from the capital, Lisbon, is some 130 km. The regional landscape is of low altitude (average height is below 250 m a.s.l.) and it consists primarily of wide plains. There are no significant polluting industries, neither in the city nor in the regional vicinity; for that reason the local regular production of absorbing particles should be to a large extent related to traffic circulation; during the colder periods of winter and fall wood burning is often used for domestic heating [31]. Regarding traffic circulation, the information obtained from the munic-ipality is sparse; nevertheless, it is possible to estimate the number of vehicles entering the city as being 12000–15000 day−1. The city spreads over a smooth prominence while its buildings are not elevated (mainly comprising one to three floors) thus allowing the city to be, in principle, well venti-lated.
The light absorption coefficient of aerosols,𝜎ap(𝜆) at the
wavelength 𝜆 = 670 nm, was measured with a Multiangle Absorption Photometer (MAAP 5012, Thermo ESM Ander-sen Instruments, Erlangen, Germany). Aerosol particles are deposited on a quartz fiber filter; a laser illuminates the filter matrix perpendicularly, and simultaneous measurements of radiation penetrating through the filter and scattered back at four detection angles are made. The determination of the aerosol absorption coefficient is made via radiative transfer calculations including the scattering effects from the filter matrix and the light scattering aerosol component. The scattering measurements allow the correction for multiple scattering processes involving the deposited particles and the
Figure 1: Map of the Iberian Peninsula showing ´Evora and map of ´Evora showing the location of ´Evora Geophysics Centre (CGE/black square) monitoring site within the city core as well as the main traffic roads.
filter matrix, which improves considerably the determination of aerosol absorption coefficient over other filter-based meth-ods, as demonstrated by comparison with a reference method [32,33]. The absolute measurement uncertainty of the MAAP has been estimated to be 12% [32, 34], while laboratory intercomparisons of multiple MAAP instruments suggested a unit-to-unit variability below 3% [35]. The aerosol was sampled at about 10 m above ground surface, at the ´Evora Geophysics Centre (CGE) facilities located within the urban centre of the city (Figure 1). The measurements span the period between April 2007 and April 2013. Measurements were taken every minute and further averaged to hourly values which were the basis for the data analysis, at different timescales, presented in the following sections.
Regarding the seasonal statistics the usual periods of winter (DJF), summer (JJA), spring (MAM), and fall (SON) were considered. Basic meteorological quantities were also recorded at the same site, namely, the wind speed and direction as well as the temperature in an hourly basis.
3. Results and Discussion
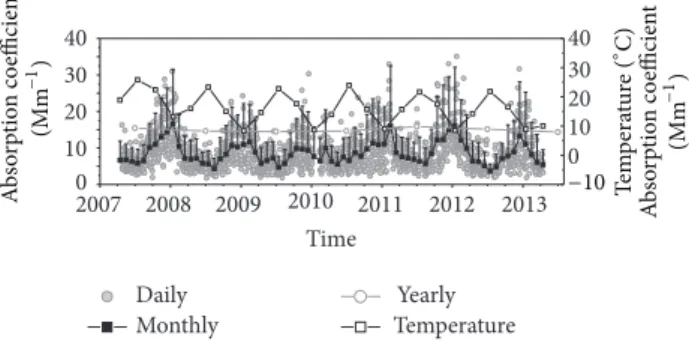
3.1. General Overview. The temporal evolution of the
absorp-tion coefficient, measured between April 2007 and April 2013, is presented in Figure 2; daily, monthly and yearly values are shown. The seasonal temperature is also depicted for the different seasons.Figure 3shows the frequency distribution of hourly values of the absorption coefficient, the frequency distribution of the wind direction, and the absorption coeffi-cient as function of both the wind speed and wind direction. The measurements show that𝜎ap(670) was most frequently
observed with magnitudes below 10 Mm−1(the third quartile is about this value), even if a few hourly values of𝜎ap(670)
as high as 120 Mm−1could be detected. Only 1% of the data were above 50 Mm−1. The mean absorption coefficient for the
2007 2008 2009 2010 2011 2012 2013 0 10 20 30 40 Daily Monthly Time 0 10 20 30 40 Yearly Temperature A b so rp tio n co efficien t (M m −1) A b so rp tio n co efficien t (M m −1) −10 Tem p era tu re ( ∘C)
Figure 2: Time series of the absorption coefficient (daily and monthly values in the left scale; yearly values in the right scale) and seasonal temperature measured in ´Evora between April 2007 and April 2013.
whole period was found to be8.7 ± 9.9 Mm−1, with a respec-tive median value of 6.2 Mm−1; the relatively high standard deviation originates from the hourly values which were used for the statistical computations. Mean values for different years were in the range of 8–10 Mm−1 and of 6-7 Mm−1 for the respective median values and no interannual trend is evident. The magnitudes of the absorbing coefficient reported here are comparable to the findings of Mogo et al. [36] for the absorption coefficient (at 660 nm) in a similar sized and populated small Portuguese town during a nine-month period (October 2009 to July 2010); in a city such as Granada, in the south of Spain and with a population one order of magnitude larger, the mean 𝜎ap(670), during two years of
measurements (December 2005 to November 2007), was reported to be 21 Mm−1 by Lyamani et al. [37]. However, in a background site, located in the Spanish Mediterranean Basin, the measured absorption coefficient was about three times lower (2.8 Mm−1 at 637 nm) [38]. Some examples of measurements performed in other parts of the world show the high variability that can be observed in areas of different human impact. Absorption measurements in large world urban areas can be one order of magnitude higher than the ones observed in this study [39–42]. In areas with low human impact the absorption coefficient can be several times lower or even one order of magnitude lower in the case of remote areas as in [43–45].
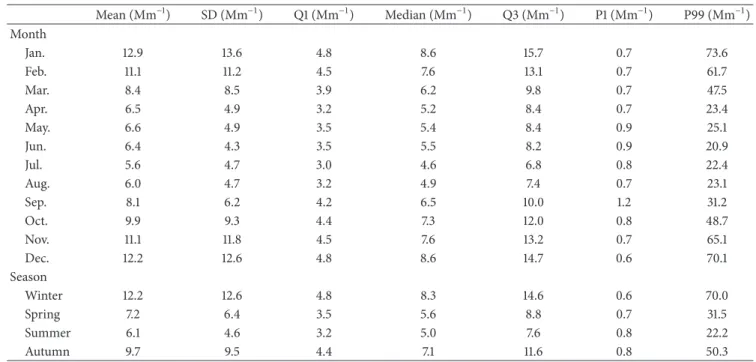
Also, asFigure 3shows, the distribution of the absorption coefficient is clearly asymmetric, right skewed, and it is well characterized by a lognormal curve (with modal value 6.6 Mm−1), which is often observed in diverse extensive aerosol properties [46–50]. The measured wind speed was moderate, as it rarely exceeded the 4 ms−1 (mean value of 2 ms−1); however, a significant influence in the magnitude of the absorption coefficient is clearly observed (Figure 3(c)). The strong negative correlation between wind speed and 𝜎ap(670) levels indicates the predominance of local particle
sources. Low wind speeds keep the pollution close to the source and hence local pollution levels rise while strong winds favor particle dispersion out of the source region which in turn leads to lower pollution levels close to the source. In
Section 3.2we show that the relation between the absorption
coefficient and the wind speed is very well accounted by an exponential decay pattern. The prevailing wind directions measured at the site (Figure 3(b)) are mainly westerly because of the dominant winds in the extra tropical northern latitudes where the Portuguese territory is located. As one could expect the wind direction seems not to be correlated with the aerosol absorption coefficient as one can observe between the wind speed and the aerosol absorption coefficient. This noncorrelation between wind direction and the absorption coefficient is the consequence of the predominance of local particle sources and of the location of CGE inside the ring road where significant traffic circulates.
3.2. Seasonal Variations. The temporal evolution of𝜎ap(670)
previously presented inFigure 2reveals a clear annual cycle; higher values and variability were observed during win-ter and autumn periods with the maximum values being attained, every year, during the winter months. This regu-larity is shown inFigure 4 where the monthly statistics of the absorption coefficient are considered. InTable 1several statistical parameters are presented in terms of monthly and seasonal timescales. The annual cycle should result from the combination of several factors, related both to particle production and meteorology. On the one hand, the additional input of soot during the colder period, due to domestic heating, is a main contribution as wood is often used as the main fuel. Additionally, we cannot discard the possibility of some increase in traffic during autumn/winter, due to worse weather conditions, contributing to the observed increase in 𝜎ap(670); although no trustworthy information on that issue
was available, the empirical observations suggest this fact. On the other hand, during the colder seasons the boundary layer height is generally smaller, with lower capacity for atmospheric dispersion, and temperature inversions are more frequent due mainly to the long wave radiative losses during the winter clear sky nights, typical in this region; hence, the concentrations of particles near the ground are expected to be higher. During the warmer periods the intense convective activity due to the solar heating of the ground surface induces the opposite effect. AsTable 1shows, the monthly absorption coefficient remains around 6 Mm−1(5 Mm−1if median values are considered) between April and August, and then it increases during September until maximum mean values, 12-13 Mm−1, are reached during the winter months (December to February). This variation represents a twofold increase if summer and winter, which are the most dissimilar seasons, are compared in terms of magnitudes of the absorption coefficient. The standard deviation increased even by a larger factor (Table 1). The upper quartile is also much higher during winter but not the lower quartile which is relatively constant throughout the year. In the following section it will be shown that this increased variability is mainly caused by the amplitude of the daily cycles observed in each season.
A clear negative correlation between local wind speed and absorption coefficient, already noticed inSection 3.1, was verified in all the seasons. The increase in wind speed causes an increase in ventilation; the dispersion of particles in the ambient air is enhanced and consequently causes a decrease
0 10 20 30 40 0.0 0.1 0.2 0.3 Lognormal fit Re la ti ve f req uen cy Absorption coefficient (Mm−1) R2=0.99 (a) 0 5 10 15 20 Median Mean Quartiles A b so rp tio n co efficien t (M m −1 ) 0-1 1-2 2-3 3-4 4-5 >5 Wind speed (ms−1) (b) 0.1 0.2 0.3 0 45 90 135 180 225 270 315 0.0 0.1 0.2 0.3 Re la ti ve f req uen cy (c) 0 5 10 15 20 0 45 90 135 180 90 225 270 315 5 10 15 20 A b so rp tio n co efficien t (M m −1 ) (d)
Figure 3: Relative frequency distributions of the hourly (a) absorption coefficient, with the respective lognormal fitting, and (b) wind direction. Absorption coefficient as function of (c) wind speed (including the quartiles) and (d) wind direction.
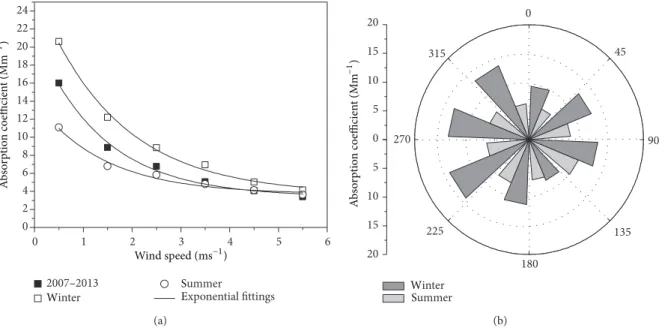
in the observed particle concentration and thus in the absorption coefficient. Exponential decay curve fittings apply very well to the observed dependency between𝜎ap(670) and
wind speed. These features are shown inFigure 5including the exponential fittings applied for the case of winter and summer and also for the whole data between 2007 and 2013 (see alsoTable 2). These types of curves were also used by Wang et al. [51] for absorbing particles. Such decreasing trends are an indication of the closeness of the air pollution sources which is the case of urban/suburban environments. It is worth mentioning the similarity of the year and seasonal decay constants (Table 2) and the fact that for high wind speeds the concentration of particles is almost independent of the season.
3.3. Diurnal Variation. The diurnal variation of the
absorp-tion coefficient is characterized by two distinct and promi-nent peaks, in the morning and in the afternoon, as shown inFigure 6. These sharp enhancements seem to be driven by vehicular emissions as they are coincident with the morning and afternoon traffic rush hours. This type of daily evolution is often found within urban areas (e.g., [37,52–56]). During the afternoon, the decrease in traffic circulation, before the following afternoon rush hour, and the typical daytime devel-opment of a convective boundary layer lead to a decrease in the 𝜎ap(670) levels. During the night period, traffic is
weakly present and thus the levels of suspended particles attain the minimum, which is perceptible inFigure 6. Also, the morning peak is lower than the late afternoon peak,
Table 1: Basic statistical properties of𝜎ap(670) organized for each month and season between 2007 and 2013. Q1 and Q3 indicate the quartiles;
P1 and P99 indicate the 1st and 99th percentiles.
Mean (Mm−1) SD (Mm−1) Q1 (Mm−1) Median (Mm−1) Q3 (Mm−1) P1 (Mm−1) P99 (Mm−1) Month Jan. 12.9 13.6 4.8 8.6 15.7 0.7 73.6 Feb. 11.1 11.2 4.5 7.6 13.1 0.7 61.7 Mar. 8.4 8.5 3.9 6.2 9.8 0.7 47.5 Apr. 6.5 4.9 3.2 5.2 8.4 0.7 23.4 May. 6.6 4.9 3.5 5.4 8.4 0.9 25.1 Jun. 6.4 4.3 3.5 5.5 8.2 0.9 20.9 Jul. 5.6 4.7 3.0 4.6 6.8 0.8 22.4 Aug. 6.0 4.7 3.2 4.9 7.4 0.7 23.1 Sep. 8.1 6.2 4.2 6.5 10.0 1.2 31.2 Oct. 9.9 9.3 4.4 7.3 12.0 0.8 48.7 Nov. 11.1 11.8 4.5 7.6 13.2 0.7 65.1 Dec. 12.2 12.6 4.8 8.6 14.7 0.6 70.1 Season Winter 12.2 12.6 4.8 8.3 14.6 0.6 70.0 Spring 7.2 6.4 3.5 5.6 8.8 0.7 31.5 Summer 6.1 4.6 3.2 5.0 7.6 0.8 22.2 Autumn 9.7 9.5 4.4 7.1 11.6 0.8 50.3 J F M A M J J A S O N D 0 10 20 30 40 P5/P95 Median Mean Quartiles A b so rp tio n co efficien t (M m −1 ) Month (2007–2013)
Figure 4: Basic statistics of the absorption coefficient measured between April 2007 and April 2013. Computations were based on the hourly values. The quartiles are depicted and P5 and P95 indicate the 5th and 95th percentiles.
and a higher rate of decrease in𝜎ap(670) is observed. This
is likely related to the afternoon rush hour being broader, temporally, and maybe also to the effect of the mixed layer during, afternoon in the dispersion of the pollutants, which is not the case later in the evening and in the nighttime periods. These features are common to all the working days (Monday to Friday). However, Saturday presents less prominent peaks, particularly in the morning, and during Sundays the morning
Table 2: Parameters (±standard errors) of the exponential fitting
(𝑦 = 𝑦0+ 𝑎 ∗ exp(𝑏𝑥)) between the wind speed and the absorption
coefficient for 2007–2013 and for winter and summer seasons.
𝑦0(Mm−1) 𝑎 (Mm−1) 𝑏 (m−1s) 𝑅2
2007–2013 3.4 ± 0.5 17.9 ± 0.9 −0.7 ± 0.1 0.99
Winter 3.7 ± 0.6 22.8 ± 0.9 −0.6 ± 0.1 0.99
Summer 3.7 ± 0.4 10.4 ± 0.8 −0.7 ± 0.1 0.98
peak in 𝜎ap(670) is virtually absent, corresponding to the
typical lack of activity and very low traffic levels in this period of the week.
The features above described apply regardless of the season, and they are visible in the “average” curve ofFigure 6
which considers all the measurement periods (2007–2013). However the magnitude and variability observed in the three curves (average and the seasonal values) of the absorption coefficient are significantly different if summer and winter seasons are compared (spring and autumn can be found in between). The daily evolution of𝜎ap(670) is similar in both
seasons but larger values of𝜎ap(670) are observed in winter
and the differences between maxima and minima are notice-ably larger during that season.
In winter the absorption coefficient can increase by a factor up to six, in the week days, between the early morning minima and the late afternoon maxima. During summer the variability is much lower as the differences observed between minima and maxima are related roughly by a factor of two.
Also, the abovementioned average difference between the first and the second peaks is in fact mainly accounted for by the winter data because during summer both peaks are fairly similar.
0 1 2 3 4 5 6 0 2 4 6 8 10 12 14 16 18 20 22 24 2007–2013 Winter Summer Exponential fittings A b so rp tio n co efficien t (M m −1 ) Wind speed (ms−1) (a) 0 5 10 15 20 0 45 90 135 180 225 270 315 5 10 15 20 Winter Summer A b so rp tio n co efficien t (M m −1) (b)
Figure 5: Dependence of the absorption coefficient on (a) the wind speed and (b) direction for summer and winter seasons.
0 10 20 30 2007–2013 Winter Summer
Day of the week
Saturday Sunday Monday Tuesday Wednesday Thursday Friday
A b so rp tio n co efficien t (M m −1)
Figure 6: Average daily variations of the absorption coefficient, measured between 2007 and 2013, throughout the days of a week. Winter and summer seasonal values are also shown individually.
These facts are consistent with the discussion previously presented in the context of the seasonal evolution of the absorption coefficient (seeSection 3.2), namely, on the addi-tional input of aerosols due to domestic heating during winter and the lower capacity of the atmosphere for dispersing the pollutants due to the temperature inversions.
4. Conclusions
Measurements of the absorption coefficient in the visible range (670 nm) made in a small Portuguese town, located in the southwestern Iberia Peninsula, are analyzed. The time series upon which this work is made is unique in Portugal as it spans over a relatively large period of time, between 2007 and 2013.
The average absorption coefficient, 𝜎ap(670), was 8.7 ±
9.9 Mm−1 with a lower median value of 6.2 Mm−1, as the
distribution of𝜎ap(670) was shaped log normally. Its temporal
variation was characterized by both clear seasonal and daily cycles. The seasonal cycle revealed that the highest and lowest values of𝜎ap(670) were observed in winter and summer
peri-ods, respectively. Thus, winter and summer were the most dis-similar seasons, while spring and autumn could be found in between; therefore, the analysis was more detailed in extract-ing the differences between summer and winter. An average increase by a factor of two in the absorption coefficient (from 6 to 12 Mm−1) was observed in winter if compared to summer season. This fact was attributed to the additional input of aerosols, particularly due to domestic heating, and also to the average atmospheric conditions, namely, the lower boundary layer height and frequent temperature inversions.
Concerning the daily variations, the influence of local activities in the absorbing particle levels, namely, due to traffic, was shown with morning and afternoon peaks being related to the traffic rush hours of the day; also, the reduction in human activities in Sunday mornings was particularly evident.
A strong dependence of the absorption coefficient on the wind speed was found and an exponential decay function fitted very well to the data. This indicates an increase in the atmospheric particle dispersion as the wind speed increases. In spite of some differences, the wind direction was less influent, likely because the sampling site is located within the city centre, inside the ring road, and hence traffic pollution is transported to the measurement site from all directions; thus, all the quadrants are able to influence the measurement site.
Conflict of Interests
The authors declare that there is no conflict of interests regarding the publication of this paper.
Acknowledgment
This work was supported by FCT (Fundac¸˜ao para a Ciˆencia e a Tecnologia) within the following Grants and Projects: SFRH/BD/29008/2006, SFRH/BPD/81132/2011, and PTDC/ CEO-MET/4222/2012.
References
[1] M. O. Andreae, “The dark side of aerosols,” Nature, vol. 409, no. 6821, pp. 671–672, 2001.
[2] V. Ramanathan, P. J. Crutzen, J. T. Kiehl, and D. Rosenfeld, “Atmosphere: aerosols, climate, and the hydrological cycle,”
Science, vol. 294, no. 5549, pp. 2119–2124, 2001.
[3] C. E. Chung, V. Ramanathan, D. Kim, and I. A. Podgorny, “Global anthropogenic aerosol direct forcing derived from satellite and ground-based observations,” Journal of Geophysical
Research: Atmospheres, vol. 110, no. 24, Article ID D24207, 2005.
[4] K. V. S. Badarinath and K. Madhavi Latha, “Direct radiative forcing from black carbon aerosols over urban environment,”
Advances in Space Research, vol. 37, no. 12, pp. 2183–2188, 2006.
[5] S. E. Schwartz, “The White house effect—shortwave radiative forcing of climate by anthropogenic aerosols: an overview,”
Journal of Aerosol Science, vol. 27, no. 3, pp. 359–382, 1996.
[6] J. M. Haywood and K. P. Shine, “Multi-spectral calculations of the direct radiative forcing of tropospheric sulphate and soot aerosols using a column model,” Quarterly Journal of the Royal
Meteorological Society, vol. 123, no. 543, pp. 1907–1930, 1997.
[7] M. Z. Jacobson, “Strong radiative heating due to the mixing state of black carbon in atmospheric aerosols,” Nature, vol. 409, no. 6821, pp. 695–697, 2001.
[8] V. Ramanathan and G. Carmichael, “Global and regional climate changes due to black carbon,” Nature Geoscience, vol. 1, no. 4, pp. 221–227, 2008.
[9] P. Foster, V. Ramaswamy, P. Artaxo et al., “Changes in atmo-spheric constituents and in radiative forcing,” in Climate Change
2007. the Physical Science Basis, Contribution of Working Group I to the Fourth Assessment Report of the Intergovernmental Panel on Climate Change, S. Solomon, D. Qin, M. Manning et al., Eds.,
Cambridge University Press, Cambridge, UK, 2007.
[10] C. Wang, “A modeling study on the climate impacts of black car-bon aerosols,” Journal of Geophysical Research D: Atmospheres, vol. 109, no. 3, Article ID D03106, 2004.
[11] S. Menon, J. Hansen, L. Nazarenko, and Y. Luo, “Climate effects of black carbon aerosols in China and India,” Science, vol. 297, no. 5590, pp. 2250–2253, 2002.
[12] A. Stohl, E. Andrews, J. F. Burkhart et al., “Pan-Arctic enhance-ments of light absorbing aerosol concentrations due to North American boreal forest fires during summer 2004,” Journal of
Geophysical Research D: Atmospheres, vol. 111, no. 22, Article ID
D22214, 2006.
[13] D. Shindell and G. Faluvegi, “Climate response to regional radiative forcing during the twentieth century,” Nature
Geo-science, vol. 2, no. 4, pp. 294–300, 2009.
[14] A. S. Ackerman, O. B. Toon, D. E. Stevens, A. J. Heymsfield, V. Ramanathan, and E. J. Welton, “Reduction of tropical cloudi-ness by soot,” Science, vol. 288, no. 5468, pp. 1042–1047, 2000. [15] Y. J. Kaufman, D. Tanr´e, and O. Boucher, “A satellite view of
aerosols in the climate system,” Nature, vol. 419, no. 6903, pp. 215–223, 2002.
[16] H. Horvath, “Estimation of the average visibility in central Europe,” Atmospheric Environment, vol. 29, no. 2, pp. 241–246, 1995.
[17] B. R. Gurjar, A. Jain, A. Sharma et al., “Human health risks in megacities due to air pollution,” Atmospheric Environment, vol. 44, no. 36, pp. 4606–4613, 2010.
[18] J. L¨ondahl, E. Swietlicki, E. Lindgren, and S. Loft, “Aerosol exposure versus aerosol cooling of climate: what is the optimal emission reduction strategy for human health?” Atmospheric
Chemistry and Physics, vol. 10, no. 19, pp. 9441–9449, 2010.
[19] H. J. Kim, X. D. Liu, T. Kobayashi et al., “Ultrafine carbon black particles inhibit human lung fibroblast-mediated collagen gel contraction,” American Journal of Respiratory Cell and
Molecular Biology, vol. 28, no. 1, pp. 111–121, 2003.
[20] J. H. Seinfeld and S. N. Pandis, Atmospheric Chemistry and
Physics: From Air Pollution to Climate Change, John Wiley &
Sons, New York, NY, USA, 1998.
[21] S. Ruellan and H. Cachier, “Characterisation of fresh particulate vehicular exhausts near a Paris high flow road,” Atmospheric
Environment, vol. 35, no. 2, pp. 453–468, 2001.
[22] W. Fendel, D. Matter, H. Burtscher, and A. Schmidt-Ott, “Inter-action between carbon or iron aerosol particles and ozone,”
Atmospheric Environment, vol. 29, no. 9, pp. 967–973, 1995.
[23] G. Li, R. Zhang, J. Fan, and X. Tie, “Impacts of black car-bon aerosol on photolysis and ozone,” Journal of Geophysical
Research: Atmospheres, vol. 110, no. 23, Article ID D23206, 2005.
[24] T. C. Bond and R. W. Bergstrom, “Light absorption by carbona-ceous particles: an investigative review,” Aerosol Science and
Technology, vol. 40, no. 1, pp. 27–67, 2006.
[25] H. Moosm¨uller, R. K. Chakrabarty, and W. P. Arnott, “Aerosol light absorption and its measurement: a review,” Journal of
Quantitative Spectroscopy and Radiative Transfer, vol. 110, no.
11, pp. 844–878, 2009.
[26] R. S. Hamilton and T. A. Mansfield, “Airborne particulate ele-mental carbon: its sources, transport and contribution to dark smoke and soiling,” Atmospheric Environment A, vol. 25, no. 3-4, pp. 715–723, 1991.
[27] A. Berner, S. Sidla, Z. Galambos et al., “Modal character of atmospheric black carbon size distributions,” Journal of
Geo-physical Research D: Atmospheres, vol. 101, no. 14, pp. 19559–
19565, 1996.
[28] T. A. Pakkanen, V.-M. Kerminen, C. H. Ojanen, R. E. Hillamo, P. Aarnio, and T. Koskentalo, “Atmospheric black carbon in Helsinki,” Atmospheric Environment, vol. 34, no. 9, pp. 1497– 1506, 2000.
[29] T. C. Bond, D. G. Streets, K. F. Yarber, S. M. Nelson, J.-H. Woo, and Z. Klimont, “A technology-based global inventory of black and organic carbon emissions from combustion,” Journal of
Geophysical Research D: Atmospheres, vol. 109, no. 14, Article ID
D14203, 2004.
[30] T. C. Bond, S. J. Doherty, D. W. Fahey et al., “Bounding the role of black carbon in the climate system: a scientific assessment,”
Journal of Geophysical Research: Atmospheres, vol. 118, pp. 5380–
5552, 2013.
[31] S. Pereira, F. Wagner, and A. M. Silva, “Long term black carbon measurements in the southwestern Iberia Peninsula,”
Atmospheric Environment, vol. 57, pp. 63–71, 2012.
[32] A. Petzold, H. Schloesser, P. J. Sheridan, W. P. Arnott, J. A. Ogren, and A. Virkkula, “Evaluation of multiangle absorption photometry for measuring aerosol light absorption,” Aerosol
[33] P. J. Sheridan, W. Patrick Arnott, J. A. Ogren et al., “The reno aerosol optics study: an evaluation of aerosol absorption mea-surement methods,” Aerosol Science and Technology, vol. 39, no. 1, pp. 1–16, 2005.
[34] A. Petzold and M. Sch¨onlinner, “Multi-angle absorption photometry—a new method for the measurement of aerosol light absorption and atmospheric black carbon,” Journal of
Aerosol Science, vol. 35, no. 4, pp. 421–441, 2004.
[35] T. M¨uller, J. S. Henzing, G. de Leeuw et al., “Characterization and intercomparison of aerosol absorption photometers: result of two intercomparison workshops,” Atmospheric Measurement
Techniques, vol. 4, no. 2, pp. 245–268, 2011.
[36] S. Mogo, V. E. Cachorro, A. de Frutos, and A. Rodrigues, “Absorption ˚angstr¨om exponents of aerosols and light absorb-ing carbon (lac) obtained from in situ data in Covilh˜a, central Portugal,” Journal of Environmental Monitoring, vol. 14, pp. 3174–3181, 2012.
[37] H. Lyamani, F. J. Olmo, and L. Alados-Arboledas, “Physical and optical properties of aerosols over an urban location in Spain: seasonal and diurnal variability,” Atmospheric Chemistry and
Physics, vol. 10, no. 1, pp. 239–254, 2010.
[38] M. Pandolfi, M. Cusack, A. Alastuey, and X. Querol, “Variability of aerosol optical properties in the Western Mediterranean Basin,” Atmospheric Chemistry and Physics, vol. 11, no. 15, pp. 8189–8203, 2011.
[39] S. Eidels-Dubovoi, “Aerosol impacts on visible light extinction in the atmosphere of Mexico City,” Science of the Total
Environ-ment, vol. 287, no. 3, pp. 213–220, 2002.
[40] X. He, C. C. Li, A. K. H. Lau et al., “An intensive study of aerosol optical properties in Beijing urban area,” Atmospheric Chemistry
and Physics, vol. 9, no. 22, pp. 8903–8915, 2009.
[41] G. Paredes-Miranda, W. P. Arnott, J. L. Jimenez, A. C. Aiken, J. S. Gaffney, and N. A. Marley, “Primary and secondary contribu-tions to aerosol light scattering and absorption in Mexico City during the MILAGRO 2006 campaign,” Atmospheric Chemistry
and Physics, vol. 9, no. 11, pp. 3721–3730, 2009.
[42] A.-P. Hyv¨arinen, H. Lihavainen, M. Komppula et al., “Aerosol measurements at the Gual Pahari EUCAARI station: prelim-inary results from in-situ measurements,” Atmospheric
Chem-istry and Physics, vol. 10, no. 15, pp. 7241–7252, 2010.
[43] D. J. Delene and J. A. Ogren, “Variability of aerosol optical properties at four North American surface monitoring sites,”
Journal of the Atmospheric Sciences, vol. 59, no. 6, pp. 1135–1150,
2002.
[44] C. Junker, S. G. Jennings, and H. Cachier, “Aerosol light absorp-tion in the North Atlantic: trends and seasonal characteristics during the period 1989 to 2003,” Atmospheric Chemistry and
Physics, vol. 6, no. 7, pp. 1913–1925, 2006.
[45] A. Virkkula, J. Backman, P. P. Aalto et al., “Seasonal cycle, size dependencies, and source analyses of aerosol optical properties at the SMEAR II measurement station in Hyyti¨al¨a, Finland,”
Atmospheric Chemistry and Physics, vol. 11, no. 9, pp. 4445–
4468, 2011.
[46] A. R. Deacon, R. G. Derwent, R. M. Harrison, D. R. Middleton, and S. Moorcroft, “Analysis and interpretation of measurements of suspended particulate matter at urban background sites in the United Kingdom,” Science of the Total Environment, vol. 203, no. 1, pp. 17–36, 1997.
[47] N. T. Oneill, A. Ignatov, B. N. Holben, and T. F. Eck, “The lognormal distribution as a reference for reporting aerosol opti-cal depth statistics; empiriopti-cal tests using multi-year, multi-site
AERONET sunphotometer data,” Geophysical Research Letters, vol. 27, no. 20, pp. 3333–3336, 2000.
[48] E. Gerasopoulos, M. O. Andreae, C. S. Zerefos et al., “Cli-matological aspects of aerosol optical properties in Northern Greece,” Atmospheric Chemistry and Physics, vol. 3, no. 6, pp. 2025–2041, 2003.
[49] S. Pereira, F. Wagner, and A. M. Silva, “Scattering properties and mass concentration of local and long-range transported aerosols over the South Western Iberia Peninsula,” Atmospheric
Environment, vol. 42, no. 33, pp. 7623–7631, 2008.
[50] M. A. Obreg´on, S. Pereira, F. Wagner, A. Serrano, M. L. Cancillo, and A. M. Silva, “Regional differences of column aerosol parameters in western Iberian Peninsula,” Atmospheric
Environ-ment, vol. 62, pp. 208–219, 2012.
[51] Y. Wang, P. K. Hopke, O. V. Rattigan, and Y. Zhu, “Characteri-zation of ambient black carbon and wood burning particles in two urban areas,” Journal of Environmental Monitoring, vol. 13, no. 7, pp. 1919–1926, 2011.
[52] M. A. Pohjola, A. Kousa, J. Kukkonen et al., “The spatial and temporal variation of measured urban PM10 and PM2. 5 in the Helsinki metropolitan area,” Water, Air, & Soil Pollution, vol. 2, pp. 189–201, 2002.
[53] S. Sharma, J. R. Brook, H. Cachier, J. Chow, A. Gaudenzi, and G. Lu, “Light absorption and thermal measurements of black carbon in different regions of Canada,” Journal of Geophysical
Research D: Atmospheres, vol. 107, no. 24, article 4771, 2002.
[54] K. Madhavi Latha and E. J. Highwood, “Studies on particulate matter (PM10) and its precursors over urban environment of Reading, UK,” Journal of Quantitative Spectroscopy and
Radia-tive Transfer, vol. 101, no. 2, pp. 367–379, 2006.
[55] K. K. Moorthy and S. S. Babu, “Aerosol black carbon over Bay of Bengal observed from an island location, Port Blair: tempo-ral features and long-range transport,” Journal of Geophysical
Research D: Atmospheres, vol. 111, no. 17, Article ID D17205,
2006.
[56] H. Lyamani, F. J. Olmo, and L. Alados-Arboledas, “Light scatter-ing and absorption properties of aerosol particles in the urban environment of Granada, Spain,” Atmospheric Environment, vol. 42, no. 11, pp. 2630–2642, 2008.
Submit your manuscripts at
http://www.hindawi.com
Hindawi Publishing Corporation
http://www.hindawi.com Volume 2014
Climatology
Journal ofEcology
Hindawi Publishing Corporation
http://www.hindawi.com Volume 2014
Earthquakes
Journal ofHindawi Publishing Corporation
http://www.hindawi.com Volume 2014
Hindawi Publishing Corporation http://www.hindawi.com
Applied &
Environmental
Soil Science
Volume 2014Mining
Hindawi Publishing Corporation
http://www.hindawi.com Volume 2014
Hindawi Publishing Corporation
http://www.hindawi.com Volume 2014 International Journal of
Geophysics
Oceanography
International Journal ofHindawi Publishing Corporation
http://www.hindawi.com Volume 2014
Journal of Computational Environmental Sciences
Hindawi Publishing Corporation
http://www.hindawi.com Volume 2014
Journal of
Petroleum Engineering
Hindawi Publishing Corporation
http://www.hindawi.com Volume 2014
Geochemistry
Hindawi Publishing Corporation
http://www.hindawi.com Volume 2014
Journal of
Atmospheric Sciences
International Journal of
Hindawi Publishing Corporation
http://www.hindawi.com Volume 2014
Oceanography
Hindawi Publishing Corporation
http://www.hindawi.com Volume 2014
Advances in
Hindawi Publishing Corporation
http://www.hindawi.com Volume 2014
Mineralogy
International Journal ofHindawi Publishing Corporation
http://www.hindawi.com Volume 2014
Meteorology
Advances inThe Scientific
World Journal
Hindawi Publishing Corporation
http://www.hindawi.com Volume 2014
Paleontology Journal Hindawi Publishing Corporation
http://www.hindawi.com Volume 2014
Scientifica
Hindawi Publishing Corporation
http://www.hindawi.com Volume 2014
Hindawi Publishing Corporation
http://www.hindawi.com Volume 2014 Geological ResearchJournal of
Hindawi Publishing Corporation
http://www.hindawi.com Volume 2014