Online learning occupancy grid maps for mobile robots
Hongjun Li *1, Miguel Barão1, 2, Luís Miguel Rato1
1Department of Informatics, University of Evora, Evora, 7004-516, Portugal 2Control of Dynamical Systems Group, INESC-ID, Lisboa, 1000-029, Portugal
Corresponding author: Hongjun Li: [email protected]
Abstract
Robot mapping is the basic work for robot navigation and path planning. Static map is also important to deal with dynamic environment. Occupancy grid maps are used to represent the environment. This paper focuses on the dependence between grid cells. We assume that if one point of the map is free, then the neighbors are likely to be free. This knowledge is encoded in a Markov random field (MRF) that is used as our prior belief about the world. Data from range sensors will then update our knowledge. By maximizing the posterior distribution of MRF model, a linear filter is generated. It can be used to filter the noise in observations or static maps. This linear filter can be implemented online. It is also additive if the sensor model is in the log odds form.
Keywords: MRF, occupancy grid maps, robot mapping
Introduction
Occupancy grid maps represent the environment as grid cells. They are convenient for
robot navigation and path planning and occupancy grid mapping (1) has been developed in robot
mapping problem by many researchers.
Normally the robot mapping and robot localization are considered at the same time in the simultaneous localization and mapping (SLAM) problem. In probabilistic form, the SLAM
problem requires the joint probability distribution of the map and robot pose. But the joint SLAM state may be factored into a localization problem and a conditional mapping problem (2). The robot mapping with known pose is a subtask in SLAM problem and can be considered individually.
In the earlier research, the expectation maximization (EM) algorithm is used to maximize the data likelihood (3). It calculates only a single map and the uncertainty is lost. Most of the last researches deal with the observations from the sensors directly to extract information for
dynamic environments. Bayesian occupancy filtering (BOF) (4) considers the sensor observation
history, in order to get robust perception in dynamic environments. Because of the noise of the sensor, the dependence between grid cells in occupancy grid maps should be considered.
Even thought the real world is dynamic, static map is also important. Normally the method dealing with the dynamic environments is based on the static map. Static occupancy grid maps and dynamic grid maps are maintained in parallel and the current dynamic map is based on the
previous dynamic map and the previous static map (5). The static map is also used to construct a
semi-static map (6). If the static map is very noisy, it will also influence the performances of the
dynamic mapping methods. Particle filter is applied widely in SLAM problem. A particle map is built for every particle. The particle maps may also be noisy (7).
In this paper range sensors are used to perceive the environment and a MRF model is applied to consider the dependence between grid cells in occupancy grid map. The linear filter is generated by maximizing the posterior distribution of the MRF model. It is an online, additive method and can be applied to deal with the noise in observations or static map. The rest of the paper is structured as follows. First we assume the grid cells are dependent and formulate the standard occupancy grid mapping in Section II. In Section III, based on the result of standard
occupancy grid mapping, the MRF model of the map is built. In Section IV, we describe how to generate the linear filter based on the MRF model. Finally, a small simulation is done for the linear filter in Section V.
Materials & Methods
A. The standard occupancy grid mapping
In this part, we do not consider the dependence between grid cells. We assume observations of grid cells are independent of each other and the current observation of the map is independent of the previous observations. In a grid map, each grid cell has two possible states: occupied and free. They are labelled as X 0, 1=
{ }
respectively. This work will build a grid map with range finders. The robot can only observe a small part of the map once. If the grid cell is inside the measurement range, we can know the probability. When the cell is outside the measurement range, the value should be 0.5. As time goes, the robot gets a lot of observations. Based on Bayes law, we obtain1: 1 1: ( | ) ( | ) ( | ) ( ) t t t t p z m p m z p m z p z -= , (1)
where m={m m0, 1, ,mn} is the set representing all the grid cells and 1:
1 2
{ , , }
t t
z = z z, z is the
set representing all the observations. ( | )p z m is the measurement probability, ( )t p z is the t
normalizer and p m z( | 1:t) is the probability distribution over the map, conditioned on all past
measurements zt. Since we have independence, we can do it for each cell individually.
1: 1 1: 1: 1 ( | ) ( | ) ( | ) ( | ) t t t i i i i i i t t i i p z m p m z p m z p z z -= , (2) where
1: 1 1: 1 ( | ) ( | ) ( | ) i t t t t i i i i i i m X p z z - p z m p m z -Î =
å
. (3)Normally, this expression can be formulated as
1: 1: 1
0
( | t) ( | t ) ( | )t ( )
i i i i i i i
l m z =l m z - +l m z +l m , (4)
where l is the log odds representation, such as () 0( ) log ( )
1 ( ) i i i p m l m p m =
- is the log odds form of
the initial belief of m . (i | )t i i
l m z is the log odds form of the inverse sensor model ( | )t i i
p m z . The
log odds form not only avoids truncation problems that arise for probabilities close to 0 or 1, but also is additive (8). If ( )p m is 0.5, i l m0( ) 0i = . Equation (4) can be formulated as
1: 1: 1
( | t) ( | t ) ( | )t
i i i i i i
l m z =l m z - +l m z . (5)
B. The MRF model
In this part, we start to consider the dependence between grid cells. The map is regarded
as a two dimension MRF. The random variables denoted by ( )l m are the log odds forms of the i
occupancy probabilities. The current observation of ( )l m is (i | )t i i l m z .
The MRF can be factorized according to the cliques. A clique c is defined as a subset of
grid cells. Second-order neighborhood system shown as Fig. 1 is considered in this paper. There
are eight neighbors for every grid cells and the clique consists of a single-site and a pair of neighboring sites as shown in Fig. 2. Since single-site cliques are not useful in this task, they are not considered. The collection of pair-site cliques is denoted by C . The prior probability (2 9) is represented as equation (6).
Figure 1. Second-order neighborhood system
Figure 2. Cliques in second-order neighborhood system
1 ( ) 1 ( ) e TU m p m f -= , (6) where 1 ( ) e TU m m M f -Î =
å
(7) is the partition function, M represents all the configuration and T is a constant called the temperature, which shall be assumed to be 1. The prior energy function U m is a sum of ( ) clique potentials ( )V m over all possible cliques c C and formulated as 22 ( ) c( ) c C U m V m Î =
å
. (8) The clique potential is based on the log odds form and defined to be2 '
( ) ( ( ) ( ))
c i i
V m = l m -l m , (9) where m is the neighbor of i' m . i
1: 1:
1 1
{..., ( | t), ( | t),...}
i i i i
Z = l m- z- l m z contains the information of all the past observations of the map. The likelihood in MRF model can be formulated as
( | ) 2 1 ( | ) e 2 U Z m i i p Z m ps -= Õ , (10) where 1: 2 2 ( | ) ( ( ) ( | t)) / 2 i i i i i U Z m =
å
l m -l m z s . (11) Based on Bayes rule, the posterior distribution is formulated as( ) 2 1 1 ( | ) ( | ) ( ) e 2 E m i i p m Z p Z m p m f h h ps -= = Õ , (12)
where h is a constant and the posterior energy
' 1: 2 2 2 ' ( ) ( ( ) ( | t)) / 2 + ( ( ) ( i )) i i i i i i i i E m =
å
l m -l m z såå
l m -l m (13) is the sum of likelihood energy U Z m and prior energy ( )( | ) U m . If the noise distribution ishomogeneous, the deviations s are the same as i s for all grid cells. C. Mapping based on the MRF model
The problem can be solved by maximizing the posterior distribution or equivalently minimizing the posterior energy. The derivatives of E m with respect to ( )( ) l mi are
' ' 2 1: 2 2 ' 1: 2 2 ' d( ( ) ( )) d( ( ) ( | )) d ( ) 1 +2 d ( ) 2 d ( ) d ( ) 1 1 ( 4 ) ( ) 4 ( ) ( | ) i i t i i i i i i i i t n i i i i l m l m l m l m z E m l m l m l m n l m l m l m z s s s -= = + -
-å
å
, (14)where n is the number of considered neighbors. Let the derivatives n d ( ) 0
d ( )i
E m
l m = , a linear
T 1: 1: T 1 1 1 [..., ( ), ( ),...] [..., ( | t), ( | t),...] i i i i i i A l m- l m = l m- z- l m z . (15)
The size of A depends on the size of the map. When a robot walks in unknown environment,
the robot does not know where it is and where the borders are. Here we assume the map is very
big without borders. This means every grid cell has enough neighbors. A is a circulant matrix
and it is nonsingular. The mapping problem can be solved as
T 1 1: 1: T
1 1 1
[..., ( ), ( ),...] [..., ( | t), ( | t),...]
t i t i i i i i
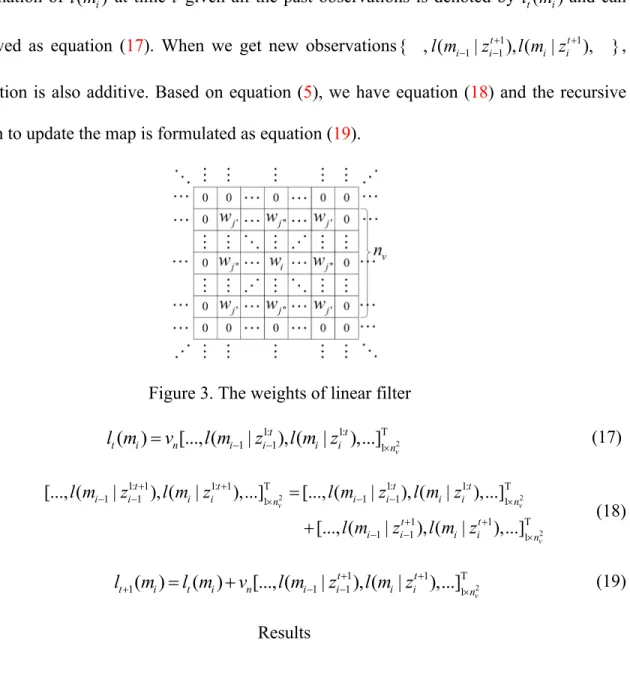
l m- l m =A- l m- z- l m z , (16) where A-1 is also a circulant matrix. This method can be regarded as a linear filter. The
elements in one row are the weights for all the observations. The weights are reshaped and
shown in the map as Fig. 3. Because the neighborhood is isotropy, the weights are also isotropy.
Another property is that the sum of the weights in one row is 1. The neighborhood in this paper
is very small, the weights for the observations that are enough faraway will be zeros. Only 2
v
n
weights need to be considered. If a vector v containing these n 2
v
n weights in A-1 can be obtain
by other way, we can obtain the same map. In order to do so, another circulant matrix A'
should be constructed. A' must satisfy the constraint that the middle row could be reshaped as
2 2 2 2 2 2 2 2 2 0 0 0 0 0 0 4 4 4 0 0 4 1 4 4 0 0 4 4 4 0 0 0 0 0 0 v v n n n n s s s s s s s s s ´ é ù ê ú ê ú ê - - - ú ê - + - ú ê ú ê - - - ú ê ú ê ú ê ú ë û .
The middle row in A'-1 is
n
v . The centre weight in v is for the observation of n m , the other i
weights are for the corresponding observations of its neighbors. When a new observation of a
grid cell is obtained, only 2
v
n grid cells, which consist of itself and its 2 1
v
be updated. In other words, when a grid cell needs to be updated, 2
v
n observations are needed.
The estimation of ( )l m at time t given all the past observations is denoted by ( )i l m and can t i
be achieved as equation (17). When we get new observations 1 1
1 1
{ , ( | t ), ( | t ), }
i i i i l m z+ l m z+
- - ,
this equation is also additive. Based on equation (5), we have equation (18) and the recursive
algorithm to update the map is formulated as equation (19).
Figure 3. The weights of linear filter
2 1: 1: T 1 1 1 ( ) [..., ( | ), ( | ),...] v t t t i n i i i i n l m =v l m- z- l m z ´ (17) 2 2 2 1: 1 1: 1 T 1: 1: T 1 1 1 1 1 1 1 1 T 1 1 1 [..., ( | ), ( | ),...] [..., ( | ), ( | ),...] [..., ( | ), ( | ),...] v v v t t t t i i i i n i i i i n t t i i i i n l m z l m z l m z l m z l m z l m z + + - - ´ - - ´ + + - - ´ = + (18) 2 1 1 T 1( ) ( ) [..., ( 1| 1), ( | ),...]1 v t t t i t i n i i i i n l+ m =l m +v l m- z-+ l m z + ´ (19) Results
Before simulation or experiments, the number of the neighbors in MRF model is fixed.
The weight vector v does not change any more. It can be processed ahead. In order to make n
sure that the weights are symmetric, n should be odd. In this paper, second-order v
constructed matrix A' is [-1, -1, -1, -1, 9, -1, -1, -1, -1] and the weights vector v =[ 0.1, 0.1, n
0.1, 0.1, 0.2, 0.1, 0.1, 0.1, 0.1] can be reshaped as 0.1 0.1 0.1 0.1 0.12 0.1 0.1 0.1 0.1 é ù ê ú ê ú ê ú ë û .
When n becomes 5, the middle row in the constructed matrixv A' is [ 0, 0, 0, 0, 0, 0, 1, 1, -1, 0, 0, --1, 9, --1, 0, 0, --1, --1, --1, 0, 0, 0, 0, 0, 0] and v can be reshaped as n
0.028 0.030 0.032 0.030 0.028 0.030 0.044 0.048 0.044 0.030 0.032 0.048 0.152 0.048 0.032 0.030 0.044 0.048 0.044 0.030 0.028 0.030 0.032 0.030 0.028 é ù ê ú ê ú ê ú ê ú ê ú ê ú ë û .
The added weights are about 0.03 and it is not important to consider them. n is chosen as 3. v
The true map is shown as Fig. 4(a). It simulates a corridor with an open door. The robot
runs from the left side to the right side, the trajectory is shown as Fig. 4(b). At a position, there are four measurement directions: ±p / 2 and ±p / 4. They are relative to the robot direction.
(a) (b) Figure 4. The true map and the trajectory of the robot
The robot equips a laser sensor. The beam of the laser sensor has the same width with the grid cell and maximum range is 9 grid cells. Following along a line in the measurement direction, the observations of the cells are log 2(0.1/ 0.9)= -3.17, at least until the measured distance. At the distance, the observation of the cell is log 2(0.9 / 0.1) 3.17= . Because of the noise of the sensor, the measured distance may be different from the true distance.
The result of the standard occupancy mapping is shown as Fig. 5(a). It is a noisy map.
After applying the linear filter, the result is shown as Fig. 5(b). The noise in the vacant region is filtered out and the map becomes smoother.
(a) (b)
Figure 5. The result of the standard occupancy mapping and the result of the linear filter
Discussion
In this paper, we presented a linear filter to deal with the noise in observations or static map by applying the MRF model. It is very simply to be implemented. It can be applied in the algorithms for robot mapping problem, no matter these algorithms are proposed for static environment or dynamic environment. In future work, we will explore the dynamic environment based on this work.
Acknowledgments
This work was supported by EACEA under the Erasmus Mundus Action 2, Strand 1 project LEADER - Links in Europe and Asia for engineering, eDucation, Enterprise and Research exchanges.
References
(1) Elfes A (1989) Using occupancy grids for mobile robot perception and navigation.
Computer 22:46-57.
(2) Durrant-Whyte H, Bailey T (2006) Simultaneous localization and mapping: part I. IEEE
robotics & automation magazine 13:99-110.
(3) Thrun S (2001) Learning occupancy grids with forward models in Proceedings of the
IEEE/RSJ International Conference on Intelligent Robots and Systems. (IEEE), Vol. 3, pp.
1676–1681.
(4) Coue C, Pradalier C, Laugier C, Fraichard T, Bessiere P (2006) Bayesian occupancy
filtering for multitarget tracking: an automotive application. The International Journal of
Robotics Research 25:19–30.
(5) Wolf DF, Sukhatme GS (2003) Towards mapping dynamic environments in Proceedings
of the International Conference on Advanced Robotic. pp. 594–600.
(6) Meyer-Delius D, Hess J, Grisetti G, Burgard W (2010) Temporary maps for robust
localization in semi-static environments in Proceedings of the IEEE/RSJ International
(7) Tanzmeister G, Thomas J, Wollherr D, Buss M (2014) Grid-based mapping and tracking
in dynamic environments using a uniform evidential environment representation in Proceedings
of the IEEE International Conference on Robotics and Automation. (IEEE), pp. 6090–6095.
(8) Thrun S, Burgard W, Fox D (2005) Probabilistic robotics. MIT press.
(9) Li SZ (2009) Markov random field modeling in image analysis. Springer Science &
Business Media.
About the authors:
Hongjun Li received his B.Sc. degree in Communication Engineering and M.Sc. degree in Control Engineering from Zhongyuan University of Technology, Zhengzhou, China, in 2012 and 2015. He is currently completing a Ph.D. in Computer Science at University of Evora. His research interests include networked control systems and mobile robots.
Miguel Barão received the Electrical Engineering, M.Sc., and Ph.D. degrees from the Instituto Superior Técnico, Technical University of Lisbon, Lisbon, Portugal, in 1996, 2000, and 2008, respectively. He is currently an Assistant Professor with the Department of Informatics, Universidade de Évora, Évora, Portugal, and a Researcher with the Control of Dynamical Systems Group, Instituto de Engen-haria de Sistemas e Computadores-Investigação e Desenvolvimento, Lisbon. His current research interests include nonlinear and distributed control theory, information geometry, and problems at the intersection of these areas. He has been responsible or participated in several research projects on control of solar collector fields, HIV1, automotive control, video surveillance, and probabilistic geometric control. He has authored or co-author several journal and conference papers in control.
Luís Miguel Rato is Assistant Professor of Computer science Department, University of Évora. He has obtained his PhD degree in Electrical and Computer Engineering in 2002, from the Lisbon Technical University. Currently he is a pro-rector for the area of information systems at University of Évora and director of the PhD Program in Computer Science. His main areas of research involve image processing and classification, data mining, and control systems. He has been actively involved in several research projects, including national and regional programs. He is a member of LISP (Laboratório de Informática Sistemas e Paralelismo) University of Évora research center.