28 Transportation Research Record: Journal of the Transportation Research Board, No. 2402, Transportation Research Board of the National Academies, Washington, D.C., 2014, pp. 28–37.
DOI: 10.3141/2402-04
A “turboroundabout” is a variation of the conventional multilane round-about in which spiral road markings and raised lane dividers force driv-ers to follow a specific path according to their intended destination. This geometry eliminates weaving and cut-in conflicts by guiding drivers con-tinuously from entry to exit. Turboroundabouts were conceived with the main aim of improving safety, but their practical benefits are relatively unknown. Likewise, the few existing studies on turboroundabouts do not allow definitive conclusions to be drawn about the delay and emissions performance characteristics of turboroundabouts; further research is needed. This research focused on the use of appropriate modeling meth-odologies to understand the effects of turboroundabouts on capacity, safety, and emissions in comparison with the effects of conventional single-lane and double-single-lane roundabouts. The results indicate that turboround-abouts have capacity levels comparable to those of two-lane roundturboround-abouts but are less robust concerning the directional split of the entry traffic; turboroundabouts lead to fewer traffic conflicts, but the traffic con-flicts that do occur are more severe. The results also show that the imple-mentation of turboroundabouts provides no advantages for emissions when the main concerns are carbon dioxide and oxides of nitrogen.
A “turboroundabout” is a variation of the conventional multilane roundabout in which drivers are forced to follow a specific path according to their intended destination. The carriageway consists of continuous spiral paths, and curbs are used to separate lanes in the entry, circulatory, and exit zones. The installation of curb dividers has two major benefits: the elimination of conflict points caused by weaving maneuvers and speed reduction because of increased deflection (1). On the negative side, raised curbs make snow removal difficult and may be a risk for motorcyclists (2). The first turboround-abouts were installed in 2000 in the Netherlands. Since then, more than 190 turboroundabouts have been implemented, and the Dutch government no longer constructs multilane conventional roundabouts, having adopted turboroundabouts as the current practice (1). This adoption of turboroundabouts was followed by their adoption in
Poland and, most recently, in Germany, Finland, Norway, and Slovenia (3). Interest in this new layout is also growing in the United States (4).
Turboroundabouts are usually compared with conventional single-lane and two-single-lane roundabouts at two levels: capacity or delays and safety. A consensus on the results for capacity does not exist. Initial research based on simplified approaches concluded that, in general, turboroundabouts offer a higher capacity than conventional round-abouts of similar size (5, 6). More recent work indicates that the relative performance of turboroundabouts is highly dependent on the demand flows at the major and minor entries (7). A new lane-based capacity method allows quantification of the importance of the directional split at each entry and reveals that only in very specific demand scenarios that are uncommon in real-world networks can a standard turboroundabout be expected to provide more capacity than an equivalent two-lane roundabout (8). This larger capacity happens namely when the proportion of drivers at each entry turning right is abnormally high (usually above 60%).
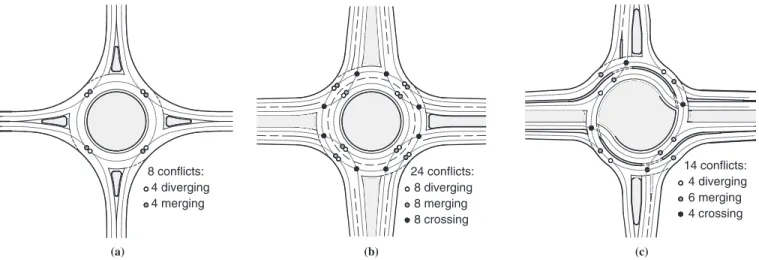
Researchers have reached greater consensus on the safety benefits of turboroundabouts, despite the lack of quantitative crash data. From a set of before-and-after studies in the Netherlands, Fortuijn concluded that “the measured effect of turboroundabouts on safety is comparable with that of single-lane roundabouts” (1). A study from Mauro and Cattani based on conflict analysis techniques showed a 40% to 50% reduction in the accident rate for turboroundabouts relative to that for two-lane roundabouts (9). Comparison of the number of conflict points—eight in a single-lane roundabout, 24 in a two-lane round-about, and 14 in a turboroundabout (Figure 1)—also suggests the improved safety of turboroundabouts compared with that of the two-lane roundabout layout.
The safety performance of a roundabout can be related to some measure of its operating speeds (10, 11). In addition to a reduction in the number of conflict points (relative to that in the two-lane roundabout), the turboroundabout design also leads to lower entry and circulating speeds. While drivers can ignore lane markings on a two-lane roundabout and choose an almost direct path while retain-ing their approach speed, on a turboroundabout, raised splitters force drivers to stay in the correct lane and thus follow paths with smaller radii at lower speeds.
The effect of turboroundabouts on pollutant emissions is also unknown. Research in that field has focused on the emissions impacts of single-lane and multilane roundabouts (12–14). One concern about emissions in turboroundabouts is the extent to which a vehicle’s speed and acceleration–deceleration patterns vary, since drivers are forced to follow a specific path according to their intended L. Vasconcelos, Department of Civil Engineering, Polytechnic Institute of Viseu,
Campus Politécnico de Repeses, 3504-510 Viseu, Portugal. A. B. Silva and Á. M. Seco, Department of Civil Engineering, University of Coimbra, Rua Luís Reis Santos-Pólo II, 3030-788 Coimbra, Portugal. P. Fernandes and M. C. Coelho, Department of Mechanical Engineering–Center for Mechanical Technology and Automation, University of Aveiro, Campus Universitário de Santiago, 3810-193 Aveiro, Portugal. Corresponding author: L. Vasconcelos, vasconcelos@estv.ipv.pt.
destination. Such speed variations could have a significant impact on emissions and reduce the potential emissions benefits of the turboroundabout.
From the points presented above, it becomes clear that few studies of turboroundabouts have been conducted and that most studies that have been performed lack solid data from the field and follow different methodologies that in some cases lead to contradictory conclusions. In the absence of crash statistics and emissions data, a deeper analysis is needed. Recent developments in the field of microscopic simulation for safety and emissions analysis suggest that microscopic simulation tools can be successfully used in addition to the classic methods of evaluation of traffic operation and manage-ment strategies to evaluate the safety levels, capacity, and emissions of existing and new road infrastructure.
Therefore, the motivation for this research was to use the most appropriate microscopic modeling methodologies to understand the capacity and safety of turboroundabouts and determine emissions from turboroundabouts and then to compare this information with that for conventional single-lane and double-lane roundabouts. The hypoth-esis is that different patterns of circulating traffic, capacity flows, and lane selection have different effects on emissions and conflict points and, thus, in the relative performance of turboroundabouts. In sum-mary, the objectives of this research were (a) to evaluate capacity and delays, (b) to assess conflict locations and rates of occurrence of con-flicts, (c) to quantify the emissions impacts of turboroundabout opera-tions, and (d) to explore the differences between turboroundabouts and conventional single-lane and two-lane roundabouts.
MEthodology
Basic Methodological Approach
The multicriterion assessment described here is based on the use of microsimulation to describe the functioning of alternative, single-lane, two-lane, and turboroundabouts under a number of demand scenarios chosen to represent a wide range of possible real-life situations. An existing single-lane roundabout is taken as a reference problem.
The AIMSUN traffic simulator software package was selected to develop the microsimulation models (15). It provides default simu-lation outputs that allow the conventional assessment of different
layouts for capacity and delays. AIMSUN also allows the export of full disaggregated trajectory files that can be used by external applications to assess environmental and safety impacts, as described below.
Capacity and delays
Travel times and delays are considered major performance measures for transportation systems (16). Each layout affects travel times at two levels: through the imposition of different negotiation speeds under free-flow conditions and, mostly, through the provision of dif-ferent geometric and operational capacity levels. Two measures of performance were initially considered: the average travel time for the whole simulation period and travel time reliability. Some preliminary tests indicated that the variability of travel times is almost independent of the layout, so only the average travel time between origin and destination centroids was considered to measure the operational performance of each alternative.
Safety
The core of this new safety assessment approach is software devel-oped by FHWA [surrogate safety assessment model (SSAM)] (17) that automates conflict analysis by processing vehicle trajectory files produced during the simulation (the vehicle’s position, speed, and acceleration profiles). This approach has all the generic advantages of simulation (the ability to assess the safety of new facilities before the occurrence of accidents, the ability to create a controlled testing envi-ronment, etc.) but also has some limitations: common microscopic simulation models are developed for traffic-flow analyses and lack some features that are essential for safety analyses (e.g., the ability to analyze overtaking with opposing flow, lateral movement, and U-turns at intersections). Some authors proposed specific procedures to calibrate simulation models for safety assessment (18, 19), but this field of research remains ongoing. The relationship between simulated conflicts and accidents is also not well established. Al-Ghandour et al. found a statically significant relationship between SSAM-predicted conflicts and crashes (predicted by analytic regression methods) but recognized the need for additional studies involving the comparison of SSAM outputs with real crash data (20).
8 conflicts: 4 diverging 4 merging 24 conflicts: 8 diverging 8 merging 8 crossing 14 conflicts: 4 diverging 6 merging 4 crossing (a) (b) (c)
follows (21):
• “TTC” is the minimum TTC value observed during the inter-action of two vehicles on a collision route. If at any time step the TTC drops below a given threshold [1.5 s in this work, as previ-ously suggested for urban areas (22)], the interaction is tagged a conflict.
• “DeltaS” is the difference in vehicle speeds observed at the instant of the minimum TTC. More precisely, this value is mathemati-cally defined as the norm of the velocity vectors of the two vehicles and thus accounts for the differences in both the absolute speeds and the headings of the vehicles. Further details about alternative surrogate measures can be found elsewhere (23, 24).
Emissions
To estimate vehicle emissions, the vehicle-specific power (VSP) methodology was used (25, 26). This microscopic emissions model-ing methodology was chosen because it allows the instantaneous estimation of emissions on the basis of second-by-second vehicle dynamics (speed, acceleration, and slope) and thus takes as input data from the same trajectory files given by AIMSUN (which are also required by the SSAM module). The VSP values are catego-rized into 14 modes of the engine regime and an emissions factor for each mode is used to estimate emissions of carbon dioxide (CO2), carbon monoxide (CO), oxides of nitrogen (NOx), and hydrocarbon (HC) from duty gasoline vehicles (engine size <1.4 L), light-duty diesel vehicles (engine size <1.9 L), and light commercial vehicles (engine size <2.5 L). Because of its direct physical inter-pretation and a strong statistical correlation with vehicle emissions, VSP has proved useful for estimation of microscale emissions for both gasoline vehicles (25, 26) and diesel vehicles (27). Some previ-ous studies have documented the effective use of VSP for analysis of the emissions impacts of single-lane and multilane roundabouts in urban corridors (12–14).
Equation 1 provides the VSP calculation for both light-duty and commercial vehicles (15):
i i i
i
v a
v
VSP 1.1 9.81 sin arctan grade 0.132
0.000302 3 (1)
[
(
(
)
)
]
= + +
+ where
VSP = vehicle-specific power (kW/ton), v= instantaneous speed (m/s),
a= instantaneous acceleration or deceleration (m/s2), and grade = terrain gradient (decimal fraction).
Total emissions for passenger cars were calculated by use of the assumption that all passenger cars consisted of 45% light-duty gasoline vehicles, 34% light-duty diesel vehicles, and 21% light commercial vehicles (28). Because of the flat terrain, the effect of
Site Selection
In Portugal, the first turboroundabout is expected to be constructed in Coimbra, to replace the existing single-lane Choupal Roundabout (inscribed circle diameter = 57 m, circulating lane width = 7.8 m). This roundabout is one of the main entries to the city, and it occa-sionally becomes congested during the peak periods. Most legs have one lane both in the entry and in the exit. The east entry has a slip lane toward the north direction. The west leg essentially serves to access a local park and therefore has very low levels of traffic. The speeds on the approach legs are relatively low (≈55 km/h).
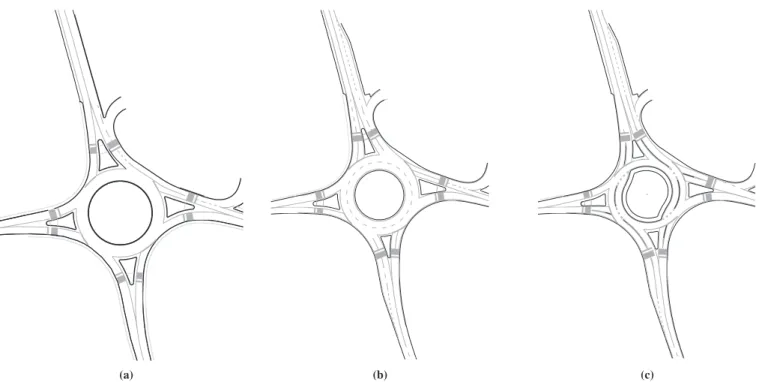
It was decided to follow a two-stage implementation. In the first stage, the existing roundabout will be widened and transformed into a conventional two-lane roundabout; in the second stage, after some months to allow driver adaptation, the splitter islands and the inner circle will be reshaped to the final turboroundabout layout (Figure 2).
The two-lane layout was designed according to Portuguese design guidelines (29). Because of some space restrictions, the east and west exits are single lanes; the north and south exits have two lanes for a limited length, and these may be extended in the future. The design of the turboroundabout was based on Dutch guidelines (30, 31).
The simulation area is centered on the intersection and extends roughly 150 m in each direction. This allows simulation of the upstream queues and minimization of the influence of nearby intersections in the simulation outputs.
traffic demand
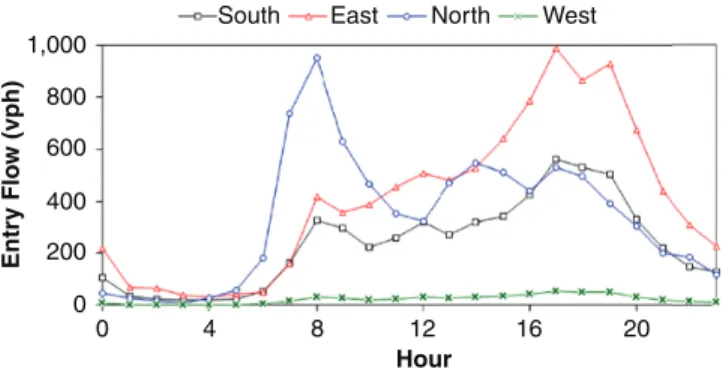
A 24-h period on a typical weekday was chosen as the modeling period to cover a wide range of traffic conditions and to ensure that, regardless of the scenario tested, no vehicles would be retained in the centroids at the end of the simulation period. Traffic flows and speeds at the north and south legs (separately for each direction) were recorded continuously with pneumatic tubes and microwave detectors (Figure 3) and were associated with directional splits observed from video recordings to produce 1-h origin–destination matrices for the whole 24-h period for a total of 23,816 vehicles. The origin–destination matrix, in proportional terms, is reasonably constant during the day, and the incidence of U-turns is negligible. For each entry, the left, through, and right directional splits are as follows: 4%, 61%, and 35%, respectively, for the south entry; 38%, 2%, and 60%, respectively, for the east entry; 43%, 56%, and 1%, respectively, for the north entry; and 30%, 50%, and 20%, respectively, for the west entry.
Currently, the roundabout has spare capacity during most periods. This result happens for several reasons. First, as shown in Figure 4, the demand peaks of the north and east entries do not overlap; second, the slip lane at the east entry allows right turns without opposing traffic; finally, almost no traffic from the south entry goes left or makes U-turns, which facilitates the entries from the north approach.
(a) (b) (c)
FIGURE 2 Choupal roundabout in Coimbra: (a) existing roundabout layout, (b) proposed two-lane roundabout layout, and (c) turboroundabout layout (north is toward top).
(a)
(c) (b)
FIGURE 3 Choupal roundabout (Coimbra): (a) aerial view, (b) installation of pneumatic detectors to obtain 24-h flow and speed data, and (c) video recordings to obtain directional splits. [Source for (a): Google Maps.]
Calibration
The model was calibrated in two steps. The first addressed the parameters of the Gipps car-following model for steady-state opera-tions and consisted of fitting of the model’s macroscopic relaopera-tions to the speed–flow data collected with a microwave sensor. A new methodology that extended previous calibration techniques to prop-erly account for the effect of the drivers’ desired speed on the steady-state traffic stream behavior was followed. The second step is mostly related to interrupted flow and driver behavior at intersections (maxi-mum acceleration, normal deceleration, reaction time at stop, and maximum yield time). To optimize these parameters, a pro cedure based on a genetic algorithm was implemented in Matlab. The objec-tive function of that procedure was minimization of the differences between the observed and simulated density time series in 1-min intervals. The full details of the calibration process are described elsewhere (32).
Evaluation FramEwork and rEsults scenarios
The main objective of the evaluation framework was to obtain quantitative measures that allowed identification of the relative merits of each layout. It was assumed that it was important to understand the circumstances under which a layout may be preferable to others more than to obtain accurate absolute performance indicators.
For this task, two main demand scenarios were defined: the first evaluated how the performance indicators changed with increasing traffic demand, if no changes in the directional splits at the entries were assumed; the second evaluated the performance of the different layouts under different directional splits, if no changes in the total entry flow at each entry were assumed.
Capacity and delays
Because both two-lane conventional roundabouts and turboround-abouts have two lanes per entry, they should each be expected to offer increased capacity compared with that of the existing single-lane layout. However, the capacity differences between the conventional and turboroundabout layouts were not so obvious. Some geometric and functional differences affect capacity. (a) On a normal roundabout, the outer circulatory lane at the major entries (north and south, in the
is used only to turn right and the opposing traffic is reduced because part of the through traffic (north–south or south–north) is physically separated at the exit. (c) Although right-turning traffic must use the right entry lane on the normal roundabout, both the left and right lanes at the minor entries of a turboroundabout can be used to make that movement.
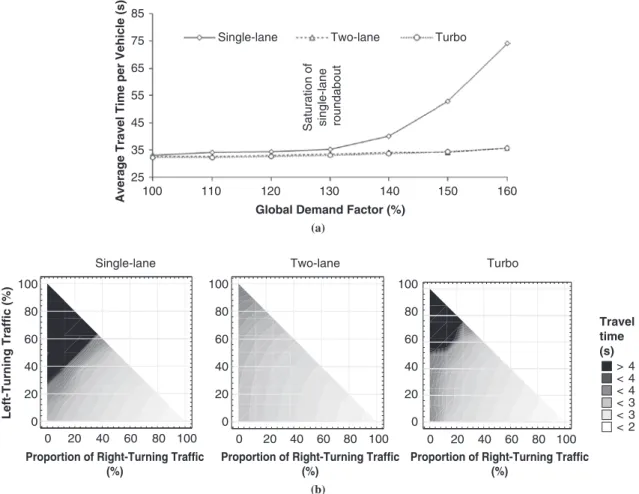
For the first scenario and for each layout, seven demand levels were simulated, and each one was for a 24-h period. Figure 5a depicts the average travel time (origin to destination) for the first demand scenario. Under the existing demand (global demand factor = 100%), the three geometries operate below capacity and drivers suffer similar delays because of random queuing. The single-lane roundabout is able to receive additional traffic (≈30%) before it becomes congested. The two-lane and the turboroundabout layouts continue operating below capacity over the whole range of flows tested.
To test the sensitivity of the delays to the directional splits, the total demand at each entry was assumed to be constant (equal to the observed demand), the traffic split was assumed to be identical for all entries, and the entry proportions were varied in 12.5% steps that covered all possible traffic splits (45 combinations for each layout; for simplicity, no U-turns were considered).
Figure 5b indicates that for all layouts, the minimum travel times are obtained when all vehicles are turning right, and the maximum occurs when all vehicles are turning left, which is related to the increase of the opposing flow at each entry. Both the two-lane and the turboroundabouts are more robust solutions (that is, they allow a wider range of traffic splits without becoming congested), but the conventional two-lane layout operates below capacity for almost every combination tested. These results are consistent with those of a previous work based on analytic gap acceptance formulas in which it was shown that a turboroundabout can be expected to offer more capacity than a two-lane roundabout only if the proportion of right-turning traffic from the minor entries is very high (8).
When the specific case of the Choupal Roundabout is considered, it can be concluded that the conversion to a turboroundabout will maintain the current uncongested operations and will thus have no major effect on actual delays, unless traffic grows significantly or the traffic splits at the entries are drastically changed (in particular, changes that lead to an increase in the number of left turns).
safety
The effects of both the uniform traffic growth and the directional splits were analyzed at three levels: traffic growth consisting of demand factors of 100% (observed), 130%, and 150% and directional splits of 60–20–20, 20–60–20, and 20–20–60 (in which each set of values indicates the percentages of right-turning, through, and left-turning traffic movements, respectively). Figure 6 illustrates these conflicts for the second demand scenario, the 20–60–20 scenario, indicating the concentration of conflicts at the most heavily congested entries (north and east) and the predominance of weaving conflicts in the two-lane layout. 0 0 4 8 Hour 12 16 20
FIGURE 4 Entry flows over 24 h (vph number of vehicles per hour).
Left-Turning Traffic (%)
Proportion of Right-Turning Traffic (%) 0 0 20 40 60 80 100 0 20 40 60 80 100 0 20 40 60 80 100 Single-lane 20 40 60 80 100
Proportion of Right-Turning Traffic (%)
Two-lane
0 20 40 60 80 100
Proportion of Right-Turning Traffic (%) 0 20 Turbo 40 60 80 100 Travel time (s) > 4 < 4 < 4 < 3 < 3 < 2 85 Single-lane
Saturation of single-lane roundabout
Two-lane Turbo
75
Average Travel Time per Vehicle (s)
65 55 45 35 25 100 110 120
Global Demand Factor (%)
130 140 150 160
(a)
(b)
FIGURE 5 Travel times for (a) increasing traffic demand factors and (b) directional splits at entry or entries.
FIGURE 6 Conflict location (20–60–20 scenario).
DeltaS (Relative Speed) < 5 m/s 5–10 m/s > 10 m/s
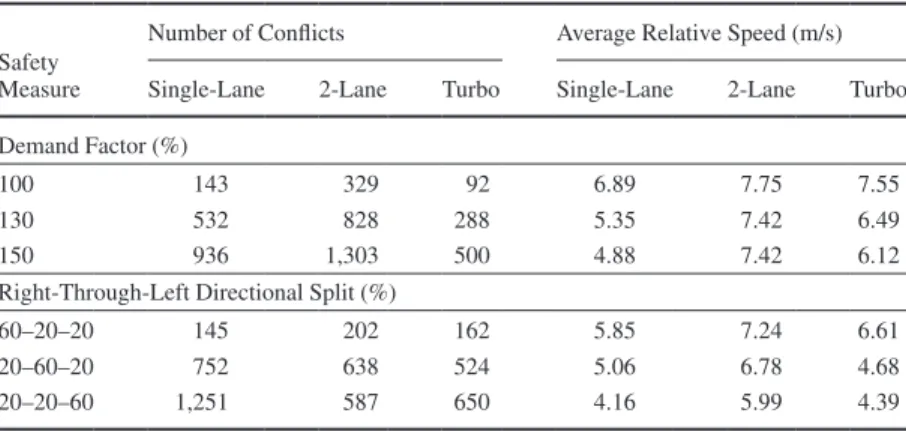
SSAM outputs are summarized in Table 1. Several conclusions about the effect of total traffic demand can be drawn. (a) As expected, the number of conflicts increases with the total amount of traffic with all layouts; results from additional simulations (not shown here) indicated exponential growth with traffic, which agrees with con-ventional accident prediction models (34). (b) The two-lane round-about is the worse solution according to both the number and the severity of conflicts, mostly because of the weaving maneuvers. (c) The turboroundabout has fewer conflicts than the single-lane solution, but the conflicts are more severe because of the increased angle between entry and circulating trajectories.
Table 1 also shows the effect of the directional split at the entry. This set of results also allows some conclusions to be drawn. (a) The number of conflicts tends to increase with the proportion of left-turning traffic, which is related to the increased number of encounters between entering and circulating traffic. However, this relation does not hold for the two-lane roundabout: fewer conflicts occur with the 20–60–20 split scenario than the 20–20–60 split scenario, which suggests that the reduction of weaving and cut-in conflicts at the exits compensates for the increase of rear-end and cut-in conflicts at the entries. (b) The average relative speeds, taken as a surrogate for accident severity, are higher when most vehicles are turning right. Although this result is counterintuitive, it is related to the reduction of the circulating traffic, which allows a higher percentage of vehicles to enter the roundabout at their desired speed and which results in conflicts with the circulating vehicles at higher speeds.
These results agree, in general, with expectations and with data for actual crashes. However, it must be emphasized that SSAM is still an emerging safety assessment method and that the relation between simulated conflicts and real accidents is not yet well determined.
Emissions
This section presents the VSP mode distributions of each round-about for all scenarios. Furthermore, the impacts of two-lane and turboroundabouts on emissions (CO2, CO, NOx, and HC) are compared with those of the single-lane roundabout.
VSP Mode Distributions
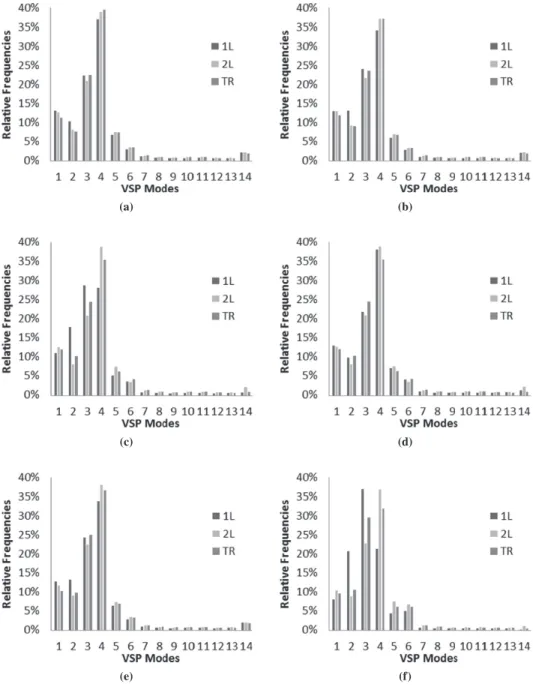
Figure 7 illustrates the percentage of time spent in each VSP mode for each roundabout and all scenarios analyzed. These VSP modes will be used later to estimate the emissions generated for each roundabout.
On average, vehicles spent most of their time in VSP Modes 1, 3, and 4, which correspond to vehicles that decelerate as they approach the roundabout, enter the circulating lanes, and accelerate as they exit the roundabout, respectively. As expected, the percentage of VSP Mode 3 (idling or low-speed situations) increased with the demand factor (Figure 7, b and c). This increase was particularly noticeable on the single-lane roundabout, whose contributions to VSP Mode 3 was enhanced almost 8% from a scenario of 100% traffic demand to one of 150% traffic demand. It should also be emphasized that vehicles spent less time in VSP Mode 3 in the two-lane roundabout solution than in the turboroundabout solution, but a higher percentage of time was spent in acceleration modes (VSP Modes 4 to 14).
For the directional split scenarios (Figure 7, d to f ), the VSP mode distributions of the three roundabouts were similar when 60% of the vehicles turned right and traveled through. However, when most of the vehicles turned left, significant differences were found. For this scenario, 37% of the time was spent in VSP Mode 3 in a single-lane roundabout. The turboroundabout also achieved a significant increase in VSP Mode 3, namely, compared with that for the two-lane solution. Nevertheless, vehicles spent more time in VSP Modes 4 to 6 in the two-lane roundabout solution, a result that was related to the acceleration modes.
Comparison of Emissions Impacts
This section compares the emission impacts of single-lane, two-lane, and turboroundabouts for different traffic demands and turn rate scenarios.
When the 100% demand factor scenario is considered, signifi-cant differences between two-lane and single-lane roundabouts were observed (Table 2). The introduction of the two-lane conventional roundabout could save up to 17% for both CO2 and NOx emissions and 21% for CO emissions. The turboroundabout was a particularly effective means to reduce local pollutant emissions: it led to average CO and HC emissions reductions of 24% and 33%, respectively. This reduction was explained by the fact that the lowest acceleration and deceleration rates were experienced by drivers on the turboround-about (Figure 7a), and the result was especially relevant for CO emissions.
For the 150% demand factor scenario, the difference in the amounts of emissions among the three types of roundabouts increased com-pared with the amounts obtained by use of the lower demand factors. In fact, the two-lane roundabout yielded the highest reductions in
150 936 1,303 500 4.88 7.42 6.12
Right-Through-Left Directional Split (%)
60–20–20 145 202 162 5.85 7.24 6.61
20–60–20 752 638 524 5.06 6.78 4.68
CO2 and NOx emissions: 21% and 18%, respectively. On the basis of the reductions in CO and HC emissions in the 150% demand factor scenario, the results indicate that the turboroundabout is the better environmental solution (18% reduction for CO emissions and 34% reduction for HC emissions).
For the directional split scenarios, the results showed that if 60% of approaching vehicles turned right, they emitted less CO2 in the two-lane roundabout than in the other roundabouts. Analyses of the remaining directional split scenarios (the 20–60–20 and 20–20–60 scenarios) resulted in the same conclusions obtained for the two-lane roundabout. As displayed in Figure 5, the turboroundabout offers less capacity than the two-lane roundabout when no traffic turns right and particularly when vehicles want to turn left (20–20–60 scenario).
At the emissions level, the results obtained also confirmed these findings.
The differences in CO2 emissions between the two-lane roundabout and the turboroundabout were larger for low rates of right-turning vehicles. When 60% of vehicles went through and turned left, they produced an amount of CO2 up to 6% greater in the turboroundabout than in the two-lane roundabout. If it is assumed that all movements are made to the right, this difference decreases to 3%. When the results between two-lane and turboroundabouts are compared, NOx emissions followed the same trend found for CO2 emissions, which means that the implementation of a turboroundabout does not lead to reductions in the amounts of these two gases. Nonetheless, CO and HC emissions savings on the turboroundabout were more significant
(a) (b)
(c) (d)
(e) (f)
FIGURE 7 Total amount of time spent in each VSP mode (relative frequency) for each roundabout and different levels of traffic flow and different turn ratios: (a) 100% demand factor, (b) 130% demand factor, (c) 150% demand factor, (d) 60–20–20 distribution scenario, (e) 20–60–20 distribution scenario, and (f) 20–20–60 distribution scenario (1L one-lane roundabout; 2L two-lane roundabout; TR turboroundabout).
(−13% and −38%, respectively) in the 20–20–60 directional split scenario.
ConCluSIonS
This research explored the effect of turboroundabouts on capacity, conflict locations, and the emissions generated from vehicles. A micro-scopic simulation approach was followed to identify the consequences of the conversion of an existing single-lane roundabout to a two-lane roundabout and then to a turboroundabout.
The results indicated no relevant differences in travel times when the roundabout is operating below capacity levels and then when it undergoes a fast increase in capacity. The single-lane roundabout offers the least capacity. Both the two-lane and turboroundabouts have two entry lanes per approach and thus offer additional capacity. Drivers on a conventional two-lane roundabout have more flexibility to select the entry lane, which allows a wider range of traffic splits before congestion occurs. Turboroundabouts offer more capacity than two-lane roundabouts only under specific and rare demand scenarios, namely, when the proportion of right turns at the minor entries is abnormally high (above 60%).
The SSAM methodology was followed to estimate the safety of the three alternatives. The two-lane roundabout was the worst solution according to both the number and the severity of conflicts, mostly because of the weaving and cut-in maneuvers. The turboroundabout had fewer conflicts than the single-lane roundabout, but the conflicts were more severe because of the increased angle between the entry and circulating trajectories.
The total emissions of vehicles moving through the roundabout were further compared. This study used the VSP methodology, which takes into account speed trajectories from the AIMSUN model, to estimate the second-by-second emissions generated from vehicles
Overall, it becomes clear that when it is necessary to implement a two-lane roundabout as an alternative to a single-lane one, commonly because of capacity considerations, a turboroundabout is probably the best option, unless a maximum output capacity is needed.
ACknowlEdgMEntS
This work was carried out in the framework of projects EMSURE (Energy and Mobility for Sustainable Regions) and AROUND (Improving Capacity and Emission Models of Roundabouts). The team from the Centre for Mechanical Technology and Automation of the University of Aveiro (TEMA) also acknowledges Portuguese Science and Technology Foundation (FCT) funding for a strate-gic project developed by the R&D Unit of TEMA in 2013 and the Luso American Foundation (FLAD). Coauthor Paulo Fernandes acknowledges the support of FCT for a scholarship.
rEFErEnCES
1. Fortuijn, L. G. H. Turbo Roundabouts: Design Principles and Safety Performance. In Transportation Research Record: Journal of the Trans-portation Research Board, No. 2096, TransTrans-portation Research Board of the National Academies, Washington, D.C., 2009, pp. 16–24.
2. Brilon, W. Studies on Roundabouts in Germany: Lessons Learned. Presented at the 3rd International Conference on Roundabouts, Carmel, Ind., 2011.
3. Tollazzi, T., M. Rencelj, and S. Turnsek. Slovenian Experiences with Alternative Types of Roundabouts—“Turbo” and “Flower” Round-abouts. Presented at the 8th International Conference on Environmental Engineering, Vilnius, Lithuania, 2011.
4. Trueblood, M. Retrofitting Closely Spaced Intersections Using the Peanut Turboroundabout Concept. Presented at the 3rd International Conference on Roundabouts, Carmel, Ind., 2011.
5. Yperman, I., and L. H. Immers. Capacity of a Turbo-Roundabout Deter-mined by Micro-Simulation. Presented at the 10th World Congress on ITS, Madrid, Spain, 2003.
6. Engelsman, J. C., and M. Uken. Turboroundabouts as an Alternative to Two Lane Roundabouts. Presented at the 26th Annual Southern African Transport Conference, Pretoria, South Africa, 2007.
7. Mauro, R., and F. Branco. Comparative Analysis of Compact Multilane Roundabouts and Turbo-Roundabouts. Journal of Transportation Engi-neering, Vol. 136, No. 4, 2010, pp. 316–322.
8. Vasconcelos, A. L. P., A. Bastos Silva, and Á. J. M. Seco. Capacity of Normal and Turbo-Roundabouts: Comparative Analysis. Proceedings of the Institution of Civil Engineers—Transport, Vol. 167, No. 2, 2014, pp. 88–99.
9. Mauro, R., and M. Cattani. Potential Accident Rate of Turbo-Roundabouts. Presented at the 4th International Symposium on Highway Geometric Design, Valencia, Spain, 2010.
10. Rodegerdts, L., J. Bansen, C. Tiesler, J. Knudsen, E. Myers, M. Johnson, M. Moule, B. Persaud, C. Lyon, S. Hallmark, H. Isebrands, R. B. Crown, B. Guichet, and A. O’Brien. NCHRP Report 672: Roundabouts: An Infor-mational Guide, 2nd ed. Transportation Research Board of the National Academies, Washington, D.C., 2010.
11. Chen, Y., B. Persaud, E. Sacchi, and M. Bassani. Investigation of Models for Relating Roundabout Safety to Predicted Speed. Accident Analysis and Prevention, Vol. 50, 2013, pp. 196–203.
Turbo (%) −15 −24 −16 −33 130 Single-lane (kg) 3,886.40 25.73 11.92 0.75 2-lane (%) −15 −15 −14 −17 Turbo (%) −14 −19 −14 −31 150 Single-lane (kg) 4,800.46 29.86 14.49 0.93 2-lane (%) −21 −15 −18 −22 Turbo (%) −19 −18 −17 −34
Right-Through-Left Directional Split (%)
60–20–20 Single-lane (kg) 2,576.73 13.06 7.41 0.45 2-lane (%) −11 −13 −10 −13 Turbo (%) −8 −11 −7 −26 20–60–20 Single-lane (kg) 2,899.02 18.81 8.81 0.56 2-lane (%) −14 −15 −13 −17 Turbo (%) −8 −14 −8 −27 20–20–60 Single-lane (kg) 3,751.45 18.05 10.71 0.69 2-lane (%) −29 −7 −23 −29 Turbo (%) −23 −13 −20 −38
aPercentages represent variations in emissions in relation to those for single-lane roundabout for all scenarios during a 24-h period.
12. Salamati, K., M. C. Coelho, P. J. Fernandes, N. M. Rouphail, H. C. Frey, and J. Bandeira. Emissions Estimation at Multilane Roundabouts: Effects of Movement and Approach Lane. In Transportation Research Record: Journal of the Transportation Research Board, No. 2389, Transportation Research Board of the National Academies, Washington, D.C., 2013, pp. 12–21.
13. Anya, A. R., N. M. Rouphail, H. C. Frey, and B. Liu. Method and Case Study for Quantifying Local Emissions Impacts of a Transportation Improvement Project Involving Road Realignment and Conversion to a Multilane Roundabout. Presented at 92nd Annual Meeting of the Trans-portation Research Board, Washington, D.C., 2013.
14. Coelho, M. C., T. L. Farias, and N. M. Rouphail. Effect of Roundabout Operations on Pollutant Emissions. Transportation Research Part D: Transport and Environment, Vol. 11, No. 5, 2006, pp. 333–343. 15. Barceló, J., and J. Casas. Dynamic Network Simulation with AIMSUN.
In Simulation Approaches in Transportation Analysis, Springer, New York, 2005, pp. 57–98.
16. Tian, Z. Z., T. Urbanik II, R. Engelbrecht, and K. Balke. Variations in Capacity and Delay Estimates from Microscopic Traffic Simulation Models. In Transportation Research Record: Journal of the Transporta-tion Research Board, No. 1802, TransportaTransporta-tion Research Board of the National Academies, Washington, D.C., 2002, pp. 23–31.
17. Pu, L., and R. Joshi. Surrogate Safety Assessment Model (SSAM) Software User Manual. FHWA, U.S. Department of Transportation, 2008. 18. Cunto, F., and F. F. Saccomanno. Calibration and Validation of Simulated
Vehicle Safety Performance at Signalized Intersections. Accident Analysis and Prevention, Vol. 40, No. 3, 2008, pp. 1171–1179.
19. Duong, D., F. Saccomanno, and B. Hellinga. Calibration of Micro-scopic Traffic Model for Simulating Safety Performance. Presented at 89th Annual Meeting of the Transportation Research Board, Washington, D.C., 2010.
20. Al-Ghandour, M. N., B. J. Schroeder, B. M. Williams, and W. J. Rasdorf. Conflict Models for Single-Lane Roundabout Slip Lanes from Microsimulation: Development and Validation. In Transporta-tion Research Record: Journal of the TransportaTransporta-tion Research Board, No. 2236, Transportation Research Board of the National Academies, Washington, D.C., 2011, pp. 92–101.
21. Gettman, D., L. Pu, T. Sayed, and S. G. Shelby. Surrogate Safety Assess-ment Model and Validation. Final report. FHWA, U.S. DepartAssess-ment of Transportation, 2008.
22. Vogel, K. A Comparison of Headway and Time to Collision as Safety Indicators. Accident Analysis and Prevention, Vol. 35, No. 3, 2003, pp. 427–433.
23. Gettman, D., and L. Head. Surrogate Safety Measures from Traffic Simulation Models. In Transportation Research Record: Journal of the Transportation Research Board, No. 1840, Transportation Research Board of the National Academies, Washington, D.C., 2003, pp. 104–115. 24. Laureshyn, A., Å. Svensson, and C. Hydén. Evaluation of Traffic Safety, Based on Micro-Level Behavioural Data: Theoretical Framework and First Implementation. Accident Analysis and Prevention, Vol. 42, No. 6, 2010, pp. 1637–1646.
25. Methodology for Developing Modal Emission Rates for EPA’s Multi-Scale Motor Vehicle and Equipment Emission System. Report EPA420. U.S. Environmental Protection Agency, Aug. 2002.
26. Frey, H. C., K. Zhang, and N. M. Rouphail. Fuel Use and Emissions Comparisons for Alternative Routes, Time of Day, Road Grade, and Vehicles Based on In-Use Measurements. Environmental Science and Technology, Vol. 42, No. 7, 2008, pp. 2483–2489.
27. Coelho, M. C., H. C. Frey, N. M. Rouphail, H. Zhai, and L. Pelkmans. Assessing Methods for Comparing Emissions from Gasoline and Diesel Light-Duty Vehicles Based on Microscale Measurements. Transportation Research Part D: Transport and Environment, Vol. 14, No. 2, 2009, pp. 91–99.
28. Automobile Industry Statistics, 2010 Edition. Automobile Association of Portugal, Lisbon, 2012.
29. Bastos Silva, A., and Á. J. M. Seco. Dimensionamento de Rotundas-Documento Síntese. In Disposições Normativas, Instituto de Infraestru-turas Rodoviárias, 2012.
30. Royal Haskoning DHV. Roundabouts and Design. Ministry of Transport, Public Works and Water Management, The Hague, Netherlands, 2009. 31. Turborotondes. Publicatie 257. CROW, Ede, Netherlands, April 2008. 32. Vasconcelos, A. L. P., Á. Seco, and A. Bastos Silva. Hybrid Calibration
of Microscopic Simulation Models. Advances in Intelligent Systems and Computing, Vol. 262, 2014, pp. 307–320.
33. Hagring, O., N. M. Rouphail, and H. A. Sørensen. Comparison of Capacity Models for Two-Lane Roundabouts. In Transportation Research Record: Journal of the Transportation Research Board, No. 1852, Trans-portation Research Board of the National Academies, Washington, D.C., 2003, pp. 114–123.
34. Sacchi, E., M. Bassani, and B. Persaud. Comparison of Safety Perfor-mance Models for Urban Roundabouts in Italy and Other Countries. In Transportation Research Record: Journal of the Transportation Research Board, No. 2265, Transportation Research Board of the National Academies, Washington, D.C., 2011, pp. 253–259.